A handbook of statistical analyses using stata
Bạn đang xem bản rút gọn của tài liệu. Xem và tải ngay bản đầy đủ của tài liệu tại đây (2.57 MB, 304 trang )
A Handbook of
Statistical
Analyses
using
Stata
Third Edition
© 2004 by CRC Press LLC
CHAPMAN & HALL/CRC
A CRC Press Company
Boca Raton London New York Washington, D.C.
A Handbook of
Statistical
Analyses
using
Stata
Sophia Rabe-Hesketh
Brian Everitt
Third Edition
© 2004 by CRC Press LLC
This book contains information obtained from authentic and highly regarded sources. Reprinted material
is quoted with permission, and sources are indicated. A wide variety of references are listed. Reasonable
efforts have been made to publish reliable data and information, but the author and the publisher cannot
assume responsibility for the validity of all materials or for the consequences of their use.
Neither this book nor any part may be reproduced or transmitted in any form or by any means, electronic
or mechanical, including photocopying, microfilming, and recording, or by any information storage or
retrieval system, without prior permission in writing from the publisher.
The consent of CRC Press LLC does not extend to copying for general distribution, for promotion, for
creating new works, or for resale. Specific permission must be obtained in writing from CRC Press LLC
for such copying.
Direct all inquiries to CRC Press LLC, 2000 N.W. Corporate Blvd., Boca Raton, Florida 33431.
Trademark Notice: Product or corporate names may be trademarks or registered trademarks, and are
used only for identification and explanation, without intent to infringe.
Visit the CRC Press Web site at www.crcpress.com
© 2004 by CRC Press LLC
No claim to original U.S. Government works
International Standard Book Number 1-58488-404-5
Library of Congress Card Number 2003065361
Printed in the United States of America 1 2 3 4 5 6 7 8 9 0
Printed on acid-free paper
Library of Congress Cataloging-in-Publication Data
Rabe-Hesketh, S.
A handbook of statistical analyses using Stata / Sophia Rabe-Hesketh, Brian S. Everitt.—
[3rd ed.].
p. cm.
Includes bibliographical references and index.
ISBN 1-58488-404-5 (alk. paper)
1. Stata. 2. Mathematical statistics—Data processing. I. Everitt, Brian. II. Title.
QA276.4.R33 2003
519.5′0285′5369—dc22 2003065361
© 2004 by CRC Press LLC
Preface
Stata is an exciting statistical package that offers all standard and
many non-standard methods of data analysis. In addition to general
methods such as linear, logistic and Poisson regression and generalized
linear models, Stata provides many more specialized analyses, such as
generalized estimating equations from biostatistics and the Heckman
selection model from econometrics. Stata has extensive capabilities for
the analysis of survival data, time series, panel (or longitudinal) data,
and complex survey data. For all estimation problems, inferences can
be made more robust to model misspecification using bootstrapping or
robust standard errors based on the sandwich estimator. In each new
release of Stata, its capabilities are significantly enhanced by a team of
excellent statisticians and developers at Stata Corporation.
Although extremely powerful, Stata is easy to use, either by point-
and-click or through its intuitive command syntax. Applied researchers,
students, and methodologists therefore all find Stata a rewarding envi-
ronment for manipulating data, carrying out statistical analyses, and
producing publication quality graphics.
Stata also provides a powerful programming language making it easy
to implement a ‘tailor-made’ analysis for a particular application or to
write more general commands for use by the wider Stata community.
In fact we consider Stata an ideal environment for developing and dis-
seminating new methodology. First, the elegance and consistency of
the programming language appeals to the esthetic sense of methodol-
ogists. Second, it is simple to make new commands behave in every
way like Stata’s own commands, making them accessible to applied re-
searchers and students. Third, Stata’s emailing list Statalist, The Stata
Journal, the Stata Users’ Group Meetings, and the Statistical Software
Components (SSC) archive on the internet all make exchange and dis-
cussion of new commands extremely easy. For these reasons Stata is
© 2004 by CRC Press LLC
constantly kept up-to-date with recent developments, not just by its
own developers, but also by a very active Stata community.
This handbook follows the format of its two predecessors, A Hand-
book of Statistical Analysis using S-PLUS and A Handbook of Statistical
Analysis using SAS. Each chapter deals with the analysis appropriate
for a particular application. A brief account of the statistical back-
ground is included in each chapter including references to the litera-
ture, but the primary focus is on how to use Stata, and how to interpret
results. Our hope is that this approach will provide a useful comple-
ment to the excellent but very extensive Stata manuals. The majority
of the examples are drawn from areas in which the authors have most
experience, but we hope that current and potential Stata users from
outside these areas will have little trouble in identifying the relevance
of the analyses described for their own data.
This third edition contains new chapters on random effects mod-
els, generalized estimating equations, and cluster analysis. We have
also thoroughly revised all chapters and updated them to make use of
new features introduced in Stata 8, in particular the much improved
graphics.
Particular thanks are due to Nick Cox who provided us with exten-
sive general comments for the second and third editions of our book,
and also gave us clear guidance as to how best to use a number of Stata
commands. We are also grateful to Anders Skrondal for commenting
on several drafts of the current edition. Various people at Stata Cor-
poration have been very helpful in preparing both the second and third
editions of this book. We would also like to acknowledge the usefulness
of the Stata Netcourses in the preparation of the first edition of this
book.
All the datasets can be accessed on the internet at the following
Web sites:
/>
/>BioComp/stataBook.shtml
S. Rabe-Hesketh
B. S. Everitt
London
© 2004 by CRC Press LLC
Dedication
To my parents, Birgit and Georg Rabe
Sophia Rabe-Hesketh
To my wife, Mary Elizabeth
Brian S. Everitt
© 2004 by CRC Press LLC
Contents
1ABriefIntroductiontoStata
1.1Gettinghelpandinformation
1.2RunningStata
1.3Conventionsusedinthisbook
1.4DatasetsinStata
1.5Statacommands
1.6Datamanagement
1.7Estimation
1.8Graphics
1.9Stataasacalculator
1.10Briefintroductiontoprogramming
1.11KeepingStatauptodate
1.12Exercises
2 Data Description and Simple Inference: Female
PsychiatricPatients
2.1Descriptionofdata
2.2Groupcomparisonandcorrelations
2.3AnalysisusingStata
2.4Exercises
3 Multiple Regression: Determinants of Pollution in
U.S.Cities
3.1Descriptionofdata
3.2Themultipleregressionmodel
3.3AnalysisusingStata
3.4Exercises
4AnalysisofVarianceI:TreatingHypertension
© 2004 by CRC Press LLC
4.1Descriptionofdata
4.2Analysisofvariancemodel
4.3AnalysisusingStata
4.4Exercises
5 Analysis of Variance II: Effectiveness of Slimming
Clinics
5.1Descriptionofdata
5.2Analysisofvariancemodel
5.3AnalysisusingStata
5.4Exercises
6 Logistic Regression: Treatment of Lung Cancer
andDiagnosisofHeartAttacks
6.1Descriptionofdata
6.2Thelogisticregressionmodel
6.3AnalysisusingStata
6.4Exercises
7 Generalized Linear Models: Australian School
Children
7.1Descriptionofdata
7.2Generalizedlinearmodels
7.3AnalysisusingStata
7.4Exercises
8 Summary Measure Analysis of Longitudinal Data:
TheTreatmentofPost-NatalDepression
8.1Descriptionofdata
8.2Theanalysisoflongitudinaldata
8.3AnalysisusingStata
8.4Exercises
9 Random Effects Models: Thought disorder and
schizophrenia
9.1Descriptionofdata
9.2Randomeffectsmodels
9.3AnalysisusingStata
9.4Thoughtdisorderdata
9.5Exercises
10 Generalized Estimating Equations: Epileptic
SeizuresandChemotherapy
10.1Introduction
10.2Generalizedestimatingequations
© 2004 by CRC Press LLC
10.3AnalysisusingStata
10.4Exercises
11SomeEpidemiology
11.1Descriptionofdata
11.2Introductiontoepidemiology
11.3AnalysisusingStata
11.4Exercises
12 Survival Analysis: Retention of Heroin Addicts in
MethadoneMaintenanceTreatment
12.1Descriptionofdata
12.2Survivalanalysis
12.3AnalysisusingStata
12.4Exercises
13 Maximum Likelihood Estimation: Age of Onset of
Schizophrenia
13.1Descriptionofdata
13.2Finitemixturedistributions
13.3AnalysisusingStata
13.4Exercises
14 Principal Components Analysis: Hearing
MeasurementusinganAudiometer
14.1Descriptionofdata
14.2Principalcomponentanalysis
14.3AnalysisusingStata
14.4Exercises
15 Cluster Analysis: Tibetan Skulls and Air
PollutionintheUSA
15.1Descriptionofdata
15.2Clusteranalysis
15.3AnalysisusingStata
15.4Exercises
Appendix:AnswerstoSelectedExercises
References
© 2004 by CRC Press LLC
Distributors for Stata
The distributor for Stata in the United States is:
Stata Corporation
4905 Lakeway Drive
College Station, TX 77845
email:
Web site:
Telephone: 979-696-4600
In the United Kingdom the distributor is:
Timberlake Consultants
Unit B3, Broomsleigh Business Park
Worsley Bridge Road
London SE26 5BN
email:
Web site:
Telephone: 44(0)-20-8697-3377
For a list of distributors in other countries, see the Stata Web page.
© 2004 by CRC Press LLC
Chapter 1
A Brief Introduction to
Stata
1.1 Getting help and information
Stata is a general purpose statistics package developed and maintained
by Stata Corporation. There are several forms or ‘flavors’ of Stata,
‘Intercooled Stata’, the more limited ‘Small Stata’ and the extended
‘Stata/SE’ (Special Edition), differing mostly in the maximum size of
dataset and processing speed. Each exists for Windows (98, 2000,
XP, and NT), Unix platforms, and the Macintosh. In this book, we
will describe Intercooled Stata for Windows although most features are
shared by the other flavors of Stata.
The base documentation set for Stata consists of seven manuals:
Stata Getting Started, Stata User’s Guide, Stata Base Reference Man-
uals (four volumes), and Stata Graphics Reference Manual. In addition
there are more specialized reference manuals such as the Stata Pro-
gramming Reference Manual and the Stata Cross-Sectional Time-Series
Reference Manual (longitudinal data analysis). The reference manuals
provide extremely detailed information on each command while the
User’s Guide describes Stata more generally. Features that are spe-
cific to the operating system are described in the appropriate Getting
Started manual, e.g., Getting Started with Stata for Windows.
Each Stata command has associated with it a help file that may be
viewed within a Stata session using the help facility. Both the help-files
and the manuals refer to the Base Reference Manuals by [R] name of
entry,totheUser’s Guide by [U] chapter or section number and
name,theGraphics Manual by [G] name of entry,etc. (seeStata
© 2004 by CRC Press LLC
Getting Started manual, immediately after the table of contents, for a
complete list).
There are an increasing number of books on Stata, including Hamil-
ton (2004) and Kohler and Kreuter (2004), as well as books in German,
French, and Spanish. Excellent books on Stata for particular types
of analysis include Hills and De Stavola (2002), A Short Introduction
to Stata for Biostatistics, Long and Freese (2003), Regression Models
for Categorical Dependent Variables using Stata, Cleves, Gould and
Gutierrez (2004), An Introduction to Survival Analysis Using Stata,
and Hardin and Hilbe (2001), Generalized Linear Models and Exten-
sions.See for
up-to-date information on these and other books.
TheStataWebpageatoffersmuchuse-
fulinformationforlearningStataincludinganextensiveseriesof‘fre-
quently asked questions’ (FAQs). Stata also offers internet courses,
called netcourses. These courses take place via a temporary mailing
list for course organizers and ‘attenders’. Each week, the course or-
ganizers send out lecture notes and exercises which the attenders can
discuss with each other until the organizers send out the answers to the
exercises and to the questions raised by attenders.
The UCLA Academic Technology Services offer useful textbook and
paper examples at showing
how analyses can be carried out using Stata. Also very helpful for
learning Stata are the regular columns From the helpdesk and Speaking
Stata in The Stata Journal;seewww.stata-journal.com.
One of the exciting aspects of being a Stata user is being part of
a very active Stata community as reflected in the busy Statalist mail-
ing list, Stata Users’ Group meetings taking place every year in the
UK, USA and various other countries, and the large number of user-
contributedprograms;seealsoSection1.11.Statalistalsofunctionsas
a technical support service with Stata staff and expert users such as
Nick Cox offering very helpful responses to questions.
1.2 Running Stata
This section gives an overview of what happens in a typical Stata ses-
sion, referring to subsequent sections for more details.
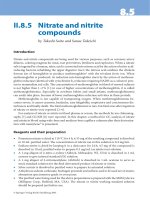
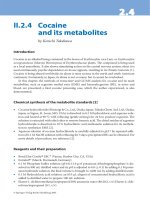
1.2.1 Stata windows
When Stata is started, a screen opens as shown in Figure 1.1 containing
four windows labeled:
© 2004 by CRC Press LLC
Stata Command
Stata Results
Review
Variables
Figure 1.1: Stata windows.
Each of the Stata windows can be resized and moved around in the
usual way; the Variables and Review windows can also be moved out-
side the main window. To bring a window forward that may be ob-
scured by other windows, make the appropriate selection in the Win-
dow menu. The fonts in a window can be changed by clicking on the
menu button
on the top left of that window’s menu bar. All these
settings are automatically saved when Stata is closed.
1.2.2 Datasets
Stata datasets have the .dta extension and can be loaded into Stata in
the usual way through the File menu (for reading other data formats;
© 2004 by CRC Press LLC
seeSection1.4.1).Asinotherstatisticalpackages,adatasetisamatrix
wherethecolumnsrepresentvariables(withnamesandlabels)and
therowsrepresentobservations.Whenadatasetisopen,thevariable
namesandvariablelabelsappearintheVariableswindow.Thedataset
maybeviewedasaspreadsheetbyopeningtheDataBrowserwith
the
buttonandeditedbyclicking toopentheDataEditor.
BoththeDataBrowserandtheDataEditorcanalsobeopenedthrough
theWindowmenu.Notehowever,thatnothingelsecanbedonein
StatawhiletheDataBrowserorDataEditorareopen(e.g.theStata
Commandwindowdisappears).SeeSection1.4formoreinformation
ondatasets.
1.2.3Commandsandoutput
Untilrelease8.0,Statawasentirelycommand-drivenandmanyusers
stillpreferusingcommandsasfollows:acommandistypedintheStata
CommandwindowandexecutedbypressingtheReturn(orEnter)key.
Thecommandthenappearsnexttoafullstop(period)intheStata
Resultswindow,followedbytheoutput.
IftheoutputproducedislongerthantheStataResultswindow,
more appearsatthebottomofthescreen.Pressinganykeyscrolls
theoutputforwardonescreen.Thescroll-barmaybeusedtomoveup
anddownpreviouslydisplayedoutput.However,onlyacertainamount
ofpastoutputisretainedinthiswindow.Forthisreasonandtosave
outputforlater,itisusefultoopenalogfile;seeSection1.2.6.
Stata is ready to accept a new command when the prompt (a period)
appears at the bottom of the screen. If Stata is not ready to receive
new commands because it is still running or has not yet displayed all
the current output, it may be interrupted by holding down Ctrl and
pressing the Pause/Break key or by pressing the red Break button
.
A previous command can be accessed using the PgUp and PgDn
keys or by selecting it from the Review window where all commands
from the current Stata session are listed (see Figure 1.1). The command
may then be edited if required before pressing Return to execute the
command.
Most Stata commands refer to a list of variables, the basic syntax
being command varlist. For example, if the dataset contains variables
x, y,andz,then
list x y
lists the values of x and y. Other components may be added to the
command; for example, adding if exp after varlist causes the com-
© 2004 by CRC Press LLC
mandtoprocessonlythoseobservationssatisfyingthelogicalexpres-
sionexp.Optionsareseparatedfromthemaincommandbyacomma.
Thecompletecommandstructureanditscomponentsaredescribedin
Section1.5.
1.2.4GUIversuscommands
Sincerelease8.0,StatahasaGraphicalUserInterface(GUI)thatal-
lowsalmostallcommandstobeaccessedviapoint-and-click.Simply
startbyclickingintotheData,Graphics,orStatisticsmenus,make
therelevantselections,fillinadialogbox,andclickOK.Statathen
behavesexactlyasifthecorrespondingcommandhadbeentypedwith
thecommandappearingintheStataResultsandReviewwindowsand
beingaccessibleviaPgUpandPgDn.
Agreatadvantageofthemenusystemisthatitisintuitivesothat
acompletenovicetoStatacouldlearntorunalinearregressionin
afewminutes.Adisadvantageisthatpointingandclickingcanbe
time-consumingifalargenumberofanalysesarerequiredandcannot
beautomated.Commands,ontheotherhand,canbesavedinafile
(calledado-fileinStata)andrunagainatalatertime.Inouropinion,
themenusystemisagreatdeviceforfindingoutwhichcommandis
neededandlearninghowitworks,butseriousstatisticalanalysisisbest
undertakenusingcommands.Inthisbookwethereforesayverylittle
aboutthemenusanddialogs(theyarelargelyself-explanatoryafter
all),butseeSection1.8foranexampleofcreatingagraphthroughthe
dialogs.
1.2.5Do-files
Itisusefultobuildupafilecontainingthecommandsnecessaryto
carryoutaparticulardataanalysis.ThismaybedoneusingStata’s
Do-fileEditororanyothereditor.TheDo-fileEditormaybeopened
byclicking
orbyselectingDo fromtheFilemenu.Commands
canthenbetypedinandrunasabatcheitherbyclickinginto
in
theDo-fileEditororbyusingthecommand
dodofile
Alternatively,asubsetofcommandscanbehighlightedandexecuted
byclickinginto
.Thedo-filecanbesavedforuseinafutureStata
session.SeeSection1.10formoreinformationondo-files.
© 2004 by CRC Press LLC
1.2.6 Log files
It is useful to open a log file at the beginning of a Stata session. Press
the button
, type a filename into the dialog box, and choose Save.
By default, this produces a SMCL (Stata Markup and Control Lan-
guage, pronounced ‘smicle’) file with extension .smcl, but an ordinary
ASCII text file can be produced by selecting the .log extension. If the
file already exists, another dialog opens to allow you to decide whether
to overwrite the file with new output or to append new output to the
existing file.
The log file can be viewed in the Stata Viewer during the Stata
session (again through
) and is automatically saved when it is closed.
Log files can also be opened, viewed, and closed by selecting Log from
the File menu, followed by Begin , View ,orClose. The following
commands can be used to open and close a log file mylog, replacing the
old one if it already exists:
log using mylog, replace
log close
To view a log file produced in a previous Stata session, select File →
Log → View and specify the full path of the log file. The log may
then be printed by selecting Print Viewer from the File menu.
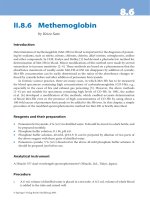
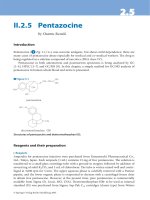
1.2.7 Getting help
Help may be obtained by clicking on Help which brings up the menu
shown in Figure 1.2. To get help on a Stata command, assuming the
command name is known, select Stata Command To find the
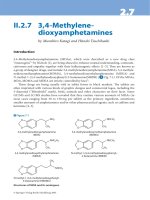
appropriate Stata command first, select Search which opens up
the dialog in Figure 1.3. For example, to find out how to fit a Cox
regression, type ‘survival’ under Keywords and press OK. This opens
the Stata Viewer containing a list of relevant command names or topics
for which help files or Frequently Asked Questions (FAQs) are available.
Each entry in this list includes a blue keyword (a hyperlink)thatmay
be selected to view the appropriate help file or FAQ. Each help file
contains hyperlinks to other relevant help files. The search and help
files may also be accessed using the commands
search survival
help stcox
Help will then appear in the Stata Results window instead of the Stata
Viewer, where words displayed in blue also represent hyperlinks to other
© 2004 by CRC Press LLC
Figure 1.2: Menu for help.
Figure 1.3: Dialog for search.
© 2004 by CRC Press LLC
files.
IfthecomputerrunningStataisconnectedtotheinternet,youcan
alsosearchthroughmaterialsontheinternet,tofindforinstanceuser-
contributedprogramsbyselecting‘Searchnetresources’inthesearch
dialog.Thefinalselection,‘Searchall’performsasearchacrossthehelp
files,FAQs,andnetmaterials.Thisisequivalenttousingthefindit
keywordcommand.Morerefinedsearchescanbecarriedoutusingthe
searchcommand(seehelpsearch).Theotherselectionsinthehelp
dialog,News,OfficialUpdates,SJandUser-writtenPrograms,
andStataWebSiteallenableaccesstorelevantinformationonthe
Web(seeSection1.11onkeepingStataup-to-date).
1.2.8 Closing Stata
Stata can be closed in three ways:
click on the Close button at the top right-hand corner of
the Stata screen
select Exit from the File menu
type exit, clear in the Stata Commands window, and press
Return.
1.3 Conventions used in this book
In this book we will use typewriter font like this for anything that
could be typed into the Stata Command window or a do-file, that is,
command names, options, variable names, etc. In contrast, italicized
words are not supposed to be typed; they should be substituted by
another word. For example, summarize varname means that varname
should be substituted by a specific variable name, such as age, giving
summarize age. We will usually display sequences of commands as
follows:
summarize age
drop age
If a command continues over two lines, we use /* at the end of the first
line and */ at the beginning of the second line to make Stata ignore
the linebreak. An alternative would be to use /// at the end of the
line. Note that these methods are for use in a do-file and do not work
in the Stata Command window where they would result in an error. In
the Stata Command window, commands can wrap over several lines.
© 2004 by CRC Press LLC
Output taking very little space is displayed immediately following
the commands but without indentation and in a smaller font:
display 1
1
Output taking up more space is shown in a numbered display floating
in the text. Some commands produce little notes, for example, the
generate command prints out how many missing values are generated.
We will usually not show such notes.
1.4 Datasets in Stata
1.4.1 Data input and output
Stata has its own data format with default extension .dta. Reading
and saving a Stata file are straightforward. If the filename is bank.dta,
the commands are
use bank
save bank
If the data are not stored in the current directory, then the complete
path must be specified, as in the command
use c:\user\data\bank
However, the least error-prone way of keeping all the files for a particu-
lar project in one directory is to change to that directory and save and
read all files without their pathname:
cd c:\user\data
use bank
save bank
Data supplied with Stata can be read in using the sysuse command.
For instance, the famous auto.dta data can be read using
sysuse auto
Before reading a file into Stata, all data already in memory need
to be cleared, either by running clear before the use command or by
using the option clear as follows:
© 2004 by CRC Press LLC
use bank, clear
If we wish to save data under an existing filename, this results in an
error message unless we use the option replace as follows:
save bank, replace
For large datasets it is sometimes necessary to increase the amount
of memory Stata allocates to its data areas from the default of 1
megabyte. For example, when no dataset is loaded (e.g., after issu-
ing the command clear), set the memory to 2 megabytes using
set memory 2m
The memory command without arguments gives information on how
much memory is being used and how much is available.
If the data are not available in Stata format, they may be converted
to Stata format using another package (e.g., Stat/Transfer) or saved as
an ASCII file (although the latter option means losing all the labels).
When saving data as ASCII, missing values should be replaced by some
numerical code.
There are three commands available for reading different types of
ASCII data: insheet is for files containing one observation (on all
variables) per line with variables separated by tabs or commas, where
the first line may contain the variable names; infile with varlist (free
format) allows line breaks to occur anywhere and variables to be sep-
arated by spaces as well as commas or tabs; infix is for files with
fixed column format but a single observation can go over several lines;
infile with a dictionary (fixed format) is the most flexible command
since the dictionary can specify exactly what lines and columns contain
what information.
Data can be saved as ASCII using outfile or outsheet. Finally,
odbc can be used to load, write, or view data from Open Data Base
Connectivity (ODBC) sources. See help infiling or [U] 24 Com-
mands to input data for an overview of commands for reading data.
Only one dataset may be loaded at any given time but a dataset
may be combined with the currently loaded dataset using the command
mergeorappendtoaddobservationsorvariables;seealsoSection1.6.2.
1.4.2 Variables
There are essentially two kinds of variables in Stata: string and nu-
meric. Each variable can be one of a number of storage types that
© 2004 by CRC Press LLC
requiredifferentnumbersofbytes.Thestoragetypesarebyte,int,
long,float,anddoublefornumericvariablesandstr1tostr80
(str244inStata/SE)forstringvariablesofdifferentlengths.Besides
thestoragetype,variableshaveassociatedwiththemaname,alabel,
andaformat.Thenameofavariableycanbechangedtoxusing
renameyx
Thevariablelabelcanbedefinedusing
labelvariablex"costinpounds"
andtheformatofanumericvariablecanbesetto‘generalnumeric’
withtwodecimalplacesusing
formatx%7.2g
Numericvariables
Amissingvaluesinanumericvariableisrepresentedbyaperiod‘.’
(systemmissingvalues),orbyaperiodfollowedbyaletter,suchas.a,
.b.etc.Missingvaluesareinterpretedasverylargepositivenumbers
with.<.a<.b,etc.Notethatthiscanleadtomistakesinlogical
expressions;seealsoSection1.5.2.Numericalmissingvaluecodes(such
as ‘−99’) may be converted to missing values (and vice versa) using the
command mvdecode. For example,
mvdecode x, mv(-99)
replaces all values of variable x equal to −99 by periods and
mvencode x, mv(-99)
changes the missing values back to −99.
Numeric variables can be used to represent categorical or continuous
variables including dates. For categorical variables it is not always easy
to remember which numerical code represents which category. Value
labels can therefore be defined as follows:
label define s 1 married 2 divorced 3 widowed 4 single
label values marital s
The categories can also be recoded, for example
© 2004 by CRC Press LLC
recode marital 2/3=2 4=3
merges categories 2 and 3 into category 2 and changes category 4 to 3.
Dates are defined as the number of days since 1/1/1960 and can
be displayed using a date format such as %d. For example, listing the
variable time in %7.0g format gives
list time
time
1. 14976
2. 200
which is not as easy to interpret as
format time %d
list time
time
1. 01jan2001
2. 19jul1960
See help dfmt for other date formats.
String variables
String variables are typically used for categorical variables or identi-
fiers and in some cases for dates (e.g., if the file was saved as an ASCII
file from SPSS). In Stata, it is generally advisable to represent these
variables by numeric variables, and conversion from string to numeric
is straightforward. A categorical string variable (or identifier) can be
converted to a numeric variable using the command encode which re-
places each unique string by an integer and uses that string as the label
for the corresponding integer value. The command decode converts the
labeled numeric variable back to a string variable.
A string variable string1 representing dates can be converted to
numeric using the function date(string1, string2) where string2 is a
permutation of "dmy" to specify the order of the day, month, and year
in string1. For example, the commands
© 2004 by CRC Press LLC
displaydate("30/1/1930","dmy")
and
displaydate("january30,1930","mdy")
bothreturnthenegativevalue−10928becausethedateis10928days
before1/1/1960.
1.5Statacommands
Typinghelplanguagegivesthefollowinggenericcommandstructure
formostStatacommands:
[byvarlist:]command[varlist][=exp][ifexp][inrange]
[weight][usingfilename][,options]
Thehelpfilecontainslinkstoinformationoneachofthecomponents,
andwewillbrieflydescribethemhere:
[byvarlist:]instructsStatatorepeatthecommandforeachcombi-
nationofvaluesinthelistofvariablesvarlist.
commandisthenameofthecommandandcanoftenbeabbreviated;
forexample,thecommanddisplaycanbeabbreviatedasdis.
[varlist]isthelistofvariablestowhichthecommandapplies.
[=exp]isanexpression.
[ifexp]restrictsthecommandtothatsubsetoftheobservationsthat
satisfiesthelogicalexpressionexp.
[inrange]restrictsthecommandtothoseobservationswhoseindices
lieinaparticularrangerange.
[weight]allowsweightstobeassociatedwithobservations(seeSec-
tion1.7).
[using filename] specifies the filename to be used.
[,options] a comma is only needed if options are used; options are
specific to the command and can often be abbreviated.
For any given command, some of these components may not be
available; for example, list does not allow [using filename]. The
© 2004 by CRC Press LLC
help files for specific commands specify which components are avail-
able, using the same notation as above, with square brackets enclosing
components that are optional. For example, help log gives
log using filename [, noproc append replace [text|smcl] ]
implying that [by varlist:] is not allowed and that using filename
is required, whereas the three options noproc, append, replace and
[text|smcl] (meaning text or smcl) are optional.
The syntax for varlist, exp,andrange is described in the next three
subsections, followed by information on how to loop through sets of
variables or observations.
1.5.1 Varlist
The simplest form of varlist is a list of variable names separated by
spaces. Variable names may also be abbreviated as long as this is
unambiguous, e.g., x1 may be referred to by x only if there is no other
variable name starting with x such as x itself or x2.Asetofadjacent
variables such as m1, m2,andx may be referred to as m1-x. All variables
starting with the same set of letters can be represented by that set of
letters followed by a wild card *,sothatm* may stand for m1 m6
mother. The set of all variables is referred to by
all or *.Examples
of a varlist are
xy
x1-x16
a1-a3 my* sex age
1.5.2 Expressions
There are logical, algebraic, and string expressions in Stata. Logical
expressions evaluate to 1 (true) or 0 (false) and use the operators < and
<= for ‘less than’ and ‘less than or equal to’, respectively. Similarly, >
and >= are used for ‘greater than’ and ‘greater than or equal to’. The
symbols == and
~= stand for ‘equal to’ and ‘not equal to’, and the
characters !,&and| represent ‘not’, ‘and’, and ‘or’, respectively, so
that
if (y!=2 & z>x)|x==1
means ‘if y is not equal to 2 and z is greater than x or if x equals 1’. In
fact, expressions involving variables are evaluated for each observation
© 2004 by CRC Press LLC
so that the expression really means
(y
i
=2&z
i
>x
i
) | x
i
== 1
where i is the observation index.
Great care must be taken in using the > or >= operators when there
are missing data. For example, if we wish to delete all subjects older
than 16, the command
drop if age>16
will also delete all subjects for whom age is missing since a missing
value (represented by ‘.’, ‘.a’, ‘.b’, etc.) is interpreted as a very large
number. It is always safer to accommodate missing values explicitly
using for instance
drop if age>16 & age<.
Note that this is safer than specifying age!=. since this would not
exclude missing values coded as ‘.a’, ‘.b’, etc.
Algebraic expressions use the usual operators +, -, *, /,and^ for
addition, subtraction, multiplication, division, and powering, respec-
tively. Stata also has many mathematical functions such as sqrt(),
exp(), log(), etc. and statistical functions such as chiprob() and
normprob() for cumulative distribution functions and invnorm(),etc.,
for inverse cumulative distribution functions. Pseudo-random numbers
with a uniform distribution on the [0,1) interval may be generated using
uniform(). Examples of algebraic expressions are
y+x
(y + x)^ 3 + a/b
invnorm(uniform())+2
where invnorm(uniform()) returns a (different) draw from the stan-
dard normal distribution for each observation.
Finally, string expressions mainly use special string functions such
as substr(str,n1,n2) to extract a substring from str starting at n1
for a length of n2. The logical operators == and
~= are also allowed
with string variables and the operator + concatenates two strings. For
example, the combined logical and string expression
"moon"+substr("sunlight",4,5))=="moonlight"
© 2004 by CRC Press LLC