THE ECONOMICS OF MONEY,BANKING, AND FINANCIAL MARKETS 660
Bạn đang xem bản rút gọn của tài liệu. Xem và tải ngay bản đầy đủ của tài liệu tại đây (45.36 KB, 1 trang )
628
PA R T V I I Monetary Theory
Aggregate
Price Level, P
AS
A
D
P
P
E
C
B
P
AD
Y
Aggregate Output, Y
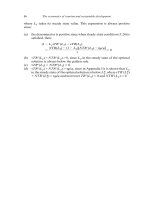
FIGURE 24-4
Equilibrium in the Short Run
Equilibrium occurs at point E at the intersection of the aggregate demand curve AD and the
short-run aggregate supply curve AS.
When the price level is below the equilibrium price level, say at P *, the quantity of output demanded is greater than the quantity of output supplied. Now the
price level will rise because people want to buy more goods than others want to
sell (a condition of excess demand ). This rise in the price level will continue until
it has again reached its equilibrium level of P * at point E.
Equilibrium in
the Long Run
Usually in supply and demand analysis, once we find the equilibrium at which the
quantity demanded equals the quantity supplied, there is no need for additional
discussion. In aggregate supply and demand analysis, however, that is not the
case. Even when the quantity of aggregate output demanded equals the quantity
supplied, forces operate that can cause the equilibrium to move over time. To
understand why, we must remember that if costs of production change, the aggregate supply curve will shift.
As we saw earlier, the short-run aggregate supply curve will not remain stationary when aggregate output and unemployment differs from its natural rate: when
Y Yn, labour markets are tight, production costs rise at any given price level, and
the short-run aggregate supply curve shifts to the left; while when Y Yn, labour
markets are slack, production costs fall at any given price level, and the aggregate
supply curve shifts to the right. Only when aggregate output and unemployment
are at their natural rates is there no pressure from the labour market for wages to
rise or fall; under these conditions, there is no reason for the short-run aggregate
supply to shift.
We look at how the short-run equilibrium changes over time in response to
two situations: when equilibrium is initially below the natural rate level and when
it is initially above the natural rate level.
In panel (a) of Figure 24-5, the initial equilibrium occurs at point 1, the intersection of the aggregate demand curve AD and the initial short-run aggregate supply curve AS1. Because the level of equilibrium output Y1 is greater than the natural
rate level Yn, unemployment is less than the natural rate, and excessive tightness
exists in the labour market. This tightness drives wages up, raises production costs,
and shifts the aggregate supply curve to AS2. The equilibrium is now at point 2,
and output falls to Y2. Because aggregate output Y2 is still above the natural rate