Economic growth and economic development 160
Bạn đang xem bản rút gọn của tài liệu. Xem và tải ngay bản đầy đủ của tài liệu tại đây (48.96 KB, 1 trang )
1.5
Introduction to Modern Economic Growth
ITA
Calibrated productivity differences 1988
0
.5
1
ESP
PRT
BELFRA
SGP
CAN
HKG
IRL
COL
URY
PAK
AUT
NLD
CHE
FIN SWE
DNK
GRC
NOR
JPN
NZL
ISR
PAN
IDN
BGD
THA
LKA
0
.2
.4
.6
Estimated labor-productivity differences
.8
1
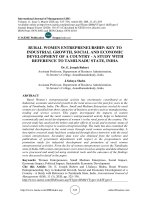
Figure 3.6. Comparison of the labor productivity estimates from
the Trefler approach with the calibrated productivity differences from
the Hall-Jones approach.
example, labor in Pakistan is 1/25th as productive as labor in the United States.
In contrast, capital productivity differences are much more limited than labor productivity differences; capital in Pakistan is only half as productive as capital in the
United States. This finding is not only intriguing in itself, but we will see that it is
quite consistent with a class of models of technical change we will study in Chapter
15.
It is also informative to compare the productivity difference estimates here to
those from the previous section. Figures 3.6 and 3.7 undertake this comparison.
The first plots the labor-productivity difference estimates from the Trefler approach
against the calibrated overall productivity differences from the Cobb-Douglas specification in the previous section. The similarity between the two series is remarkable.
This gives us a little confidence that both approaches are capturing some features
146