The South African Index of Multiple Deprivation for Children potx
Bạn đang xem bản rút gọn của tài liệu. Xem và tải ngay bản đầy đủ của tài liệu tại đây (2.14 MB, 72 trang )
Free download from www.hsrcpress.ac.za
Helen Barnes, Gemma Wright,
Michael Noble & Andrew Dawes
The South African
Index of Multiple
Deprivation for
Children
Census 2001
Centre for the Analysis of
South African Social Policy,
Oxford University
Free download from www.hsrcpress.ac.za
Research project funded by Save the Children, Sweden, Southern Africa Region
Published by HSRC Press
Private Bag X9182, Cape Town, 8000, South Africa
www.hsrcpress.ac.za
First published 2007
ISBN 978-0-7969-2216-8
© 2007 Human Sciences Research Council
The University of Oxford and the Human Sciences Research Council have taken care
to ensure that the information in this report and the accompanying data are correct.
However, no warranty, express or implied, is given as to its accuracy and the University
of Oxford and the Human Sciences Research Council do not accept any liability for error
or omission. The University of Oxford and the Human Sciences Research Council are
not responsible for how the information is used, how it is interpreted or what reliance
is placed on it. The University of Oxford and the Human Sciences Research Council do
not guarantee that the information in this report or in the accompanying file is fit for any
particular purpose. The University of Oxford and the Human Sciences Research Council
do not accept responsibility for any alteration or manipulation of the report or the data
once it has been released.
Print management by comPress
Distributed in Africa by Blue Weaver
Tel: +27 (0) 21 701 4477; Fax: +27 (0) 21 701 7302
www.oneworldbooks.com
Distributed in Europe and the United Kingdom by Eurospan Distribution Services (EDS)
Tel: +44 (0) 20 7240 0856; Fax: +44 (0) 20 7379 0609
www.eurospanbookstore.com
Distributed in North America by Independent Publishers Group (IPG)
Call toll-free: (800) 888 4741; Fax: +1 (312) 337 5985
www.ipgbook.com
Suggested citation
Barnes, H., Wright, G., Noble, M. and Dawes, A. (2007) The South African Index
of Multiple Deprivation for Children: Census 2001. Cape Town: HSRC Press.
Free download from www.hsrcpress.ac.za
CONTENTS
Acknowledgements iv
Contributors v
Acronyms vi
1 Background 1
1.1 Introduction 1
1.2 Conceptual framework for the SAIMDC 3
1.3 Review of previous research measuring child poverty in South Africa 4
2 Components of the SAIMDC 10
2.1 About the domains 10
2.2 About the indicators 10
3 Methodology 13
3.1 Creating domain indices 13
3.2 Combining domain indices into an index of multiple deprivation 13
4 The geography of deprivation 16
4.1 How to interpret the municipal-level results 16
4.2 Municipal-level results 16
5 Towards a SAIMDC at sub-municipal level 42
5.1 A new statistical geography 42
5.2 Harnessing administrative and survey data to create indices
of multiple deprivation 43
Appendix 1 44
Indicators used in the SAIMDC 44
The Income and Material Deprivation Domain 44
The Employment Deprivation Domain 45
The Education Deprivation Domain 45
The Living Environment Deprivation Domain 47
The Adequate Care Deprivation Domain 49
Other domains considered 50
Appendix 2 52
Exponential transformation 52
Appendix 3 54
Municipal identification maps 54
References 63
Free download from www.hsrcpress.ac.za
iv
The authors would like to thank Save the Children, Sweden for funding this project and
the following people for reviewing and commenting on earlier drafts of the text: Lucie
Cluver, Christopher Dibben, Sharmla Rama, Benjamin Roberts, Judith Streak and Cathy
Ward.
ACKNOWLEDGEMENTS
Free download from www.hsrcpress.ac.za
v
CONTRIBUTORS
Helen Barnes
Research Officer
Centre for the Analysis of South African Social Policy
Department of Social Policy and Social Work
University of Oxford
Andrew Dawes
Research Director
Child, Youth, Family and Social Development Research Programme
Human Sciences Research Council
and
Associate Professor Emeritus
University of Cape Town
Michael Noble
Professor of Social Policy,
Director
Centre for Analysis of South African Social Policy
and
Social Disadvantage Research Centre
Department of Social Policy and Social Work
University of Oxford.
Gemma Wright
Senior Research Fellow
and
Deputy Director
Centre for the Analysis of South African Social Policy
and
Social Disadvantage Research Centre
Department of Social Policy and Social Work
University of Oxford
Free download from www.hsrcpress.ac.za
vi
CASASP Centre for the Analysis of South African Social Policy
CRC Convention on the Rights of the Child
DMA District Management Area
GIS Geographic Information System
HSRC Human Sciences Research Council
IES Income and Expenditure Survey
NPA National Programme of Action for Children
NYVS National Youth Victimisation Survey
OECD Organisation for Economic Co-operation and Development
OHS October Household Survey
PIMD Provincial Indices of Multiple Deprivation
RDP Reconstruction and Development Programme
PSLSD Project for Statistics on Living Standards and Development
SAIMDC South African Index of Multiple Deprivation for Children
SDRC Social Disadvantage Research Centre
Stats SA Statistics South Africa
YPLL Years of Potential Life Lost
ACRONYMS
Free download from www.hsrcpress.ac.za
1
CHAPTER 1
Background
1.1 Introduction
Child poverty and child rights
A large number of studies have been carried out which demonstrate the detrimental
impact of poverty on child development, educational outcomes, job prospects, health
and behaviour (Lister, 2004).
Apart from compromising one’s childhood – a time to be filled with play,
exploration, and discovery of one’s self and others – poverty at this early
stage in life has enduring consequences for those who survive into adulthood.
It condemns them to recurrent poverty spells or even a life full of hardship,
increasing the chances of passing their poverty onto the next generation
(Grinspun, 2004: 2).
Governments worldwide have committed themselves to eradicating child poverty and
consequently the inter-generational transmission of poverty. The Millenium Development
Goals agenda promotes policies that improve the lives of poor children worldwide
(Grinspun, 2004). South Africa is no exception, and since 1994 the government has been
active in committing itself to protecting child rights and reducing child poverty (Cassiem
et al., 2000). The National Programme of Action for Children (NPA) is the driving force
behind the government’s child poverty alleviation strategy (Cassiem et al., 2000),
prioritising the protection of the rights of all children in South Africa.
The South African Constitution provides that every child – that is a person under the age
of 18 years – in South Africa has the right, amongst others, to family care or parental care,
or to appropriate alternative care when removed from the family environment; to basic
nutrition, shelter, basic health care services and social services; and to be protected from
maltreatment, neglect, abuse, or degradation (Republic of South Africa, 1996: Article 28).
These are in addition to the rights to which all South Africans are entitled. South Africa
also ratified the Convention on the Rights of the Child (CRC) in 1995 (United Nations,
1990), and the African Charter on the Rights and Welfare of the Child in 2000
(Organisation of African Unity, 1999). It is also a signatory to Convention 138 and
182 of the International Labour Organisation regarding child labour. New legislation,
the Children’s Act (No. 38 of 2005), and the associated Children’s Amendment Bill
(No. 19 of 2006), although not yet in force, further supplements these rights.
Although these rights are guaranteed by the Constitution and other legislation, in practice,
the fact that the majority of South African children live in poverty, and that rates of
mortality and maltreatment remain high (Dawes et al., 2007), suggests that these rights
are not always realised (Monson et al., 2006). In order to realise the rights of all children
and tackle child poverty, it is critical that robust measures are developed to quantify the
nature and extent of social deprivation experienced by children at sub-national level and
thereby accurately identify the areas of greatest need (i.e. the most deprived areas). It is
also essential that these measures focus specifically on children. The current study is a
first attempt to generate data of this nature to map child deprivation, in order to inform
local level policy and intervention.
Free download from www.hsrcpress.ac.za
The South African Index of Multiple Deprivation for Children
2
Provincial Indices of Multiple Deprivation
In 2006, a team of researchers from the Centre for the Analysis of South African Social
Policy (CASASP) at the University of Oxford, the Human Sciences Research Council
(HSRC) and Statistics South Africa (Stats SA) produced nine ward level Provincial Indices
of Multiple Deprivation (PIMD), using the 2001 Census (Noble, Babita et al., 2006a and
2006b). The PIMD were built on the model of multiple deprivation which was first
developed in the late 1990s with Oxford University’s UK work on Indices of Multiple
Deprivation (Noble, Smith, Penhale et al., 2000; Noble, Smith, Wright et al., 2000; Noble
et al., 2001; Noble et al., 2003; Noble et al., 2004; Noble et al., 2005). The 100% Census
data was used as it enables the index to be mapped at ward level.
The model of deprivation underpinning the PIMD assumes that deprivation is multi-
dimensional, and that multiple deprivation can be conceptualised as the combination
of individual dimensions or domains of deprivation. The PIMD made use of information
available from the 2001 Census about different aspects of deprivation: income, employ-
ment, education, health and living environment, and measured deprivation for the total
population (i.e. children and adults of all ages). These domains were then combined
to form an overall index of multiple deprivation.
South African Index of Multiple Deprivation for Children
Following the release of the PIMD, CASASP scholars and the HSRC began to consider
the importance of constructing a child-focused index which would specifically consider
deprivation experienced by children. The result is the South African Index of Multiple
Deprivation for Children (SAIMDC) 2001, which is presented in this report. A child-
centred index has the key quality of separating children out from household level data
or data presented for the total population. Children are normally lost as a unit of analysis
in the analysis of household surveys and the SAIMDC seeks to foreground deprivation
from a child perspective. Such child-centred data enables the child to emerge from the
background of adult centred survey data, and may enhance the sensitivity of interventions
to children’s rights and needs (e.g. Saporiti, 1999; Ennew, 1999). We elaborate on this
point in Section 1.3.
The SAIMDC is based on the same conceptual framework and model of deprivation as
the PIMD (discussed in Section 1.2) but focuses exclusively on children, and additionally
draws from the models and recommendations contained within Dawes et al. (2007).
It also takes into account the breadth of research on child poverty in South Africa
(summarised in Section 1.3), and parallel work by CASASP’s sister research centre
(SDRC – the Social Disadvantage Research Centre) on Income Deprivation Affecting
Children Indices in the UK (e.g. Noble et al., 2004), and an ongoing study called the
‘Child Well-being Index’ which is being undertaken by SDRC and the University of
York for the UK government.
Chapter 2 of this report introduces the indicators and domains which were included in
the SAIMDC, and Chapter 3 summarises the methodological approach. Chapter 4 presents
the key findings. The final chapter outlines directions for future research to further
develop small area level measurement of child deprivation in South Africa.
Free download from www.hsrcpress.ac.za
Background
3
1.2 Conceptual framework for the SAIMDC
1
Townsend defined people as poor if ‘they lack the resources to obtain the types of
diet, participate in the activities and have the living conditions and amenities which are
customary, or at least widely encouraged or approved in the societies to which they
belong’ (Townsend, 1979: 31). Conversely he defined people as deprived if ‘they lack
the types of diet, clothing, housing, household facilities and fuel and environmental,
educational, working and social conditions, activities and facilities which are customary’
(Townsend, 1987: 131 and 140). Deprivation therefore refers to peoples’ unmet needs,
whereas poverty refers to the lack of resources required to meet those needs. This
conceptualisation underpins our model of multiple deprivation. In addition Townsend
(1987) also laid down the foundation for articulating multiple deprivation as an
accumulation of single deprivations – a concept which also underpins this project.
In South Africa this multi-dimensionality was asserted in the Reconstruction and
Development Programme (RDP) of the first post-Apartheid government:
It is not merely the lack of income which determines poverty. An enormous
proportion of very basic needs are presently unmet. In attacking poverty and
deprivation, the RDP aims to set South Africa firmly on the road to eliminating
hunger, providing land and housing to all our people, providing access to safe
water and sanitation for all, ensuring the availability of affordable and sustainable
energy sources, eliminating illiteracy, raising the quality of education and training
for children and adults, protecting the environment, and improving our health
services and making them accessible to all (African National Congress, 1994).
More recently it has been argued that poverty should be seen:
… in a broader perspective than merely the extent of low income or low
expenditure in the country. It is seen here as the denial of opportunities and
choices most basic to human development to lead a long, healthy, creative life
and to enjoy a decent standard of living, freedom, dignity, self-esteem and
respect from others (Statistics South Africa, 2000: 54).
During the past three decades there have been significant developments in the way that
this multi-dimensional approach to poverty has been interpreted and measured
(Thorbecke, 2004).
Although Townsend’s work mainly (though not entirely) referred to individuals
experiencing deprivations – single or multiple – the arguments can, in modified
form, extend to area based measures
2
. At an area level it is possible to look at single
deprivations and state that a certain proportion of the population experiences that
deprivation (e.g. lack of sanitation), while another proportion experiences some other
form of deprivation (e.g. lack of formal housing). These single deprivations may then
be combined to describe the degree of multiple deprivation in that area. The area itself
can then be characterised as deprived relative to other areas, in a particular dimension
of deprivation, or using a combined multiple deprivation index.
1 This is the same theoretical framework that underpins the PIMD (Noble, Babita et al., 2006a) and this section is
drawn from that report.
2 An area based measure (e.g. of child deprivation) refers to a geographic space chosen to plot the extent of
deprivation in the (child) population living in that area. It could be a province, a municipality or other spatial unit.
Free download from www.hsrcpress.ac.za
The South African Index of Multiple Deprivation for Children
4
Why is it important to measure child deprivation at a small area level? First, geographical
patterns of social disadvantage (or advantage) are not random: the spatial distribution
reflects the results of dynamic social processes, economic change, migration, availability
and costs of living space, community preferences, and policies that may distribute
particular groups to certain areas or exclude them from others. Second, the spatial
concentration of multi-dimensional deprivation means that – when correctly measured –
the most deprived areas can effectively be targeted (Smith, 1999; Kleinman, 1999; Smith
et al., 2001). Third, the concentration of poor children in an area may mean that local
services struggle to meet high demand, or that areas lack resources to support certain
services. Fourth, when a range of deprivation measures is collected on an area basis,
the exact mix of problems will vary from area to area.
Measuring different aspects of deprivation and combining these into an overall multiple
deprivation measure raises a number of questions (e.g. Noble, Wright et al., 2006). For
example, how should the different dimensions of deprivation be weighted? To what
extent should the same children or households be represented in more than one of
the dimensions of deprivation? These and other issues are addressed in this report.
To summarise, the model which emerges from this theoretical framework is of a series
of uni-dimensional domains of deprivation which may be combined, with appropriate
weighting, into a single child-focused measure of multiple deprivation.
1.3 Review of previous research measuring child poverty
in South Africa
This section focuses on research that specifically measures child poverty in South Africa.
Although there are no studies that measure child poverty at a sub-provincial level across
the whole of South Africa, a review of previous research measuring poverty at a small
area level for the population as a whole can be found in Noble, Babita et al. (2006a).
Income measures of child poverty
Child poverty is typically defined as a head count of children living in households
where the resources fall below the minimum subsistence level or an equivalent poverty
depth measure (Noble, Wright and Cluver, 2006). Many, although not all, of the studies
of poverty and child poverty in South Africa have been based on an absolute concept
and a subsistence definition. Others make use of a relative concept and definition, such
as a poverty line that looks at children in the poorest X % of all households (when
households are ranked according to their expenditure or income per individual).
Streak (2000) identifies two studies measuring child poverty at the national level:
Children, Poverty and Disparity Reduction by the National Institute of Economic Policy
(1996) and The Living Conditions of South Africa’s Children by Haarmann (1999). The
first study adopted a relative concept of poverty, defining the bottom 40% of households
(and thus children within the households) in terms of income as poor. Haarmann’s
study used an absolute concept of poverty, defining a child as poor if s/he received
less than R319 per month, which was derived from research by Potgieter (1997) on the
subsistence level of income required for a person living in Cape Town. Both studies
made use of the Project for Statistics on Living Standards and Development (PSLSD)
survey data collected in 1993.
Free download from www.hsrcpress.ac.za
Background
5
May (1998) used the 1995 October Household Survey (OHS) and Income and Expenditure
Survey (IES) data to estimate a child poverty rate at national and provincial level. Using a
relative definition of child poverty, a child was counted as poor if s/he fell into the bottom
40% of households. Dieden and Gustafson (2003) assessed child poverty in South Africa,
again at national and provincial level, by estimating multivariate models, also using OHS
and IES data from 1995. The applied poverty line defined children as poor if they live in
households with a disposable per capita income less than US$1 Purchasing Power Parity
(estimated to be R122.56 in 1995 Rands). Woolard (2001, discussed in Streak, 2001) used
a relative concept to measure the extent of child poverty at national and provincial level.
This analysis made use of the OHS 1999. A child was counted as poor if s/he resided in a
household in the bottom 40% of households. Woolard also counted the number of children
living in households that reported that they often experienced hunger, in order to examine
the extent of severe child poverty in South Africa. Finally, Woolard (2003, discussed in
Streak, 2004) also used the IES 2000 to estimate child poverty at national and provincial
level. For this, two absolute income poverty lines were constructed: R215 per month per
capita and R430 per month per capita (both in 2000 Rands).
Multidimensional measures of child poverty
The need for a broader conceptualisation of child poverty is increasingly recognised in
the literature on child poverty and well-being in South Africa (Dawes et al., 2007; Monson
et al., 2006; Noble, Wright and Cluver, 2006) as well as internationally. White et al. (2002)
conclude that a multidimensional approach is both necessary and achievable in the
developing world.
An example of the multidimensional approach can be seen in the UK Department for
Education and Skills’ outcomes framework in Every Child Matters: Change for Children.
They identified 25 specific aims for children and young people and the support needed
from parents, carers and families in order to achieve those aims. The broad headings
under which these aims fall are: be healthy, stay safe, enjoy and achieve, make a positive
contribution, and achieve economic well-being (Department for Education and Skills, 2004).
The aims include: physical health; mental and emotional health; safety from maltreatment,
neglect, violence and sexual exploitation; safety from accidental injury and death; attend
and enjoy school; achieve personal and social development and enjoy recreation; engage
in decision making and support the community and environment; live in decent homes
and sustainable communities; and live in households free from low income.
Gordon et al. (2003) measured the extent and severity of child poverty in the developing
world. They looked at a range of severe deprivations, including food (children whose
heights and weights for age were more than -3 standard deviations below the median
of the international reference population), safe drinking water (children who only had
access to surface water or water more than 15 minutes away), sanitation facilities
(children with no private or communal toilets or latrines), health (children who had not
been immunised, young children who had recent illness involving diarrhoea but did not
receive medical advice), shelter (children in dwellings with more than five people per
room or with no flooring material), education (children aged between 7 and 18 who had
never been to school), access to information (children aged between 3 and 18 with no
access to radio, television, telephone or newspapers at home) and access to basic services
(children living 20 km or more from any school and 50 km or more from any medical
facility). They defined a child as living in absolute poverty if s/he suffers from two or
more of the severe deprivations.
Free download from www.hsrcpress.ac.za
The South African Index of Multiple Deprivation for Children
6
In South Africa, Haarmann (1999, discussed in Streak, 2000) used the PSLSD to produce a
composite index that ranks children into five deprivation groupings. The index contained
nine indicators, grouped into four categories: expenditure (standardised monthly house-
hold expenditure), housing (type of house, number of durables, type of energy used for
cooking), health (type of water access, type of sanitation facilities, accessed health
facilities), and employment opportunities (share of employment amongst adult household
members, average years of education among household members over 16 years). Each of
the indicators ranged from 1 to 5 on a deprivation scale (1 being the poorest and 5 being
the richest). The final score for each household was computed as the average of each
mean of the four groups. Expenditure below the household subsistence level (i.e. below
R319 per month per child) was given a weighting three times greater than any of the other
indicators to reflect the importance of a person’s economic characteristics in determining
poverty. If a household’s overall score on the index was less than 3, it was classified as
poor, and all children (aged 0-6) were seen to be poor if they lived in these households.
This contains many of the elements of the model of multiple deprivation used in the
SAIMDC: domains of deprivation combined, with appropriate weighting, into a single
measure of multiple deprivation. However, unlike the SAIMDC, it only provides a measure
of child poverty at national and provincial level.
Cassiem et al. (2000) identified four pillars or groups of children’s rights on which the
CRC and NPA are built. These are:
Survival rights: a child’s right to an adequate living standard, including shelter and
nutrition, and access to medical services;
Development rights: a child’s right to education, play and leisure, cultural activities,
access to information, and freedom of thought, conscience and religion;
Protection rights: a child’s right to be protected from all forms of exploitation and
cruelty, arbitrary separation from family and abuse in the criminal justice system; and
Participation rights: a child’s right to the freedom to express opinions and to have a
say in matters affecting his or her life (Cassiem et al., 2000: ix).
They provide examples of the four categories of deprivation and propose indicators that
can be used to monitor each aspect of child poverty. Streak (2000) used some of these
indicators to measure child poverty outcomes at provincial level. Indicators include:
income (share of children living in bottom 40% of SA household income distribution
for different ages); health (share of child 0-5 years deaths, share of stunted children);
education (matric failure rate, share of matric failures, matric exemption rate); physical
insecurity (share of crimes against children); and economic insecurity (HIV infection rate
amongst pregnant women). However, the data are presented only for discrete indicators
rather than dimensions of deprivation or composite indices. Furthermore the indicators
are not presented at sub-provincial level.
Bray (2002) examined available data on children’s lives in South Africa to see whether
it is possible to trace changes in child poverty and well-being over time, and to link these
changes to broader social, political and economic trends. She looked at child poverty and
economic well-being, child health, education and development, and civil rights and social
inclusion. Her review of the available data and identification of major gaps highlight the
broad range of indicators that are useful in measuring child poverty and well being.
The Children’s Institute at the University of Cape Town is currently engaged in a project
monitoring the situation of children in South Africa: their living conditions, their care
arrangements, their health status, and their access to schools and other services (Jacobs
•
•
•
•
Free download from www.hsrcpress.ac.za
Background
7
et al., 2005; Monson et al., 2006). The project, Children Count – Abantwana Babalulekile
(isiXhosa for ‘children are important’), presents data from Stats SA as well as admini stra-
tive data from relevant government departments on a number of important areas relating
to children’s socio-economic rights, in order to monitor the realisation of their rights.
Examples of indicators include children who are underweight, children experiencing
hunger, take up of child grants, children living in formal housing, children living in
houses with an electricity connection, infant mortality rate, HIV prevalence among
children, children with access to drinking water on site, children attending an education
institution, and learner to teacher ratio. Although comprehensive, again these are discrete
indicators and are not combined into domains or an index. The indicators are also only
measured at national and provincial level which constrains their appropriateness for
planning interventions at local level.
Dawes et al. (2007) provide an evidence and rights-based approach to monitoring the
well-being of children and adolescents in South Africa. The book sets out the conceptual
basis for the development of a rights-based approach to monitoring child well-being over
a range of domains including child poverty and the quality of children’s neighbourhoods
and home environments; child health, HIV and AIDS, mental health and disability; early
child development and education; and child protection, children in statutory care,
children in the justice system, children on the streets and children affected by the worst
forms of labour. Indicators (rights based and aligned to current policy) for these domains
are provided, with recommended measurement and data sources.
Need for child specific measures of child poverty
As mentioned in the introduction and in relation to income measures of child poverty,
child specific measures of deprivation and poverty are essential. This has been widely
recognised in the literature, both South African and international. For example,
Micklewright (2002) identifies child-specific dimensions of exclusion, such as child
development and education, and criticises the lack of specific indicators intended to
capture exclusion among children. White et al. (2002) argue that research and policy in
developing countries need to embrace a broader agenda and conception of child welfare
which (amongst others) accepts that child welfare indicators need to be different from
standard poverty indicators used for adults. Feeny and Boyden (2004) further assert that
adult perspectives that often bear little resemblance to the actual experience of the child
are frequently prioritised.
Recent studies on child poverty in South Africa highlight the need for wider, child-
focused, and child-participatory definitions of poverty (Guthrie et al., 2003; Coetzee
and Streak, 2004; Streak, 2005). For example:
The South African Constitution accords children special socio-economic rights in
recognition of their particular vulnerability and need for special protection. Steps
to effect these rights have been targeted at the child and family. However, the
impact of such interventions are difficult to measure and track due to the
shortage of child well-being and poverty data. This problem is exacerbated by
the limitations encountered in using national survey data as most surveys use
the household as a unit of analysis. Consequently there is very little data on
household members disaggregated by age and gender (Guthrie et al., 2003: 3).
Free download from www.hsrcpress.ac.za
The South African Index of Multiple Deprivation for Children
8
A child-focused multidimensional child poverty model
The approach to monitoring the well-being of children in South Africa discussed in
Dawes et al. (2007) includes work by Noble, Wright and Cluver (2006), who present a
new method of measuring child poverty in South Africa, based on a theoretical distinction
between the conceptualisation, definition, measurement and enumeration of poverty.
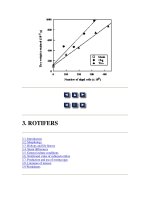
They present a child-centred, multidimensional model of child poverty which informs
the approach taken in this report (see Figure 1.1).
Figure 1.1: A child-focused and multidimensional model of child poverty for South Africa
At the ‘core’ of the model is an absolute, multidimensional conceptualisation of child
poverty that takes into account the fact that there are large numbers of children who
do not have their basic needs of food, housing, education, safety and health provision
met, and who are living below subsistence levels. The model also has a relative
multidimensional component which is based on the ability to participate fully as a child
in South African society, and goes beyond issues relating to survival. The indicators in
the core are ‘a narrower, inevitably more basic, set that will not be determined by
reference to an inclusion agenda’ (Noble, Wright and Cluver, 2006: 45).
Health
Deprivation
Material
Deprivation
Adequate Care
Deprivation
Living
Environment
Deprivation
Physical Safety
Deprivation
Human Capital
Deprivation
Abuse Social Capital
Deprivation
A
c
c
e
s
s
t
o
G
o
o
d
Q
u
a
l
i
t
y
S
e
r
v
i
c
e
s
A
c
c
e
s
s
t
o
G
o
o
d
Q
u
a
l
i
t
y
S
e
r
v
i
c
e
s
Absolute
Core
Source: Noble, Wright and Cluver, 2006
Free download from www.hsrcpress.ac.za
Background
9
The same domains run through both the absolute core and the relative component, and
access to good quality services is relevant to all domains in both the absolute and relative
spheres. The exemplar domains cover many of the socio-economic rights for children
enshrined in the Constitution and other legislation:
Material deprivation – indicators relating to material possessions and financial
resources;
Human capital deprivation – indicators relating to education (as a determinant of
a child’s prospects);
Social capital deprivation – indicators relating to support networks that prevent
social exclusion;
Living environment deprivation – indicators relating to adequate shelter and features
of the neighbourhood such as air pollution, noise pollution and prevalence of crime;
Adequate care deprivation – indicators relating to loss of caregivers, supervision,
neglect and exploitation;
Abuse – indicators relating to physical, emotional or sexual abuse, and intentional
neglect, at home, school or in the neighbourhood;
Physical safety deprivation – indicators relating to crimes against children, accidental
injury and death; and
Health deprivation – indicators relating to physical and mental health.
•
•
•
•
•
•
•
•
Free download from www.hsrcpress.ac.za
10
CHAPTER 2
Components of the SAIMDC
2.1 About the domains
As seen in Chapter 1, the conceptual model is based on the idea of distinct domains of
deprivation which can be recognised and measured separately. These are experienced by
children living in an area (e.g. a municipality). Children may be counted as deprived in
one or more of the domains, depending on the number of types of deprivation that they
experience. The overall index of multiple deprivation is conceptualised as a weighted
area level aggregation of these specific domains of deprivation.
For this report, five domains of deprivation were produced using the Census to form
an index of multiple deprivation:
Income and Material Deprivation;
Employment Deprivation;
Education Deprivation;
Adequate Care Deprivation; and
Living Environment Deprivation.
The indicators in the Income and Material Deprivation and Living Environment
Deprivation domains are the same as those used in the PIMD, except that they only
take into account children aged 0–17 years. The indicators used in the Employment
Deprivation and Education Deprivation domains are different from those used for the
PIMD (see Appendix 1 for details), while Adequate Care Deprivation is a new domain
with specific relevance for children.
Each domain is presented as a separate domain index reflecting a particular aspect of
deprivation. Thus the Education Deprivation Domain represents educational disadvantage
and does not include non education indicators which may contribute to education
deprivation such as the lack of electric lighting to undertake homework. Such an indicator
would be captured in the Living Environment Deprivation Domain. This approach avoids
the need to make any judgments about the complex links between different types of
deprivation, and enables clear decisions to be made about the contribution that each
domain should make to the overall index.
While the domains represent distinct dimensions of deprivation, it is perfectly possible,
indeed likely, that the same child could be captured in more than one domain. So, for
example, if a child was in a low income household, not in school and in a household
with no piped water, they would be captured in the Income and Material Deprivation,
Education Deprivation and Living Environment Deprivation domains. This is entirely
appropriate because one individual can experience more than one type of deprivation
at any given time.
2.2 About the indicators
The aim for each domain was to include a parsimonious (i.e. economical in number)
collection of indicators that comprehensively captured the deprivation for each domain.
Three further criteria were kept in mind when selecting indicators:
•
•
•
•
•
Free download from www.hsrcpress.ac.za
11
Components of the SAIMDC
They should be ‘domain specific’ and appropriate for the purpose (as direct
as possible measures of that form of deprivation);
They should measure major features of that deprivation (not conditions just
experienced by a very small number of children or areas); and
They should be statistically robust.
The public availability of the 10% sample of the 2001 Census enabled the research team
to test different indicators and combinations of indicators to be used in the SAIMDC
3
.
A total of 14 indicators were used in the SAIMDC and full details about these indicators
are given in Appendix 1.
All the indicators were derived from the 10% sample of the 2001 Census of Population and
therefore relate to 10 October 2001 (Census night). Unless stated otherwise, the indicators
listed below take into account children aged 0–17 years inclusive.
There was general consensus that the SAIMDC should be constructed at the smallest
practicable spatial scale and that the ideal geography should possess relatively even sized
populations. It was not possible to obtain the necessary permissions to produce the
SAIMDC at sub-provincial level, and so the SAIMDC was produced at municipal level
which is the smallest geographical unit at which the 10% sample of the 2001 Census is
robust. Recommendations for further work including sub-provincial level analysis are
discussed in Chapter 5.
The SAIMDC is designed to be updated in three ways: first, to allow for the re-evaluation
of the number and nature of the dimensions of deprivation; second, to allow for new and
more direct measures of those dimensions to be incorporated; and third, to measure
changing deprivation ‘on the ground’ as required. Domains and indicators which were
considered but which could not be included are also described in Appendix 1.
The Income and Material Deprivation Domain
The purpose of this domain is to capture the proportion of children experiencing income
and/or material deprivation in an area:
Number of children living in a household that has a household income (need-
adjusted using the modified Organisation for Economic Co-operation and
Development – OECD – equivalence scale) that is below 40% of the mean
equivalent household income (approximately R850 per month in 2001 Rands); or
Number of children living in a household without a refrigerator; or
Number of children living in a household with neither a television nor a radio.
A simple proportion of children living in households experiencing one or more of the
deprivations was calculated (i.e. the number of children living in a household with low
income and/or without a refrigerator and/or without a television and radio divided by
the total child population).
3 Imputation was carried out on the full Census by Stats SA to allocate values for unavailable, unknown, incorrect
or inconsistent responses. A combination of ‘logical’ imputation and ‘hot deck’ imputation was used when
inconsistencies were found in the data. Further details on the imputation techniques used, and also the Census
in general, are available from Stats SA.
•
•
•
•
•
•
Free download from www.hsrcpress.ac.za
The South African Index of Multiple Deprivation for Children
12
The Employment Deprivation Domain
The purpose of this domain is to measure the proportion of children living in workless
households in an area:
Number of children living in households where no adults aged 18 or over are in
employment.
A simple proportion of children living in households experiencing this type of deprivation
was calculated (i.e. the number of children living in a household with no employed
adults divided by the total child population).
The Education Deprivation Domain
The purpose of this domain is to capture the extent of children’s educational deprivation
in an area:
Number of children (9–15 years inclusive) who are in the wrong grade for their age; or
Number of children (7–15 years inclusive) who are not in school.
This domain was not created as a simple rate but the details are provided in Appendix 1.
The Living Environment Deprivation Domain
The purpose of this domain is to identify children living in poor quality environments:
Number of children living in a household without piped water inside their dwelling
or yard or within 200 metres; or
Number of children living in a household without a pit latrine with ventilation or
flush toilet; or
Number of children living in a household without use of electricity for lighting; or
Number of children living in a household without access to a telephone; or
Number of children living in a household that is a shack; or
Number of children living in a household that is crowded.
A simple proportion of children living in households experiencing one or more of the
deprivations was calculated (i.e. the number of children living in a household without
piped water and/or without adequate toilet and/or without electricity for lighting and/or
without access to a telephone and/or that is a shack and/or that is crowded divided by
the total child population).
The Adequate Care Deprivation Domain
The purpose of this domain is to capture children in an area who are at risk of lacking
adequate care:
Number of children whose mother and father are no longer alive or not living in the
household; or
Number of children living in a child-headed household.
A simple proportion of children experiencing either of the deprivations was calculated
(i.e. the number of children whose mother and father are not present in the household or
the number of children living in a child-headed household divided by the total population).
•
•
•
•
•
•
•
•
•
•
•
Free download from www.hsrcpress.ac.za
13
CHAPTER 3
Methodology
3.1 Creating domain indices
Combining indicators into domain indices
For each domain of deprivation (Income, Employment, etc.) the aim is to obtain a single
summary measure whose interpretation is straightforward in that it is, if possible, expressed
in meaningful units (e.g. proportions of children or of households experiencing that form
of deprivation). Apart from the Education Deprivation Domain, all of the other domains
were created as simple rates. This avoided the key issue of weighting indicators, which is
necessary when combining indicators into a single measure. Because the domain scores are
rates they are easy to interpret (i.e. X% of children in the municipality are experiencing this
type of deprivation). There were different denominators for the two Education Deprivation
Domain indicators. These indicators were created as separate rates (i.e. proportion of 9–15
year olds in the wrong grade and proportion of 7–15 year olds not in school), weighted
according to a ratio of indicator denominator to total denominator for the two indicators,
and added together.
There is no double counting of individuals within a domain. An individual may be
captured in more than one domain but this is not double counting: it is simply identifying
that they are deprived in more than one way.
After combining the indicators into domains, District Management Areas
4
(DMAs) were
omitted, as well as one municipality which had a child population of less than 1000.
3.2 Combining domain indices into an index of
multiple deprivation
Standardisation and transformation
Domains are conceived as independent domains of deprivation, each with their own
contribution to multiple deprivation. The strength of this contribution should vary
between domains depending on their relative importance. Once the domains had been
constructed, it was necessary to combine them into an overall index. In order to do this
the domain indices were standardised by ranking. They were then transformed to an
exponential distribution.
The exponential distribution was selected for the following reasons. First, it transforms
each domain so that they each have a common distribution, the same range and identical
maximum/minimum value, so that when the domains are combined into a single index
of multiple deprivation, the (equal) weighting is explicit; that is there is no implicit
weighting as a result of the underlying distributions of the data. Second, it is not affected
by the size of the municipality’s population. Third, it effectively spreads out the part
of the distribution in which there is most interest; that is the most deprived municipalities
in each domain.
The exponential transformation procedure is set out in more detail in Appendix 2.
4 Areas such as game reserves and mining complexes with small populations with special characteristics. They
produce anomalous results and are customarily excluded by Stats SA from small area analyses.
Free download from www.hsrcpress.ac.za
The South African Index of Multiple Deprivation for Children
14
Weighting
An important issue in constructing an overall index of multiple deprivation is the question
of what ‘explicit weight’ should be attached to the various components. The weight is
the measure of importance that is attached to each component in the overall composite
measure. How can one attach weights to the various aspects of deprivation? That is, how
can one determine which aspects are more important than others?
There are at least five possible approaches to weighting:
Driven by theoretical considerations – use the available research evidence to inform
the theoretical model of multiple deprivation and select weights which reflect this
theory.
Empirically driven – either use a commissioned survey or re-analysis of an existing
survey to generate weights, or apply a technique such as factor analysis to extract
some latent ‘factor’ called ‘multiple deprivation’, assuming that is, that the analysis
permitted a single factor solution (see Senior, 2002).
Determined by policy relevance – release the individual domain scores and weight
for combination in accordance with and proportional to the focus of particular
policy initiatives or weight in accordance with public expenditure on particular areas
of policy.
Determined by consensus – consult policy makers and other ‘customers’ or experts
for their views and examine the results for consensus.
Entirely arbitrary – choose weights without reference to the above or even select
equal weights in the absence of empirical evidence.
Weighting always takes place when elements are combined together. Thus if the domains
are summed together to create an index of multiple deprivation, this means they are
given equal weight. It would be incorrect to assume that items can be combined without
weighting.
For the SAIMDC, equal weights were assigned to the exponentially transformed domains
in the absence of evidence suggesting differential weights should be used.
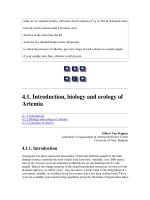
Figure 3.1 summarises the components of the SAIMDC in diagrammatic form.
1.
2.
3.
4.
5.
Free download from www.hsrcpress.ac.za
15
Methodology
Figure 3.1: Components of the South African Index of Multiple Deprivation for Children
Weight individual domain exponential scores with equal weights and combine to produce a South African Index of Multiple Deprivation for Children
Income And Material
Deprivation Domain
Employment Deprivation
Domain
Education Deprivation
Domain
Living Environment
Deprivation Domain
Adequate Care
Deprivation Domain
Children living in a household
that has a household income
below 40% of the mean
equivalent household income
(A)
Children in a household without
a fridge (B)
Children in a household with
neither a TV nor a radio (C)
Children living in a household
where no adults are in
employment (A)
Children (9–15 years) in the
wrong grade for their age (A)
Children (7–15 years) not in
school (B)
Children in a household without
piped water in their dwelling or
yard or within 200 metres (A)
Children in a household without
a pit latrine with ventilation or
flush toilet (B)
Children in a household without
use of electricity for lighting (C)
Children in a household without
access to a telephone (D)
Children living in shack (E)
Children in a household that is
crowded (F)
Children whose mother and
father are no longer alive or
not in the household (A)
Children in child-headed
households (B)
(Children experiencing A or B
or C) / municipal total child
population
=
Income and Material
Deprivation Domain Score
A / municipal total child
population
=
Employment Deprivation
Domain Score
A / Municipal child population
aged 9–15
+
B / municipal child population
aged 7–15
=
Education Deprivation
Domain Score
(Children experiencing
A or B or C or D or E or F)
/ municipal total child population
=
Living Environment
Deprivation Domain Score
(Children experiencing A or B)
/ municipal total child population
=
Adequate Care Deprivation
Domain Score
Standardise domain and
transform to exponential
distribution
Standardise domain and
transform to exponential
distribution
Standardise domain and
transform to exponential
distribution
Standardise domain and
transform to exponential
distribution
Standardise domain and
transform to exponential
distribution
Free download from www.hsrcpress.ac.za
16
The geography of deprivation
4.1 How to interpret the municipal-level results
Six measures for each municipality are provided. They include five domain measures
(which were combined to make the overall SAIMDC), and one overall SAIMDC.
The domain measures (each of which is given a score) can be used to describe each
type of deprivation in a municipality. The domain scores can then be used to rank each
municipality on that domain. A rank of 1 is assigned to the most deprived municipality.
The ranks show how a municipality compares to all the other municipalities and are
easily interpretable.
All five domains (Income and Material Deprivation, Employment Deprivation, Education
Deprivation, Living Environment Deprivation and Adequate Care Deprivation) are then
combined to provide an index of multiple deprivation for children in a municipality. This
is called the SAIMDC score and each municipality may then be ranked for comparative
purposes. A rank of 1 is assigned to the most deprived municipality. A limitation is that
for large municipalities with considerable heterogeneity, the SAIMDC is a coarse measure
that masks intra-municipality differences. It should be remembered that even the least
deprived municipalities may contain deprived children within them and the most
deprived municipalities may contain non deprived children. The only way for this matter
to be addressed is for the SAIMDC to be based on the 100% Census. This was not
possible for this project. However it is hoped that this will be achieved in the future with
the assistance of Stats SA, the only party that can use the 100% Census for such analyses.
In spite of these limitations, the SAIMDC provides many useful tools for examining the
geographical distribution of deprivation for children in South Africa.
In the rest of this chapter, the overall SAIMDC is presented, followed by the five domains
that comprise the SAIMDC.
On the maps at the end of Section 4.2, the municipalities have been divided into quintiles
of deprivation – five equal groups. On each map, the thin black lines depict the
municipality boundaries and the thick black lines are the province boundaries. The most
deprived 20% of municipalities are shaded in dark blue and the least deprived 20% of
municipalities are shaded in bright yellow (areas left white are DMAs that were
excluded). Maps identifying each municipality by name are provided in Appendix 3.
4.2 Municipal-level results
SAIMDC
The following table presents the most deprived ten municipalities on the SAIMDC, as well
as the child population size (in the 2001 Census) of each of these municipalities.
CHAPTER 4
Free download from www.hsrcpress.ac.za
17
The geography of deprivation
Table 4.1: Most deprived municipalities on the SAIMDC
Municipality Province
Child population
in 2001
(to nearest ‘000)
SAIMDC score
1 Engcobo Eastern Cape 77 000 450.99
2 Intsika Yethu Eastern Cape 99 000 449.85
3 Port St Johns Eastern Cape 82 000 441.35
4 Ntabankulu Eastern Cape 73 000 437.79
5 Mbhashe Eastern Cape 135 000 433.09
6 Msinga KwaZulu-Natal 91 000 424.09
7 Emalahleni Eastern Cape 56 000 421.99
8 Mbizana Eastern Cape 136 000 406.41
9 Nyandeni Eastern Cape 151 000 398.02
10 Qaukeni Eastern Cape 138 000 396.81
In the map section on pages 27 to 41, Map 1 shows the SAIMDC. The majority of
municipalities in both the Western Cape (24 of 25) and Gauteng (10 of 12) are in the top
quintile, that is the least deprived 20% (shaded yellow on the map) in terms of child
deprivation. Maps 2 and 8 show the SAIMDC for municipalities in the Western Cape and
Gauteng respectively.
There is a more mixed picture in the other provinces. In the Eastern Cape, municipalities
in the former Transkei fall into the bottom two quintiles, that is the most deprived 40%
(shaded blue on the map) in terms of child deprivation. The majority of municipalities
(22 of 39) are in the most deprived 20%. The former Ciskei area of the Eastern Cape has
municipalities in each of the quintiles. Nelson Mandela municipality (the Port Elizabeth
area) is in the least deprived 20%. Map 3 shows the SAIMDC for municipalities in the
Eastern Cape.
In the Northern Cape, there are no municipalities in the most deprived 20% in terms
of child deprivation, and only one, Umsombomvu, in the most deprived 20-40%. The
majority (19 of 26) are in the least deprived 40%, and half a dozen are in the middle
quintile. Map 4 shows the SAIMDC for municipalities in the Northern Cape.
In Free State, there are no municipalities in the most deprived 20% in terms of child
deprivation. Just over half (11 of 20) are in the middle quintile, and all but one split
equally between the quintiles either side. The remaining municipality, Metsimaholo, is
in the least deprived 20%. Map 5 shows the SAIMDC for municipalities in the Free State.
In KwaZulu-Natal, the majority of municipalities (35 of 51) are in the most deprived 40%
in terms of child deprivation. One municipality, Ethekwini, is in the least deprived 20%.
Map 6 shows the SAIMDC for municipalities in KwaZulu-Natal.
In North West, there are four municipalities in the most deprived 20% and two in the least
deprived 20% in terms of child deprivation. Ten of the 25 municipalities are in the middle
quintile and the remaining municipalities are split fairly evenly between the quintiles either
side. Map 7 shows the SAIMDC for municipalities in North West.
Free download from www.hsrcpress.ac.za
The South African Index of Multiple Deprivation for Children
18
In Mpumalanga, there are no municipalities in the most deprived 20% in terms of child
deprivation. The majority (18 of 21) are in the middle three quintiles. Three municipalities
are in the least deprived 20%. Map 9 shows the SAIMDC for Mpumalanga.
In Limpopo, the majority of municipalities (16 of 26) are in the most deprived 40% in
terms of child deprivation. There are no municipalities in the least deprived 20%. Map 10
shows the SAIMDC for Limpopo.
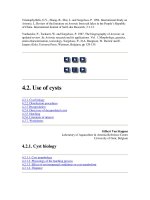
Figure 4.2 shows the patterns of deprivation for children in each province for the
SAIMDC. In the chart the range of deprivation is illustrated by the vertical blue line.
So in the example (see Figure 4.1) the most deprived municipality (from the child
perspective) is ranked 6 (where 1 is the rank of the most deprived) and the least
deprived municipality is ranked 243 (where 245 is the rank of the least deprived).
The shaded grey box indicates the range of the middle 50% of municipalities in the
province (the interquartile range
5
). If the grey box is relatively short this will indicate
that municipalities are concentrated in a narrow range. If this box sits towards the
bottom of the chart it tells us that child deprivation in the province is concentrated
in the most deprived part of the national distribution. If the box sits towards the top
of the chart it tells us that deprivation is concentrated in the least deprived part of the
national distribution.
The Eastern Cape and KwaZulu-Natal have the greatest range of child deprivation.
Gauteng and the Western Cape have the smallest range of child deprivation, and
municipalities in these two provinces are concentrated in a narrow range in the least
deprived part of the national distribution. Municipalities in the Eastern Cape and
KwaZulu-Natal are concentrated in the most deprived part of the distribution, but in a
fairly broad range. The municipalities in the remaining five provinces are concentrated
in the middle of the distribution. The Northern Cape lies towards the least deprived end
of the distribution.
5 The interquartile range (IQR) is ‘a measure of dispersion calculated by taking the difference between the first
and third quartiles (that is, the 25th and 75th percentiles). In short, the IQR is the middle half of a distribution’
(Vogt, 1999: 143).
Free download from www.hsrcpress.ac.za
19
The geography of deprivation
Figure 4.1: Example interquartile range
Figure 4.2: SAIMDC interquartile range
Most deprived 25% of municipalities
in the province when ranked in terms
of deprivation score (between 6 and
32 in this example)
0
50
100
150
200
Least deprived 25% of
municipalities in the province when
ranked in terms of deprivation score
(between 190 and 243 in this
example)
Middle 50% of municipalities in the
province when ranked in terms of
deprivation score (between 32 and 190 in
this example)
Municipality with the lowest rank in the
province, i.e. the most deprived
municipality (6 in this example)
Municipality with the highest rank in the
province, i.e. the least deprived
municipality (243 in this example)
250
0
50
100
150
200
Rank on SAIMDC 2001
(where 1 = most deprived)
250
Western
Cape
Eastern
Cape
Northern
Cape
Free
State
KwaZulu-
Natal
North
West
Gauteng Mpuma-
langa
Limpopo