Economic growth and economic development 23
Bạn đang xem bản rút gọn của tài liệu. Xem và tải ngay bản đầy đủ của tài liệu tại đây (48.13 KB, 1 trang )
80
90
Introduction to Modern Economic Growth
life expectancy 2000
50
60
70
CRI
GMB
BEN
KEN
TZA
40
BDI
MLI
BFA
TCD
NGA
GNB
MOZ
NER
UGA
MWI
ETH
LUX
CHL
URY
PAN
MEX
HRV
LKA
SVK
ALB
POL ARG
MKD VEN
BLZ
ECU
MYS
TUN
JAM
SYR
LCA
LTU
BGR
TTO MUS
HUN
COL
GEO
LBN
ARM
VCT
LVA EST
ROM
PRY
JOR
CHN
SLV
DZA
THA
BRA
PHLCPV
PER IRNTUR
BLR
NIC
MAR
EGY
HND
UKR
DOM
MDA AZE
RUS
KGZ GTM
IDN
TJK
KAZ
BOL
IND
COM PAK
NPLBGD
ZAF
GAB
GHA
YEM
TGO
MDG
JPN
HKG
CHE
ISL
SWE
MAC
AUS
CAN
FRA
ESP ITA
NOR
NLD
GRCISR
BEL
NZLGBR
AUT
FIN
USA
IRL
DNK
PRT
SVN
BRB
CZEKOR
SEN
COG
GIN
LSO CMR
CIV
GNQ
ZWE
SWZ
ZMB
RWA
6
7
8
9
log gdp per capita 2000
10
11
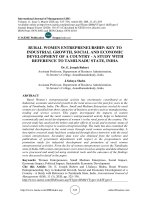
Figure 1.6. The association between income per capita and life expectancy at birth in 2000.
tables, while data on life expectancy at birth are available from the World Bank
Development Indicators.
These figures document that income per capita differences are strongly associated with differences in consumption (thus likely associated with differences in living
standards) and health as measured by life expectancy. Recall also that these numbers refer to PPP-adjusted quantities, thus differences in consumption do not (at
least in principle) reflect the fact that the same bundle of consumption goods costs
different amounts in different countries. The PPP adjustment corrects for these
differences and attempts to measure the variation in real consumption. Therefore,
the richest countries are not only producing more than thirty-fold as much as the
poorest countries, but they are also consuming thirty-fold as much. Similarly, crosscountry differences in health are nothing short of striking; while life expectancy at
9