THE ECONOMICS OF MONEY,BANKING, AND FINANCIAL MARKETS 128
Bạn đang xem bản rút gọn của tài liệu. Xem và tải ngay bản đầy đủ của tài liệu tại đây (41.86 KB, 1 trang )
96
PA R T I I
Financial Markets
Price of Bonds, P
B s1
B s2
P1
P2
1
2
B d1
B d2
Quantity of Bonds, B
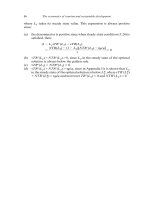
FIGURE 5-6
Response to a Business Cycle Expansion
In a business cycle expansion, when income and wealth are rising, the demand curve shifts
rightward from B d1 to B d2 , and the supply curve shifts rightward from B s1 to B s2. If the supply
curve shifts to the right more than the demand curve, as in this figure, the equilibrium bond
price moves down from P1 to P2, and the equilibrium interest rate rises.
us that the demand for bonds will rise as well. We see this in Figure 5-6, where the
demand curve has shifted to the right, from B d1 to B d2 .
Given that both the supply and demand curves have shifted to the right, we know
that the new equilibrium reached at the intersection of B d2 and B s2 must also move to
the right. However, depending on whether the supply curve shifts more than the
demand curve or vice versa, the new equilibrium interest rate can either rise or fall.
The supply and demand analysis used here gives us an ambiguous answer to
the question of what will happen to interest rates in a business cycle expansion.
The figure has been drawn so that the shift in the supply curve is greater than the
shift in the demand curve, causing the equilibrium bond price to fall to P2, leading
to a rise in the equilibrium interest rate. The reason the figure has been drawn so
that a business cycle expansion and a rise in income lead to a higher interest rate
is that this is the outcome we actually see in the data. Figure 5-7 plots the movement of the interest rate on three-month treasury bills from 1962 to 2008 and indicates when the business cycle is undergoing recessions (shaded areas). As you can
see, the interest rate tends to rise during business cycle expansions and fall during
recessions, which is what the supply and demand diagram indicates.