Economic growth and economic development 25
Bạn đang xem bản rút gọn của tài liệu. Xem và tải ngay bản đầy đủ của tài liệu tại đây (69.52 KB, 1 trang )
Introduction to Modern Economic Growth
20
1960
Density of coutries
10
15
1980
0
5
2000
-.1
-.05
0
average growth rates
.05
.1
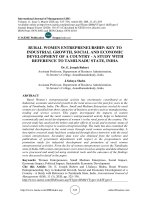
Figure 1.7. Estimates of the distribution of countries according to
the growth rate of GDP per worker (PPP-adjusted) in 1960, 1980 and
2000.
are not only interesting in and of themselves, but they also inform us about why
certain segments of the society may be in favor of policies and institutions that do
not encourage growth.
1.3. Economic Growth and Income Differences
How could one country be more than thirty times richer than another? The
answer lies in differences in growth rates. Take two countries, A and B, with the
same initial level of income at some date. Imagine that country A has 0% growth
per capita, so its income per capita remains constant, while country B grows at 2%
per capita. In 200 years’ time country B will be more than 52 times richer than
country A. Therefore, the United States is considerably richer than Nigeria because
it has grown steadily over an extended period of time, while Nigeria has not (and
11