THE ECONOMICS OF MONEY,BANKING, AND FINANCIAL MARKETS 679
Bạn đang xem bản rút gọn của tài liệu. Xem và tải ngay bản đầy đủ của tài liệu tại đây (48.62 KB, 1 trang )
CHAPTER 25
Transmission Mechanisms of Monetary Policy
647
Output, Y
Peak
+
1
Peak
2
3
4
5
Years
Trough
(a) Aggregate output
Money
Supply, M
+
Peak
1
Peak
2
3
4
5
Years
Trough
(b) Money supply
Rate of Money
Supply Growth, Peak
*M /M +
Peak
1
2
3
4
5
Years
Trough
(c) Rate of money supply growth
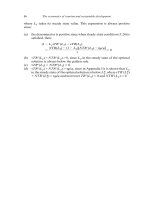
FIGURE 25-2
Hypothetical Example in Which Money Growth Leads Output
Although neither M nor Y leads the other (that is, their peaks and troughs coincide), *M/M
has its peaks and troughs one year ahead of M and Y, thus leading both series. (Note that
M and Y in the panels are drawn as movements around a positive average value; a plus sign
indicates a value above the average, and a minus sign indicates a value below the average,
not a negative value.)
has its peaks and troughs exactly one year before the peaks and troughs of the output series. We conclude that in our hypothetical economy, the rate of money growth
always decreases one year before output does. This evidence does not, however,
imply that money growth drives output. In fact, by assumption, we know that this
economy is one in which causation actually runs from output to the level of money
supply, and there is no lead or lag relationship between the two. Only by our judicious choice of using the growth rate of the money supply rather than its level have
we found a leading relationship.