THE ECONOMICS OF MONEY,BANKING, AND FINANCIAL MARKETS 140
Bạn đang xem bản rút gọn của tài liệu. Xem và tải ngay bản đầy đủ của tài liệu tại đây (67.37 KB, 1 trang )
Financial Markets
money growth increases. The expected-inflation effect begins immediately to overpower the liquidity effect, and the interest rate immediately starts to climb. Over
time, as the income and price-level effects start to take hold, the interest rate rises
even higher, and the eventual outcome is an interest rate that is substantially above
the initial interest rate. The result shows clearly that increasing money supply growth
is not the answer to reducing interest rates; rather, money growth should be reduced
in order to lower interest rates!
An important issue for economic policymakers is which of these three scenarios
is closest to reality. If a decline in interest rates is desired, then an increase in money
supply growth is called for when the liquidity effect dominates the other effects, as in
panel (a). A decrease in money growth is appropriate if the other effects dominate the
liquidity effect and expectations of inflation adjust rapidly, as in panel (c). If the other
effects dominate the liquidity effect but expectations of inflation adjust only slowly, as
in panel (b), then whether you want to increase or decrease money growth depends
on whether you care more about what happens in the short run or the long run.
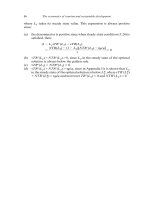
Which scenario does the evidence support? The relationship of interest rates and
money growth from 1968 to 2008 is plotted in Figure 5-13. When the rate of money
supply growth began to climb in the late-1970s, interest rates rose, indicating that
the price-level, income, and expected-inflation effects dominated the liquidity effect.
By the early 1980s, interest rates reached levels unprecedented in the post World
War II period, as did the rate of money supply growth.
The scenario depicted in panel (a) of Figure 5-12 seems doubtful, and the case
for lowering interest rates by raising the rate of money growth is much weakened.
Looking back at Figure 5-5 (page 95), which shows the relationship between interest rates and expected inflation, you should not find this too surprising. The rise in
the rate of money supply growth in the 1960s and 1970s is matched by a large rise
in expected inflation, which would lead us to predict that the expected-inflation
effect would be dominant. It is the most plausible explanation for why interest rates
rose in the face of higher money growth. However, Figure 5-13 does not really tell
Interest Rate
25
Money Growth Rate (M2)
20
20
15
15
10
10
5
5
0
0
F I G U R E 5 - 13
2010
2007
2004
2001
1998
1995
1992
1989
1986
1983
1980
1977
1974
1971
5
Money Growth (M2, Annual Rate) and Interest Rates (Three-Month
Treasury Bills), 1968 2008
Source: Statistics Canada CANSIM II Series V122531 and V41552796.
Money Growth Rate (% annual rate)
25
1968
PA R T I I
Interest Rate (%)
108