- Trang chủ >>
- Khoa Học Tự Nhiên >>
- Vật lý
Synthesis of large scale sic–sio2 nanowires decorated with amorphous carbon nanoparticles and raman and PL properties
Bạn đang xem bản rút gọn của tài liệu. Xem và tải ngay bản đầy đủ của tài liệu tại đây (426.74 KB, 5 trang )
Synthesis of large-scale SiC–SiO
2
nanowires decorated with amorphous carbon
nanoparticles and Raman and PL properties
Ryongjin Kim
a,b
, Weiping Qin
a,
*
, Guodong Wei
a
, Guofeng Wang
a
, Lili Wang
a
, Daisheng Zhng
a
,
Kezhi Zheng
a
, Ning Liu
a
a
State Key Laboratory on Integrated Optoelectronics, College of Electronic Science and Engineering, Jilin University, Weiping Qin, 2699 Qianjin Street, Changchun 130012, PR China
b
Semiconductor Research Laboratory, Department of Physics, Kim Il Sung University, Democratic People’s Republic of Korea
article info
Article history:
Received 19 March 2009
In final form 8 May 2009
Available online 13 May 2009
abstract
Large-scale SiC–SiO
2
core–shell nanowires decorated with carbon nanoparticles have been synthesized
on Si substrate using thermal decomposition of ethanol. The amorphous carbon nanop articles on SiO
2
shell are of hemispherical configuration hiving a mean diameter of about 20 nm. The average size of car-
bon nanoparticles estimated from Raman measurement is 23.4 nm close to that evaluated from transmis-
sion electron microscopic observation. Strong enhancement of blue emission band and appearance of a
new yellow emission band were observed in SiC–SiO
2
core–shell nanowires decorated with carbon nano-
particles and their origins were discussed. A possible synthesis mechanism of SiC–SiO
2
core–shell nano-
wires decorated with carbon nanoparticles was proposed.
Ó 2009 Published by Elsevier B.V.
1. Introduction
In connection with the discovery of carbon nanotubes and its
unique properties different from bulk materials in 1991 [1], several
kinds of one-dimensional (1D) nanostructures have been synthe-
sized with various methods [1–11]. Once various nanowires are
successfully synthesized, the next important step is to control their
architecture, size, and pattern for the practical needs of nanoelec-
tronics and/or nanophotonics [12]. This is a crucial step towards
the realization of functional alternative method for micro- and
nanoelectronics and nanophotonics development [13]. The SiC–
SiO
2
coaxial nanocables were first synthesized by reactive laser
ablation in 1998 and have great potential for applications because
they have the 1D features of both nanocables and nanotubes in the
axial direction and build an ideal semiconductor-insulator hetero-
junction in the radial direction [14]. One of the promising applica-
tions of SiC–SiO
2
nanowires is related to photoluminescence (PL)
property. Up to now, numerous publications have been made
assigning to the outstanding ultraviolet-blue emission property
of SiC–SiO
2
nanowires. In previous works, the PL property of SiC–
SiO
2
nanowires has been studied as-grown [15–19] and no effort
has been paid to control it. In present work, we present a novel
SiC–SiO
2
nanostructure decorated with amorphous carbon nano-
particles and its unique PL property. The SiC–SiO
2
nanowires dec-
orated with carbon nanoparticles have been synthesized on Si
substrate under atmospheric environment. Thermal decomposi-
tion of ethanol was used to produce carbon source for synthesis
of this nanostructure. Strong enhancement of blue emission band
and appearance of a new yellow emission band were observed
from this novel nanostructure. Structure and Raman property of
this nanostructure were characterized and the origins of several
PL bands were discussed. A synthesis process of SiC–SiO
2
core–
shell nanowires decorated with carbon nanoparticles was
explained.
2. Experiment procedure
The synthesis of SiC–SiO
2
nanowires decorated with carbon
nanoparticles was carried out in a conventional horizontal quartz
tube. In our synthesis, the Ni(NO
3
)
2
-coated Si substrate was di-
rectly used as a silicon source. 0.09
X
cm n-type (1 1 1) Si wafer
was firstly etched in 5% HF solution for 2 min to remove the native
oxide and then ultrasonically cleaned in acetone bath for 20 min.
Ni(NO
3
)
2
/ethanol solution (0.05 M) was dropped onto Si wafers
and dried at 100 °C in the air. The catalyst-dropped Si substrates
were loaded on a planar alumina crucible and put into the center
of quartz tube. Before heating, the furnace was purged by
1000 ml/min Ar gas flow (99.99%) for 1 h. After finished purging,
the Ar gas flow rate was adjusted down to 300 ml/min and then
gaseous ethanol was introduced into the furnace through a bubbler
using Ar as carrier gas. The flow rate of Ar through the bubbler was
held at 10 ml/min. The synthesis of SiC–SiO
2
nanowires decorated
with carbon nanoparticles was carried out at 1100 °C for 3 h under
the atmospheric pressure. After finished synthesis, the surface of
the sample synthesized at 300 ml/min Ar gas flow rate (condi-
tion-1) was covered with wheat-colored product. For comparison,
same synthesis route was carried out under 100 ml/min Ar gas
0009-2614/$ - see front matter Ó 2009 Published by Elsevier B.V.
doi:10.1016/j.cplett.2009.05.013
* Corresponding author. Fax: +86 431 85168240 8325.
E-mail address: (W. Qin).
Chemical Physics Letters 475 (2009) 86–90
Contents lists available at ScienceDirect
Chemical Physics Letters
journal homepage: www.elsevier.com/locate/cplett
flow rate. The sample synthesized at 100 ml/min flow rate (condi-
tion-2) was covered with white-colored product. The products
were characterized by scanning electron microscopy (SEM), X-ray
diffraction (XRD), energy-dispersive X-ray spectroscopy (EDX),
transmission electron microscopy (TEM), high-resolution trans-
mission electron microscopy (HRTEM), selected area electron dif-
fraction (SAED), and Raman spectroscopy. Photoluminescence
experiment was carried out at room temperature by using the
He–Cd laser as an exciting source.
3. Results and discussion
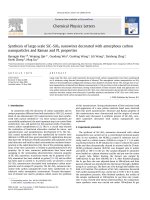
Fig. 1 is the XRD pattern of the SiC–SiO
2
nanowires decorated
with carbon nanoparticles. In XRD pattern, five peaks indexed with
(1 1 1), (2 0 0), (2 2 0), (3 1 1), and (2 2 2) are consistent with the
standard face-centered cubic (fcc) cell of 3C–SiC (JCPDS card No.
73-1665), which has the lattice constant of a = 0.4349 nm. The
strong SiC (1 1 1) peak implies the predominant growth along
[1 1 1) direction of nanowires. A peak centered at 28.6° is due to
Si substrate. Two peaks at around 45° are assigned to Ni–Si alloy
[20]. A broad peak centered at about 21° is similar to that of pure
silica glasses and attributed to amorphous SiO
2
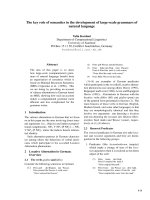
. Fig. 2 shows the
morphologies of two samples obtained at two Ar gas flow rates.
It is explicit that large-scale randomly oriented nanowires have
been synthesized on Si substrates in two cases (Fig. 2a and b).
High-magnified SEM observation displayed rough surface mor-
phology of the individual nanowire synthesized under the condi-
tion-1 (Fig. 2c), while smooth and clean surface morphology was
observed from that synthesized under the condition-2 (Fig. 2d).
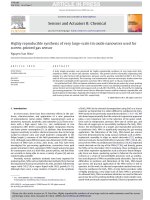
Further characterization was carried out using TEM. From TEM
images, the core–shell nanostructures of two kinds of nanowires
are clearly recognized. The SAED patterns recorded from two kinds
of nanowires demonstrate that there are a set of sharp single crys-
tal diffraction spots and an amorphous diffraction ring (two up-
right inserts of Fig. 3a and b). Based on HRTEM observation, it is
confirmed that the core is crystalline material and the shell is
amorphous one (an up-left insert of Fig. 3a). The distance between
two fringes in core part, is about 0.26 nm close to the (1 1 1) spac-
ing of 3C–SiC (an up-left insert of Fig. 3b). Compared to the result
of XRD measurements, the amorphous shell is SiO
2
. Therefore it is
concluded that our nanowires consist of SiC–SiO
2
core–shell nano-
structure. Like the above result of SEM observation, smooth surface
was observed from TEM image of the nanowires synthesized under
the condition-2. Meanwile, a lot of hemispheric depositions were
found on the surface of the nanowires synthesized under the con-
dition-1. The mean diameter of hemispheric depositions was eval-
uated to be about 20 nm and their concentration on the surface of
SiO
2
shell was about 120
l
m
À2
. The interface between hemispheric
deposition and SiO
2
shell layer is clearly observed from HRTEM im-
age (an up-left insert of Fig. 3a). The distance between two fringes
in HRTEM image of a hemispherical deposition was estimated to be
0.346 nm, which is slightly superior to the theoretical value of d
002
interplanar distance in graphite (0.338 nm, JCPDS Card No. 00-001-
0640). The graphitic plane was found to be roughly oriented along
the axial direction of nanowires. The corresponding EDX spectra
confirm that the carbon content in the nanowires having hemi-
spherical depositions on it is higher than that in the nanowires
having smooth surface morphology. It is obvious that such high
carbon content is due to the existence of carbon nanoparticles on
the surface of nanowires. The existence of carbon nanoparticles
on the surface of nanowires is also identified by Raman measure-
ment as shown in Fig. 4 (spectrum (a)). For comparison, the Raman
spectrum of the nanowires having smooth surface morphology was
presented together (spectrum (b)). In Raman spectra, the peaks
having their maximum positions at 793 and 796 cm
À1
are due to
SiC TO mode [21–23]. The SiC LO mode, which is expected at
972 cm
À1
, is not very clear in two spectra. The degradation of the
corresponding SiC LO mode is indicative of growth along the
[1 1 1] direction by the select rule for zincblende structure polar
crystal [24]. This result is well agreement with the results of XRD
and TEM. Two peaks centered at $1337 and $1592 cm
À1
often
called as D- and G-band, respectively confirm the existence of car-
bon [22–25]. The D-band is known as to appear due to the breath-
ing mode of A
1g
symmetry, which only becomes active in the
presence of disorder arising from the crystal boundaries of poly-
crystalline graphite [25]. The G-band ensues from the stretching
mode of ‘sp
2
’ ðC
2
sp
À C
2
sp
Þ bonds (E
2g
symmetry in-plane stretching
mode of single crystal graphite) [22,25]. The D-band grows in
intensity with increasing disorder or decreasing crystal size and
the ratio of its intensity to that of G-band, I
D
/I
G
, is inversely propor-
tional to the average size, L
a
, for disordered graphite in the range
2nm<L
a
< 300 nm [26,27]. The intensity ratio of two bands, I
D
/
I
G
, can be expressed as follows:
I
D
I
G
¼
CðkÞ
L
a
where C(k) is 4.4 nm for incident laser wavelengths of 514 nm
[28,29]. The intensities of the D-band and G-band were determined
by adopting the fitting method used by Ward et al. [25]. For spec-
trum (a), the average size of graphite structure is estimated to be
about 23.4 nm close to the value determined from TEM observation.
D- and G-band were also appeared in spectrum (b). As can be seen
in Fig. 4, D- and G-band in spectrum (b) are different from those of
spectrum (a) in position, width, and intensity ratio between them.
For example, the average size for spectrum (b) is estimated to be
2.4 nm. This fact implies that structural properties of the carbon
in two kinds of nanowires are different. It is well known that an
interlayer having high carbon concentration exists at the interface
between SiC and SiO
2
and this interlayer induce carbon-related
peaks (D- and G-band) in Raman scattering [30]. It is thought that
the carbon-related peaks in spectrum (b) were caused by high car-
bon concentration at the interface between SiC core and SiO
2
shell.
Fig. 5 shows several PL spectra recorded from different nano-
wires. In Fig. 5, spectrum (a) and (b) were recorded from two kinds
of nanowires. Strong enhancement of blue emission band at about
482 nm (2.58 eV) and appearance of a new yellow emission band
centered at about 568 nm (2.17 eV) was observed from the nano-
wires decorated with carbon nanoparticles. For the nanowires hav-
ing smooth surface morphology, the blue emission centered at
482 nm remains as a shoulder and yellow band is absent. It is
known that the PL from SiC–SiO
2
core–shell nanowires is mainly
originated from their SiO
2
shells [31]. Meanwhile, there are many
reports on the blue emission from SiO
2
[32–35]. In these reports,
Fig. 1. XRD pattern of SiC-SiO
2
nanowires decorated with carbon nanoparticles.
R. Kim et al. / Chemical Physics Letters 475 (2009) 86–90
87
it is commonly accepted that blue emission from SiO
2
is mainly
originated from the oxygen deficiency. In the SiC–SiO
2
nanowires
decorated with carbon nanoparticles, it is possible that the higher
defect density is caused in SiO
2
shell by the diffusion and reactions
of carbon species in SiO
2
matrix [24]. The higher defect density will
result in the enhancement of blue emission. The yellow band can
also be regarded in connection with carbon. The SiC–SiO
2
core–
shell nanostructure exists commonly in two kinds of nanowires,
Fig. 2. SEM images and corresponding EDX spectra of nanowires synthesized at different Ar flow rates.
Fig. 3. TEM images of nanowires synthesized at different Ar flow rates.
88 R. Kim et al. / Chemical Physics Letters 475 (2009) 86–90
but the nanowires having smooth surface morphology do not re-
veal yellow emission band. Therefore, it is reasonable to regard
that the yellow band is originated from SiO
2
–C system. Seo et al.
[36] found intense luminescence of carbon-doped silicon-rich sili-
con oxide, which could be tuned from 1.8 to 2.5 eV. More recently,
Ishikawa et al. [24] reported yellow–white light emission from car-
bon-incorporated silicon oxide. They proposed that electronic
states at the interface between carbon clusters and silicon oxide
and/or carbon-related defects in the SiO
2
matrix (for example,
the substitution of oxygen atoms by carbon atoms) could be the
yellow–white emitting sites. We believe that the yellow band for
SiC–SiO
2
nanowires decorated with carbon nanoparticles has same
origin with that reported by Ishikawa et al.
At the end, we briefly discuss the synthesis process of SiC–SiO
2
nanowires decorated with carbon nanoparticles. Ethanol is ther-
mally decomposed into several species, such as CO, CO
2
,CH
4
,
C
2
H4, C
2
H
2
,H
2
O and H
2
at the temperature higher than 700 °C
[37]. As the temperature goes above 1000 °C, the hydrocarbon spe-
cies are decomposed into H
2
and C [38]. Among the several species
produced by ethanol pyrolysis, H
2
and CO are main gaseous prod-
ucts [37]. In the catalyst-assisted synthesis, SiC–SiO
2
core–shell
nanowires grow via a well known vapor–liquid–solid (VLS) mech-
anism [26]. If the flow rate of Ar dilution gas is slow, carbon is oxi-
dized by H
2
O and O
2
(contained in Ar dilution gas) or deposit on
the inner wall of quartz tube before reaches at the surface of Si
substrate. As a result, CO becomes only carbon source for growth
of SiC–SiO
2
core–shell nanowires. At high Ar flow rate, some car-
bon atoms reach at the surface of Si substrate unoxidized. The
unoxidized carbon atoms will be deposited on the surface of SiO
2
shell and thus, nanoparticles will be formed on SiO
2
shell. Further
increasing of Ar flow rate result in the large amount of carbon
depositions on the surface of SiO
2
shell and these nanowires did
not emit measurable PL.
4. Conclusion
SiC–SiO
2
core–shell nanowires decorated with carbon nanopar-
ticles have been synthesized using thermal decomposition of eth-
anol. The existence of carbon nanoparticles induced strong
carbon-related bands in Raman spectrum. The enhancement of
blue emission band and a new yellow band were observed from
SiC–SiO
2
core–shell nanowires decorated with carbon nanoparti-
cles and considered to relate to the enhancement of oxygen defi-
ciency and appearance of carbon-related default level due to
carbon diffusion into SiO
2
and electronic state at the interface be-
tween carbon nanoparticles and SiO
2
shell.
Acknowledgement
This research was supported by Natural Science Foundation of
China (Grant Nos. 50672030 and 10874058).
References
[1] S. Iijima, Nature 354 (1991) 56.
[2] A.M. Morales, C.M. Lieber, Science 279 (1998) 208.
[3] J.D. Holmes, K.P. Johnson, R.C. Doty, B.A. Korgel, Science 287 (2000) 1471.
[4] T.J. Trentler, K.M. Hickman, S.C. Goel, A.M. Viano, P.C. Gibbons, W.E. Buhro,
Science 270 (1995) 1791.
[5] M.S. Gudiksen, L.J. Lauhon, J. Wang, D.C. Smith, C.M. Lieber, Nature 415 (2002)
617.
[6] Y.Y. Wu, R. Fang, P.D. Yang, Nano Lett. 2 (2002) 83.
[7] M.T. Björk et al., Nano Lett. 2 (2002) 87.
[8] Y. Zhang, K. Suenaga, C. Colliex, S. Iijima, Science 281 (1998) 973.
[9] Z.W. Pan, Z.R. Dai, Z.L. Wang, Science 291 (2001) 1947.
[10] H.F. Zhang, A.C. Dohnalkova, C.M. Wang, J.S. Young, E.C. Buck, L.S. Wang, Nano
Lett. 2 (2002) 105.
[11] D. Rhodes, A. Klug, Nature 286 (1980) 573.
[12] E.C. Scher, L. Manna, A.P. Alivisatos, Philos. Trans. R. Soc. London, Ser. A 361
(2003) 241.
[13] S. Link, M.A. El-Sayed, Annu. Rev. Phys. Chem. 54 (2003) 331.
[14] Y. Zhang, K. Suenaga, C. Colliex, S. Ijima, Science 281 (1998) 973.
[15] X.J. Wang, J.F. Tian, L.H. Bao, C. Hui, T.Z. Yang, C.M. Shen, H J. Gao, J. Appl. Phys.
102 (2007) 014309.
[16] X.M. Liu, K.F. Yao, Nanotechnology 16 (2005) 2932.
[17] Z.J. Li, W.D. Gao, A.A. Meng, Z.D. Geng, L. Gao, J. Phys. Chem. C 113 (2009) 91.
[18] J. Zhang, Q.S. Wang, F. Wang, X.H. Chen, W.W. Lei, Q.L. Cui, G.T. Zou, J. Phys. D:
Appl. Phys. 42 (2009) 035108.
[19] C.H. Liang, G.W. Meng, L.D. Zhang, Y.C. Wu, Z. Cui, Chem. Phys. Lett. 329 (2000)
323.
[20] P. Zhao, M.J. Kim, B.E. Gnade, R.M. Wallace, Microelectron. Eng. 85 (2008) 54.
[21] Y. Yan, S.L. Zhang, S.S. Fan, W.Q. Han, G.M. Meng, L.D. Zhang, Solid State
Commun. 126 (2003) 649.
[22] Ph. Colomban, G. Gouadec, L. Mazerolles, Mater. Corros. 53 (2002) 306.
[23] Z.J. Li, J.L. Zhang, A. Meng, J.Z. Guo, J. Phys. Chem. B 110 (2006) 22382.
[24] Y. Ishikawa et al., J. Appl. Phys. 104 (2008) 083522.
[25] S. Hayashi, Y. Kanzawa, M. Kataoka, T. Nagareda, K. Yamamoto, Z. Phys. D 26
(1993) 144.
[26] D.F. Liu et al., Chem. Phys. Lett. 375 (2003) 269.
[27] B. Wolfgang, E. Claus, G. Mimoza, Thermochim. Acta 456 (2007) 64.
[28] F. Tuinstra, J.L. Koenig, J. Chem. Phys. 53 (1970) 1126.
[29] D.S. Knight, W.B. White, J. Mater. Res. 4 (1989) 385.
[30] S.H. Choi, D. Wang, J.R. Williams, M. Park, W. Lu, S. Dhar, L.C. Feldman, Appl.
Surf. Sci. 253 (2007) 5411.
Fig. 4. Raman spectra of nanowires. (a) synthesized at 300 ml/min, (b) synthesized
at 100 ml/min.
Fig. 5. PL spectra recorded from different nanowires and corresponding color
optical photographs. (a) synthesized at 300 ml/min, (b) synthesized at 100 ml/min.
R. Kim et al. / Chemical Physics Letters 475 (2009) 86–90
89
[31] K.F. Cai, A.X. Zhang, J.L. Yin, H.F. Wang, X.H. Yuan, Appl. Phys. A 91 (2008) 579.
[32] C.H. Liang, G.W. Meng, L.D. Zhang, Y.C. Wu, Z. Cui, Chem. Phys. Lett. 329 (2000)
323.
[33] N.G. Shang, U. Vetter, I. Gerhards, H. Hofsäss, C. Ronning, M. Seibt,
Nanotechnology 17 (2006) 3215.
[34] D.P. Yu et al., Appl. Phys. Lett. 73 (1998) 3078.
[35] X. Fan, X.M. Meng, X.H. Zhang, C.S. Lee, S.T. Lee, Appl. Phys. Lett. 90 (2007)
103114.
[36] S.Y. Seo, K.S. Cho, J.H. Shin, Appl. Phys. Lett. 84 (2004) 717.
[37] M. Peg, M.P. Ruiz, A. Callejas, A. Millera, R. Bilbao, M.U. Alzueta, Pyrolysis
ethanol under flow reactor conditions, in: Third European Combustion
Meeting ECM 2007, published by Greek Section of the Combustion
Institute.
[38] M.P. Ruiz, A. Callejas, A. Millera, M.U. Alzueta, R.J. Bilbao, Anal. Appl. Pyrol. 79
(2007) 244.
90 R. Kim et al. / Chemical Physics Letters 475 (2009) 86–90