- Trang chủ >>
- Khoa Học Tự Nhiên >>
- Vật lý
Characteristics of siox nanowires synthesized via the thermal heating of cu coated si substrates
Bạn đang xem bản rút gọn của tài liệu. Xem và tải ngay bản đầy đủ của tài liệu tại đây (1015.63 KB, 5 trang )
Physica E 37 (2007) 163–167
Characteristics of SiO
x
nanowires synthesized via the thermal heating of
Cu-coated Si substrates
Hyoun Woo Kim
Ã
, Seung Hyun Shim, Jong Woo Lee
School of Materials Science and Engineering, Inha University, Incheon 402-751, Republic of Korea
Available online 13 October 2006
Abstract
We have demonstrated the growth of SiO
x
nanowires by the simple heating of the Cu-coated Si substrates. We have applied X-ray
diffraction, scanning electron microscopy and transmission electron microscopy techniques to characterize the structure of the samples.
The as-synthesized SiO
x
nanowires had amorphous structures with diameters in the range of 20–80 nm. The thickness of the Cu layer
affected the resultant sample morphology, favoring the nanowire formation at smaller thickness. Photoluminescence spectra of the
nanowires exhibited blue emission. We have proposed the possible growth mechanism.
r 2006 Elsevier B.V. All rights reserved.
PACS: 61.46.+w; 78.55.Àm; 81.07.Àb
Keywords: Nanostructures; Chemical synthesis; Transmission electron microscopy
1. Introduction
Since one-dimensional (1D) nanomaterials in the form of
tubes, wires, and belts have attracted much attention
because of their interesting geometries, novel properties,
and potential applications [1–3], considerable efforts have
been placed on the synthesis and characterization of those
materials over the past several years.
Silicon (Si) and silica (SiO
x
) nanostructures have
attracted considerable attention due to their unique
properties and promising application in mesoscopic re-
search, nanodevices, and opto-electronics devices [4–6].
Particularly, SiO
x
is an important material for photo-
luminescence (PL) [7,8]. Since the majority of SiO
x
nanowires fabrication methods are catalyst-based methods,
different kinds of metal catalysts have been used, such as
Au [9–13], Pd–Au [14],Fe[15–18],Ga[19,20], Ga–In [21],
Ni [22], In–Ni [23],Sn[24],andCo[25].
Copper (Cu) is a good conductor of heat and electricity
(secondly only to silver in electrical cond uctivity) and has
long been widely used in electronic devices. Howev er, to
our best knowledge, synthesis of any inorganic nanostruc-
ture on Cu substrates has not been reported to date.
In this paper, for the first time we report the production
of SiO
x
nanowires by the simple heating of Cu-coated Si
substrates. We have investigated the effect of Cu layer
thickness on the growth of SiO
x
nanowires. We discuss the
possible growth mechanism with respect to the role of the
predeposited Cu layers.
2. Experimental
The growth process was carried out in a quartz tube. The
experimental apparatus has been described elsewhere [26].
We have employed Cu-coated Si substrates. In ord er to
fabricate the Cu-coated Si substrates, we used Si as starting
materials onto which a layer of Cu in the range 15–60 nm
was deposited by the sputtering.
On top of the alumina boat, a piece of the substrate was
placed with the Cu-coated side downwards. The quartz
tube was inserted into a horizontal tube furnace. During
the experiment, a constant pressure with an air flow
($3.1% O
2
in a balance of argon) was maintained at
300 mTorr. The furnace was heated at a rate of 10 1C min
À1
to a target temperature of 1000 1C. After 2 h of typical
ARTICLE IN PRESS
www.elsevier.com/locate/physe
1386-9477/$ - see front matter r 2006 Elsevier B.V. All rights reserved.
doi:10.1016/j.physe.2006.09.001
Ã
Corresponding author. Tel.: +82 32 860 7544; fax: +82 32 862 5546.
E-mail address: (H.W. Kim).
deposition process at 1000 1C, the substrate was cooled
down and then removed from the furnace for analysis.
As-grown samples were investigated and analyzed using
glancing angle (0.51) X-ray diffraction (XRD, X’pert
MPD-Philips with CuKa
1
radiation), scanning electron
microscopy (SEM, Hitachi S-4200), and transmission
electron microscopy (TEM, Philips CM-200) with energy-
dispersive X-ray (EDX) spectroscopy attached. TEM
samples were prepared by sonicating the substrate in
acetone by ultrasonic treatment. A drop of the dispersion
solution was then placed on a porous carbon film
supported on a gold grid. PL spectra of the samples were
measured in a SPEX-1403 photoluminescence spectrometer
with a He–Cd laser (325 nm, 55 mW) at room temperature.
3. Results and discussion
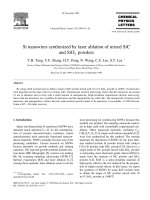
Fig. 1a shows the SEM top views of the sample
morphology on the Cu-coated Si substrates, in which the
thickness of the predeposited Cu layer was about 15 nm.
There are randomly oriented nanowires on the substrate.
Statistical observation of many SEM images indicated that
the diameter of nanowires varied from 20 to 80 nm. Fig. 1b
shows the cross-sectional SEM image, indicating that the
tangled nanowires are grown on the substrate. It is
noteworthy that there is a highly undulated interface
between the nanowire layer and the substrate, suggesting
that the nanowires are rooted from the substrate. Fig. 1c
shows the XRD patterns of the product, revealing that the
nanowires are fully amorphous. No reflections are clearly
discerned other than the (2 0 0) diffraction peak of Cu
(JCPDS: 04-0836), possibly from the substrate.
TEM shows the general morphology and dimension of
SiO
x
nanowires. Figs. 2a and b show the TEM images of
the product, indicating that this raw material indeed
consists of aggregates of nanowires. Although most
nanowires have straight or smoothly curved morphology,
some nanowires indicated by arrow 1 exhibit the helical
structure (Fig. 2a). The similar helical nanowires were
previously produced by using the Fe catalysts [16, 18].In
addition, nanoparticles (indicated by arrow 2 in Fig. 2b)
were observed in the middle and/or at the ends of the wires.
As shown in the inset of Fig. 2a, the highly dispersed
selected area electron diff raction (SAED) pattern indicates
that the nanowires are amorphous. Fig. 2c shows a
HRTEM image of a single nanowire, indicating that the
nanoparticle at the tip of the nanowire appears dark
and have high contrast compared with the nanowire stem.
A thin amorphous layer of 3–8 nm thickness exists on the
surface of nanoparticle at the tip.
EDX measurement made on the wire stem reveals that
the nanowire stem consists of Si and O (Fig. 2d). Au signals
are generated from the gold grid on which these nanowires
were supported. EDX spectrum on the wire tip shows the
signals of Si, O, Au, and Cu elements (Fig. 2e). By
comparing Fig. 2e with d, although we do not know the
exact chemical composition of the nanoparticle, we
ARTICLE IN PRESS
Fig. 1. (a) Plan-view; (b) side-view SEM images of the product and
(c) X-ray diffraction pattern recorded from the product.
H.W. Kim et al. / Physica E 37 (2007) 163–167164
propose that the nanoparticle at least comprises a Cu
element.
The solidified spherical droplet at the tip or in the middle
of the nanowires is commonly considered to be the
evidence for the operation of the vapor–liquid–solid
(VLS) mechanism, which is in agreement with our
experimental conditions and the observed results. Since
the available Si source was the substrate itself, it is
interesting to note that the present synthetic process mainly
involves the solid phase with respect to the Si elements.
Similarly, various forms of SiO
x
nanowires including
straight, curved, and helical-shaped nanowires have been
fabricated previously using the VLS method [10,13–16,
19–21,23,24].
The growth of the SiO
x
nanowires in the present study
can be divided into several steps. In the first step, when the
Si wafer with Cu film was heated, the Cu/Si liquid droplets
will form at 1000 1C because of its relatively low eutectic
temperature (802 1C) [27]. In the second step, the droplets
or na noparticles act as the nucleation sites, initiating the
growth of SiO
x
nanowires. The liquid state parti cles should
easily absorb oxygen and the presence of a relatively small
amount of oxygen is not expected to change the Cu–Si
phase diagram significantly. The most likely source of
oxygen may come from the O
2
in the carrier gas, while the
oxygen adsorbed on the Si wafer due to air exposure during
the processing and the residual oxygen in the tube can be
other sources. No extra Si source other than Si substrate
was introduced in the present study. The undul ated
interface as shown in Fig. 1b also supports that Si
originated from the substrate. As the droplets become
supersaturated, amorphous SiO
x
nanowires are formed,
possibly by the reaction between Si and O. In the third step,
by continuously dissolving Si and O onto nanoparticles,
the SiO
x
nanowires may subsequently grow. The droplet
will continuously absorb Si atoms as it is abundant in the
system. Also, the O
2
in the carrier gas can supply a
constant oxygen source during the process.
In order to investigate the role of Cu layer thickness
played in the formation of SiO
x
nanowires, we have varied
the film thickness in the range of 15–60 nm. As shown
in Fig. 3, different Cu layer thicknesses gave different
results. We have obtained the bundles of nanowires at
15 nm, whereas we only observe the big islands by using
a 60 nm-thick Cu layer. With the thick layer of 30 nm,
few nanowires start to form as shown in Fig. 3b.To
ARTICLE IN PRESS
Fig. 2. (a,b) Low-magnification TEM images showing the general morphology of SiO
x
nanowires (Arrow 1: helical nanowires or nanosprings; Arrow 2:
nanoparticles). The lower right inset of (a) is the SAED pattern of SiO
x
nanowires. (c) HRTEM image of a single nanowire. The nanowire terminates with
a nanoparticle. EDX spectra of (d) the wire stem and (e) the wire tip.
H.W. Kim et al. / Physica E 37 (2007) 163–167 165
summarize, we observed that the areal density of the SiO
x
nanowires decreased with increasing the Cu layer thickness.
When the Cu layer is relatively thin, the 1000 1C-heating
during the synthesis process presumably promotes the
agglomeration of Cu layer and thus the formation of the
island-like structures with a wide interspace. Therefore,
nanowires may be formed independently from the locally
present small islands. On the other hand, the relatively
thick Cu layer may not be transformed into the small
enough islands. The formed big islands may provide dense
nucleation sites, generating the cluster-like structures by
the interference and agglomeration of SiO
x
nuclei.
Although we have succeeded in providing a route to
fabricating the 1D materials of SiO
x
, further experimental
study is needed to fine-tune the growth process and to
clearly understand the synthesis mechani sm.
Fig. 4 shows the PL spectrum of the SiO
x
nanowires
measured at room temperature, which is an apparent broad
emission band mainly located in the visible region.
Gaussian fitti ng analysis showed that the broad emission
band was a superimposition of two major peaks at 428 and
469 nm, respectively. The similar blue emission with a peak
position in the range of 414–470 nm have been previously
observed in the PL spectrum of SiO
x
nanowires
[11,13,15,28], which was ascribed to neutral oxygen
vacancy or oxygen deficiency-related diamagnetic defect
centers [15]. We believe that the blue light emission from
the SiO
x
nanowires in the present study can be attributed
to the above-mentioned defects arising from oxygen
deficiency, presumably being generated during the high
temperature synthetic process.
4. Conclusion
In summary, we have achieved the growth of SiO
x
nanowires through a Cu-catalyzed process. SEM images
ARTICLE IN PRESS
Fig. 3. Plan-view SEM images of the product with the Cu layer
thicknesses of: (a) 15 nm; (b) 30 nm, and (c) 60 nm.
200 300 400 500 600 700 800 900
Sample peak
Gauss fit (1+2)
Gauss fit (1,2)
Wavelength (nm)
PL Intensity (a.u.)
1
428
2
469
Fig. 4. PL of the SiO
x
nanowires. The blue light emission was revealed
peaking at 421 and 448 nm.
H.W. Kim et al. / Physica E 37 (2007) 163–167166
indicate that the nanowires have diameters in the range of
20–80 nm. XRD, SAED, and EDX analyses reveal that the
nanowires are amorphous and consist only of silicon oxide.
The growth of SiO
x
nanowires is most likely controlled by
the VLS mechanism with Cu-related catalytic particles. By
varying the thickness of Cu layer, we reveal that thin
enough Cu layer promotes the production of nanowires.
The room-temperature PL measurement with the Gaussian
fitting shows apparent blue light emission bands centered
at 428 and 469 nm.
Acknowledgment
This work was supported by Inha Research Fund 2006.
References
[1] S. Iijima, Nature 354 (1991) 56.
[2] A. Morales, C.M. Lieber, Science 279 (1998) 208.
[3] Z.W. Pan, Z.R. Dai, Z.L. Wang, Science 291 (2001) 1947.
[4] S. Mann, G.A. Ozin, Nature 382 (1996) 313.
[5] A. Katz, M.E. Davis, Nature 403 (2000) 286.
[6] C.T. Kresge, M.W. Leonowicz, W.J. Roth, J.C. Vartuli, J.S. Beck,
Nature 359 (1999) 710.
[7] H. Nishikawa, T. Shiroyama, R. Nakamura, Y. Ohiki, K. Nagasawa,
Y. Hama, Phys. Rev. B 45 (1992) 586.
[8] L.S. Liao, X.M. Bao, X.Q. Zhang, N.S. Li, N.B. Min, Appl. Phys.
Lett. 68 (1996) 850.
[9] S H. Li, X F. Zhu, Y P. Zhao, J. Phys.Chem. B 108 (2004) 17032.
[10] J.S. Wu, S. Dhara, C.T. Wu, K.H. Chen, Y.F. Chen, L.C. Chen, Adv.
Mater. 14 (2002) 1847.
[11] Z.Q. Liu, S.S. Xie, L.F. Sun, D.S. Tang, W.Y. Zhou, C.Y. Wang,
W. Liu, Y.B. Li, X.P. Zou, G. Wang, J. Mater. Res. 16 (2001) 683.
[12] M. Paulose, O.K. Varghese, C.A. Grimes, J. Nanosci. Nanotechnol. 3
(2003) 341.
[13] Y.W. Wang, C.H. Liang, G.W. Meng, X.S. Peng, L.D. Zhang,
J. Mater. Chem. 12 (2002) 651.
[14] J.L. Elechiguerra, A. Camacho-Bragado, J. Manriquez, J.P. Zhou,
M. Jose-Yacaman, Microsci. Microanal. 10 (2004) 388.
[15] D.P. Yu, Q.L. Hang, Y. Ding, H.Z. Zhang, Z.G. Bai, J.J. Wang,
Y.H. Zou, W. Qian, G.C. Xiong, S.Q. Feng, Appl. Phys. Lett. 73
(1998) 3076.
[16] H F. Zhang, C M. Wang, E.C. Buck, L S. Wang, Nano Lett. 3
(2003) 577.
[17] X.C. Wu, W.H. Song, K.Y. Wang, T. Hu, B. Zhao, Y.P. Sun,
J.J. Du, Chem. Phys. Lett. 336 (2001) 53.
[18] C.H. Liang, L.D. Zhang, G.W. Meng, Y.W. Wang, Z.Q. Chu,
J. Non-cryst. Solids 277 (2000) 63.
[19] Z. Pan, S. Dai, D.B. Beach, D.H. Lowndes, Nano Lett. 3 (2003) 1279.
[20] Z.W. Pan, Z.R. Dai, C. Ma, Z.L. Wang, J. Am. Chem. Soc. 124
(2002) 1817.
[21] J.C. Wang, C.Z. Zhan, F.G. Li, Solid State Commun. 125 (2003) 629.
[22] Z. Zhang, G. Ramanath, P.M. Ajayan, D. Golberg, Y. Bando, Adv.
Mater. 13 (2001) 197.
[23] R. Ma, Y. Bando, Chem. Phys. Lett. 377 (2003) 177.
[24] S.H. Sun, G.W. Meng, M.G. Zhang, Y.T. Tian, T. Xie, L.D. Zhang,
Solid State Commun. 128 (2003) 287.
[25] H. Takikawa, M. Yatsuki, T. Sakakibara, Jpn. J. Appl. Phys. 38
(1999) L401.
[26] H.W. Kim, N.H. Kim, J.H. Myung, S.H. Shim, Phys. Stat. Sol. (A)
202 (2005) 1758.
[27] T.B. Massalski, first ed, Binary alloy phase diagrams, Vol. 1,
American Society for Metals, Metals Park, Ohio, 1986, p. 960.
[28] G.Z. Ran, L.P. You, L. Dai, Y.L. Liu, Y. Lv, X.S. Chen, G.G. Qin,
Chem. Phys. Lett. 384 (2004) 94.
ARTICLE IN PRESS
H.W. Kim et al. / Physica E 37 (2007) 163–167 167