- Trang chủ >>
- Khoa Học Tự Nhiên >>
- Vật lý
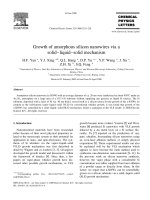
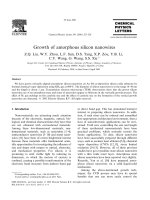
Pavesi photonics applications of nano silicon
Bạn đang xem bản rút gọn của tài liệu. Xem và tải ngay bản đầy đủ của tài liệu tại đây (1.75 MB, 23 trang )
Frontiers in Optical Technology, edited by P. K. Choudhury and O. N. Singh
(Nova Science Publishers, Inc., New York 2006)
Photonics applications of nano-silicon
Lorenzo Pavesi
Dipartimento di Fisica, Università di Trento, via Sommarive 14, 38050 Povo (Trento), Italy
url: http:\\science.unitn.it\~semicon\
(30/09/2005)
ABSTRACT
In this chapter we will review the photonic applications of nanostructured silicon. As we change the dimensionality
of silicon very fascinating and new optical properties of the material appear. In particular, light emission starts to
be a very efficient process in nanostructured silicon and light emitting diodes with efficiency in excess of 1% have
been fabricated. Optical amplification has been also observed when silicon nanocrystals are embed into a
dielectric matrix. This makes the system a potential candidate for laser action. In addition to electronic property
variations, nanostructured silicon can be also used as a nanodielectric material, where controlled changes in the
refractive index can lead to trapping or slow down of photons. Some examples will be discussed where photonic
Bloch oscillations, photonic Zener tunnelling and high quality microcavities are demonstrated. All these various
phenomena paves the way to a new field of applications for the "old dog" of microelectronics.
1. INTRODUCTION
Low dimensional silicon is a fascinating material which still has many unfold properties. The main motivation to
study silicon comes from its success and dominance in modern technology, especially in microelectronics. Indeed
nanometre sized transistors are now switching in computers at working frequency exceedingly few GHz.
Convergence between microelectronics and telecommunications is looked for in order to couple the computing
power of microprocessor with the transmission power of optical fibers. In this effort, merging of various
semiconductor technologies is attempted in order to improve on one side the optical properties of microelectronic
materials and, on the other side, to reduce the cost of photonic devices. With this respect silicon photonics is
playing a key role. We have already reviewed in the past several aspects of this emerging technology [1]. In this
chapter we aim to give an overview of our recent work towards the exploitation of low dimensional silicon to tune on
one side its electronic properties and on the other side its dielectric properties.
Figure 1. The De Broglie wavelength of an electron at 300 K.
- 2 -
Let us define which dimensional scale we are concerned with. If one computes the De Broglie wavelength of
electrons in silicon one notices that it is about 5 nm (Fig. 1). So in this paper we are concerned with very tiny
amount of silicon whose size is only a few nanometre. If the structure conserves a crystalline character we will call
it silicon nanocrystals, if not we will call it silicon nanoclusters. In many instances this distinction is purely academic,
so we will refer simply to Si-nc, meaning that we are not concerned by the crystalline or amorphous character of
the particle.
This chapter is organized in three sections: the first is about the way to produce Si-nc and the modification of its
electronic structure caused by the low-dimension, the second is about the improved optical properties of silicon
which are observed when it is reduced to small particles, and the third is about the optical properties caused by the
variation in its dielectric structures.
2. LOW DIMENSIONAL SILICON
The best way to understand the effects of the reduced dimensionality on the energy spectrum of an electron is to
resort to the particle-in-a-box problem so familiar in quantum mechanics. Within the effective mass approximation
in the envelope wave function description, the transition energy of an electron-hole pair of effective reduced mass
µ confined in a quantum dot of sizes L
x
, L
y
, L
z
is
2
22
2
22
22
y
xz
GG
xyz
n
nn
n
EE E
LLL d
π
ππ
π
µµ
=+ + + ≈+
, (1)
where we have assumed that the confining energy barrier is of infinite strength and that E
G
is the energy band gap
of the bulk semiconductor, n
x
,n
y
,n
z
are quantum numbers to describe a given quantized energy level. Equation 1
shows that the effective energy band-gap of the quantum dot increases as the quantum dot dimension decreases
(Fig. 2). When the dot is spherical with a diameter d, the transition energy scales with a 1/d
2
law. More accurate
calculations show that the scaling law does not follow an exact power 2 law but instead the exponent is lower [2]. A
value of 1.7-1.8 seems to be more appropriate.
Figure 2. Optical gap in Si quantum wells, wires, and dots versus system diameter. The transition energy is
calculated for the lowest electron and heavy hole energies for infinite confining potentials. From [3].
The assumption of having an infinite potential barrier is very crude since Si-nc are usually formed in a dielectric
matrix. The matrix is usually a silica glass SiO
2
but more recently the use of Al
2
O
3
, Si
3
N
4
or of oxynitride (SiON) is
emerging as an alternative. Also the effective mass approximation has strong limitation since the reconstruction of
the lattice in the dots caused by the strain and the different elastic properties of the host should be considered.
- 3 -
Finally, chemical bonds among the surface Si atoms of the Si-nc and the atoms of the host, strongly modify the
energy spectrum of Si-nc. An example of a theoretical calculation is shown in Fig. 3.
Fig 3. (a) Electronic energy gap as a function of the number of Si atoms for different bond configurations. (b)
Electronic energy gap as a function of the number of Si=O double bonds at the cluster surface. Circles: Si
10
H
n
=O
m
,
squares: Si
14
H
n
=O
m
, and triangles:Si
35
H
n
=O
m
. After [4].
In addition to the variation of the energy spectrum, also the wavefunctions of the electron and of the hole are
influenced by the quantum confinement in the dot. Overlap of the wavefunctions in real space and spreading of
them in the k-space causes an increase in the optical transition probability (Fig. 4).
Figure 4. Spread of the electron and hole wavefunction in a quantum dot (left) and calculated radiative lifetime
versus size for silicon quantum dots (right). The line corresponds to phonon-assisted recombination and the points
to phonon-less recombination. After [5].
A quite indirect effect of the reduced dimensionality of Si-nc is the reduction of the effective refractive index
n of the
composite matrix where the Si-nc are formed. Indeed in a simple scheme one can consider that the refractive index
is an average of the refractive index of Si-nc and of the host matrix. Thus, a composite layer formed by Si-nc with a
large refractive index of 3.5 dispersed in a matrix such as SiO
2
with a refractive index of 1.45 has a smaller
refractive index than bulk silicon. The exact value depends on the Si-content in the film and on the composition of
the host dielectrics. A simple approximation is usually used, the Bruggeman approximation [6], where it is assumed
that small particles of silicon are dispersed in an host of dielectric function
ε
M
:
(1 ) 0
22
eff M eff
eff M eff
ff
εε ε ε
εε ε ε
−−
+
−=
++
, (2)
- 4 -
f is the volumetric fraction of Si and ε is its dielectric function. With this formula
eff
n
ε
=
can be calculated. The
reduction in the refractive index has a positive influence when the Si-nc are used to enhance the emission
efficiency of silicon. In fact, the extraction efficiency of light from a material depends on its refractive index: the
smaller
n is the larger is the light gathered.
Figure 5.
Silicon nanocrystal fabrication techniques. The three lower techniques produce Si-nc in a SiO
2
matrix. After [7].
Various ways have been used in the past to form low dimensional silicon (Fig. 5). We can divide them into three
main approaches: 1. direct synthesis of silicon cluster, 2. formation of a silicon rich layer and subsequent thermal
induced phase separation and 3. electrochemical erosion of bulk silicon.
2.1 DIRECT SYNTHESIS OF SILICON CLUSTERS
Silicon nanoclusters can be directly synthesized by chemical reactions of suitable reactants. Methods of synthesis
of Si colloids include pyrolysis of Si
2
H
6
[8], formation by laser induced plasma in SiH
4
[9], combustion of SiH
4
[10],
gas evaporation of Si [11] and controlled nucleation inside inverse micelles [12].The end product is a colloidal
suspension of Si-nc in a solvent which usually is ethanol.
Another way is to deposit Si-nc on a substrate after their formation in a molecular beam [13]. Within this approach
one can also mass filter the cluster in the cluster beam by time of flight methods which ends-up with a size
selection of the clusters. However during the deposition it is not clear whether the cluster remains isolated or
collapses with the formation of large amass of Si-nc
2.2 SILICON CLUSTERS PRODUCED BY PHASE SEPARATION
The formation of Si-nc by phase separation of a silicon rich dielectrics is the most widely used approach. Various
techniques have been employed to form the sub-stoichiometric dielectric: ion implantation, plasma or low-pressure
chemical vapour deposition(PE-CVD or LP-CVD), sputtering, and silicon evaporation. The differences among
them are related to the degree of purity of the film (better for ion implanted samples), to the degree of defects
incorporated, to the porosity of the deposited films (which is known is greater for the sputtered samples), to the
control of the Si-nc content profile (better for the CVD films). After deposition the films are thermally treated at high
temperature to induce the phase separation between silicon and the dielectrics. At the used temperatures, silicon
diffusivity is large enough to cause clustering but it is small enough to avoid significant bulk reconstruction. This
balance is clearly dependent on the annealing temperature. For example if SiO
2
is used as the dielectric, typical
temperatures for the formation of Si-nc are between 900 – 1200
o
C. At the lower temperatures the Si-nc do not
crystallize. Temperatures larger than 1000
o
C are necessary to form small crystallites [14].
Figure 6 reports the evolution of the crystalline fraction as a function of the annealing temperature. While the Si-nc
gets more crystalline, their size increases but their density stays almost constant. Only at the highest temperatures
collapse among Si-nc occurs and the density decreases. The phase separation is not complete, which means that
the density of Si-nc is lower than the number which results by taking into account all the excess silicon deposited in
- 5 -
the film. This in turn means that the host is not formed by pure SiO
2
but by either a SiO
x
or by a composite oxide
with a larger Si content near the Si-nc [15].
Figure 6. (a) Crystalline fraction (obtained from the comparison of energy filtered TEM and standard TEM), (b)
density of Si-nc (obtained from EFTEM images), (c) concentration of clustered Si atoms and (d) density of
amorphous (na) and crystalline (nc) Si-nc, as a function of the annealing temperature. The lines are drawn to guide
the eye. From [14].
Figure 7 (left) Fabrication of amorphous SiO/SiO
2
superlattice and thermally induced phase separation and
crystallization. (right) Cross-sectional transmission electron microscope image of layer-arranged Si crystals (3 nm)
closely separated by oxide. After [17].
- 6 -
The main problem related to these techniques of fabrication is the lack of control on the size dispersion of the
Si-nc: large dispersion of sizes, larger than 25%, is usually obtained. Recently a method to avoid this dispersion
has been proposed [16]. By depositing controlled thicknesses of Si rich amorphous silica layers separeted by pure
silica layers, and by subsequent annealing treatments, Si-nc are formed whose size is fixed by the initial thickness
of the Si-rich silica layers.
2.3
ELECTROCHEMICAL ETCHING OF SILICON
In 1990 a paper boosted the research on low dimensional silicon [18]. This paper reported on intense
room-temperature visible luminescence from porous silicon (PS) due to quantum confinement effects. Porous
silicon is obtained by the electrochemical etching of silicon in an HF rich electrolyte [19]. Following the partial wafer
dissolution a porous structure is formed where the silicon skeleton is composed either by interconnected Si-nc or
by thin silicon wires. What is astonishing in this processing is the fact that the etching process is self-regulated:
once the porous layer is formed no further etching of the porous layer occurs. The reason for this is the depletion of
holes in the etched region of the samples. In fact holes need to be exchanged with the electrolyte to achieve
dissolution of Silicon. For this reason the process is performed in the dark for p-type silicon while it needs
illumination for n-type silicon (Fig. 8). Care has to be taken to limit the anodic current to values lower than the
electropolishing current, above which electropolishing of the silicon occurs and the final layer has a mirror-like
aspect without any porous silicon on it.
Figure 8. Typical I-V characteristics of an electrochemical cell for porous silicon fabrication. The hashed region
corresponds to the useful regime where porous silicon can be achieved, assuming the I-V characteristic marked
with hollow circles. In the anodic regime, the characteristics of a cell with n-type Si will lay in the region bounded by
the characteristic in dark (dashed line) and in full light (hollow circles).
Figure 9. Examples of PS structures: microporous (left), mesoporous (center) and macroporous (right).
- 7 -
The current as well as the doping of the wafer control the size of the pores, and in turn the size of the low
dimensional silicon in the silicon skeleton. The higher is the wafer resistivity the smaller the Si-nc sizes. A rough
measure of the Si-nc size is given by the porosity of the layers: porosity is defined as the void density in the film.
An increase of results in a
Porosity Etching rate Electropolishing threshold
HF concentration decrease decrease increase
Current density increase increase -
Anodization time increase almost constant -
Temperature - - increase
Wafer doping
(p-type)
decrease increase increase
Wafer doping
(n-type)
increase increase -
Table 1. Effect of anodization parameters on PS formation. As an approximate rule of thumb, the etch rate is of the
order of 1 nm/s for each mA/cm
2
of the anodization current density.
The porous structure of porous silicon has very appealing properties of being very sensitive to the environment. In
fact porous silicon is used to form the active material of gas and bio sensor [20].This sensitivity to the ambient is
also the main limitation of porous silicon because it causes time dependent properties (ageing effects).
In addition, by suitable techniques, it is possible to form colloidal suspension of Si-nc by crumbling it into small
particles. Si nanocrystal solutions have been obtained by sonication of p-Si in acetonitrile and toluene, in acetone
and other solvents. For
in vivo applications, however, it would be much more interesting to prepare Si-nc in water
since most of their biological applications occur in aqueous environment. A simple sonication of naturally oxidized
porous layer is shown to produce colloidal suspension in water [21].
3. OPTICAL PROPERTIES OF LOW DIMENSIONAL SILICON
The first motivation to the study of silicon nanocrystals was the hope to get luminescent silicon. In fact silicon has
an indirect band-gap which causes a very long radiative lifetime (ms) for excited electron-hole pairs. Competing
non-radiative recombinations prevail and cause most of the excited electron-hole pairs to recombine non
radiatively. In addition, when the number of excited electron-holes increases other non-radiative recombination
processes start to play a role. These are Auger recombinations and free carrier absorption. In Auger an
electro-hole pair recombines giving the excess energy to a third particle (electron or hole); free carrier absorption is
a process for which the photon is absorbed by free carriers via an intra-band optical transition. Both are dependent
on the density of excess free carriers and dominate the recombinations for heavily excited or doped silicon [22].
Figure 10. Schematic diagram of silicon nanocrystals in an amorphous matrix. Electron-hole pairs (dots) are locally
excited: if the nanocrystal has a recombination centre (star), the electron and hole recombine non-radiatively. If the
nanocrystal is free of recombination centres, the electron and hole recombine radiatively. The system shown in the
figure has three electron-hole pairs excited of which one recombines non-radiatively and two radiatively, i. e. the
internal quantum efficiency of this system is 2/3 ~ 67%.
- 8 -
The hope in using nanocrystals was to increase the radiative recombination rate by exploiting quantum
confinement. However another effect improved the emission efficiency of Si-nc. This is the spatial localization of
excited electron-hole in a small region of the sample. If this region has a killer centre, the nanocrystal is dark. On
the contrary if it is free of killer centres, the nanocrystal is bright and the excited electron-hole recombine radiatively,
even though with a long lifetime. In this case the system has locally an internal quantum efficiency of 100%. This is
shown in Fig. 10.
3.1 LUMINESCENCE
Room temperature emission in Si-nc is routinely observed independently on the preparation method. The emission
is usually characterized by a first band centred at about 500 nm whose position is independent on the processing
parameters used to form the Si-nc and a second band in the wavelength range 600-900 nm whose exact spectral
position depends strongly on the process parameters (Fig. 11). The first band is defect related and can be
quenched by post-growth passivation with hydrogen. It is absent in sample of high quality. The second band is
related to the presence of the Si-nc: when the Si-nc size decreases due to a low Si-content in the deposited film or
to a low annealing temperature treatments the emission band shifts to the blue. On the contrary for high Si-content
in the film or high annealing temperature the emission band shows a red-shift.
Figure 11. Schematic diagram of a Si-nc (left) and of the corresponding emission spectrum (right). The influence of
the various processing parameters on the emission spectrum is shown by the arrows.
Figure 12. The resonant luminescence spectrum of naturally (a) and heavily oxidized (b) porous silicon. The
arrows show the energy position of Si TA and TO momentum-conserving phonons with respect to the triplet
exciton grounds state. From [23].
- 9 -
The exact origin of the emission is not clear. Certainly quantum confinement effects are playing a crucial role.
However the role of the surface cannot be discarded. As we show in Fig. 11, the structure of the Si-nc is formed by
three regions: the central region made of amorphous or crystalline silicon, the interface region made of
substoichiometric and stressed silica and the embedding amorphous dielectric [15]. Resonant photoluminescence
experiments have shown a structured emission spectrum which is interpreted in term of crystalline Silicon phonon
assisted recombinations (Fig. 12). These data are interpreted in the frame of a pure quantum confinement process.
Other experiments have shown that the emission is strongly dependent on the exposure to ambient oxygen which
seems to support a key role played by silicon-oxygen bond in the emission processes (Fig. 13). The most
reasonable conclusion is that both mechanisms are co-present in Si-nc.
Figure 13. Measured photoluminescence spectra in various porous silicon samples before (left) and after (middle)
exposure to oxygen air. The samples are labelled according to their emission wavelength. The average Si-nc size
decreases from 4 nm (red) to < 2 nm (blue). Calculated conduction band and valence band energy levels (right) for
H-passivated Si-nc and calculated energy levels associated with a trapped electron and a trapped hole at a Si=O
bond at the Si-nc surface. As the size decreases the band-gap increases by quantum confinement and the Si=O
levels appear in the band-gap. Zone I, Zone II and Zone III mark the region where the Si-nc emission is
predominantly band-to-band (Zone I), involves a trapped electron (Zone II) or involves a trapped electron and a
trapped hole (Zone III). After [24].
3.2 ELECTROLUMINESCENCE
From a device point of view, photoluminescence is interesting but much more appealing is electroluminescence
where light is generated by current injection into the Si-nc [25]. Here the problem is tough since carriers have to
pass through a dielectric to excite the Si-nc. Indeed in most of the reported device the electroluminescence is
produced either by black-body radiation (the electrical power is converted into heat which raises the sample
temperature which, in turn, radiates) or by impact excitation of electron-hole pairs in the Si-nc by energetic
electrons which tunnel through the dielectric by a Fowler-Nordheim process (see Fig. 14).
Electron-hole pairs excited in this way recombine radiatively with an emission spectrum which is very similar to that
obtained by photo-luminescence. Fowler-Nordheim tunnelling has very peculiar characteristics, such as a squared
dependence of the current on the voltage. The problem with this kind of excitation mechanism is its inefficiency and
the damage it induces in the oxide due to the energetic electron flow. LED based on such a unipolar injection
mechanism were reported with low external efficiency of 0.1% and low turn on voltage of 5 V when the overall
thickness of the active layer is lower than 25 nm [26].
However, to get high electroluminescence efficiency one should try to get bipolar injection. What most impedes
this is the fact that the effective barrier for tunnelling of electrons is much smaller that the one for holes. That such
separate tunnelling of electrons and holes is possible is well known in the literature (see e. g. [27] and reference
therein) and has been proved also in the recent paper [28]. Here by the use of a single layer of Si-nc formed in a
very thin gate of a FET transistors, bipolar injection has been achieved by changing the sign of the gate voltage
- 10 -
(Fig. 15). When the voltage is positive electrons are tunnelling into the Si-nc, when the gate is negative holes are
tunnelling into the Si-nc. By periodically changing the gate voltage the Si-nc are filled by electrons and holes and
electroluminescence occurs. After each switching of the gate voltage, electroluminescence goes to a maximum
and then decays as the other sign charge carriers are consumed.
Figure 14. Schematic view of the process of generation of electron-hole pairs in silicon nanocrystals by impact
excitation. Here an energetic electron tunnel trough the oxide under a strong electric field. When in the Si-nc, it
losses energy by exciting an electron-hole pair. Then it tunnels again in another Si-nc driven by the high field
strength. The impact-excited electron-hole pair in the Si-nc may then recombine radiatively.
Figure 15 Schematic of the field-effect electroluminescence mechanism in a silicon nanocrystal floating-gate
transistor structure. Inset band diagrams depict the relevant tunnelling processes. a–c, The array of silicon
nanocrystals embedded in the gate oxide of the transistor can be sequentially charged with electrons (a) by
Fowler-Nordheim tunnelling, and holes (b) via Coulomb field enhanced Fowler–Nordheim tunnelling to prepare
excitons that radiatively recombine (c). From Ref. [28]
- 11 -
Recently, a breaktrough of 1.6 % external quantum efficiency in Si-nc LED has been reported [29]. The idea was to
decrease the tunneling barrier by replacing SiO
2
by Si
3
N
4
and to block one charge carrier in the active region by
using a suitable material on top of the diode, in this work amorphous SiC was used.
3.3
ABSORPTION AND REFRACTIVE INDEX
In order to exploit the optical properties of Si-nc in photonics another parameter of paramount importance is the
refractive index of the Si/nc rich oxide. A simple picture of it would be to assume an effective medium where the
refractive index is given by the Bruggemann formula (equation 2).
0 5 10 15 20
1.4
1.5
1.6
1.7
1.8
1.9
Thermal oxide
Fused silica
Fit
Refractive index
Si excess (at. %)
Figure 16. Refractive index of the active layer as a function of the introduced Si excess. The values obtained by
m-lines measurements at 632.8 nm have been interpolated by a polynomial fit. From Ref. [30].
However this simple scheme is valid to get a rough estimate but fails when accurate values are needed. In fact, the
embedding matrix is not simply composed by SiO
2
and the clustering of excess Si into Si-nc influences the
refractive index value. Figure 17 shows that the refractive index increases as the phase separation between silicon
and silica proceeds. In addition, nitrogen is usually found in PECVD deposited Si-nc. This causes the formation of
a silicon-oxynitride layer or of a three component matrix with Si, SiO
2
and Si
3
N
4
. The presence of nitrogen in the
film increases the refractive index of the layer significantly (See Table 2).
0 102030405060
1.46
1.48
1.50
1.52
1.54
1.56
Annealing at 900 °C
Refractive index at 632.8 nm
Annealing time (minute)
cladding
Figure 17 Samples obtained by sputtering with a Si excess = 6-7% annealing temperature 900
0
C. Refractive index
measured at 633 nm for various annealing times. Samples courtesy of Fabrice Gorbilleau (Caen).
- 12 -
Atomic Si
content
Atomic O
content
Atomic N
content
Measured
Refractive index for
a 1250
0
C annealing
Refractive index from
Bruggemann approximation
(Si at.%) (O at.%) (N at.%) Si-SiO
2
Si-SiO
2
-Si
3
N
4
46 45 9 2.00 1.91 2.00
42 48 10 1.82 1.75 1.80
39 49 12 1.66 1.64 1.66
Table 2. Atomic contents of silicon (Si), Oxygen (O) and Nitrogen (N) ( from RBS measurements), measured
refractive index at 1250
0
C annealing temperature, estimated refractive indices from Bruggemann approximation
(assuming Si-nc in SiO
2
medium or Si-nc in SiO
2
-Si
3
N
4
medium). [31]
3.4
WAVEGUIDES
The large refractive index of the Si-nc rich layer allows their use as core material in optical waveguides. Slab
waveguides are easily realized as well as channel waveguides (Fig. 18). More sophisticated designs have been
also proposed such as slot waveguides which are formed by two nearby SOI ridge waveguides and where the
space between the silicon cores is filled with the active Si-nc rich layer [32].
Figure 18. Various geometries of waveguides. The first is a planar waveguide where optical confinement is
achieved only in the vertical direction. The others are two dimensional waveguides where optical confinement is
achieved both in the vertical and in the horizontal directions.
One of the most important parameter in these waveguide is the propagation losses. Signal light which travels
trough the waveguide can loose power due to various mechanisms: direct absorption in the Si-nc, scattering due to
roughnesses at the core boundaries (both between the core/cladding interface and at the stripe edges), radiation
into the substrate, scattering due to the composite nature of the core layer. This last loss mechanism is worth some
discussion. The presence of Si-nc, while increasing the average refractive index of the core layer, causes large
local variations in the core refractive index. These variations occur on a length scale smaller than the wavelength
of the optical mode. Thus Rayleigh scattering occurs. In reality as the refractive index mismatch between Si-nc and
the dielectric is large, one has to use the complete Mie scattering theory to estimate the effect of this process on
the optical losses. Measurements on ridge waveguides formed by ion-implantation and optical lithography have
shown that at 780 nm and for sufficiently wide ridges, most of the propagation losses are due to direct absorption in
the Si-nc [30]. In fact propagation losses of 11 dB/cm have been measured which can be divided into 2 dB/cm due
to Mie scattering, 2 dB/cm due to interface scattering and 9 dB/cm to Si-nc absorption,
α. Knowing that
Si nc abs
N
α
σ
−
=
an estimate of the absorption cross section of Si-nc can be obtained:
σ
abs
=5x10
-19
cm
2
[30].
3.5 OPTICAL GAIN
Active devices, such as lasers or amplifiers, need optical gain in the active material. So the observation of optical
gain is of paramount importance. Optical gain is related to population inversion. Indeed in a simple scheme one
can write
21M em abs
gNN
σ
σ
=
−
(3)
where g
M
is the material gain,
σ
em
the emission cross section, N
2
and N
1
the excited and ground state densities of
active centres.
- 13 -
To measure optical gain, one method is to use the luminescence of Si-nc as a probe beam and look for
enhancement of it as it propagates in an optically pumped waveguide. A practical implementation of this idea is
given by the variable stripe length (VSL) method.
Figure 19 Left: schematics of the VSL method. Right, ASE versus the pumping length for two pumping powers at a
wavelength of 800 nm and for a PECVD slab waveguide. Data are from Ref. [33]
Figure 19 shows on the left the idea of the VSL method: a pump beam is used to excite through the top an active
planar waveguide, the luminescence emitted by the waveguide is travelling through a region excited where by
stimulated emission is amplified. If one changes the extent of the pumped region, one will record an exponentially
increasing luminescence signal coming out from the edge of the sample. This luminescence is due to the amplified
spontaneous emission (ASE) when optical gain is present. By modelling the system within a one dimensional
amplifier scheme, the intensity of the ASE, I
ASE
, as a function of the excited length is given by
(
)
mod
()
() 1
M
sp
ASE
J
g
Ie
g
α
Ω
Γ−
=
−
(4)
where J
sp
is the spontaneous emission intensity, Ω the collection solid angle, g
mod
the net modal gain which is
related to the material gain, g
mod
=Γg
M
-α, where Γ is the optical mode confinement factor (fraction of the optical
power carried by the optical mode which is confined in the active layer) and α the propagation losses in the
waveguide [34]. When the active layer is not excited enough, no population inversion occurs and the net modal
gain is negative: in this case I
ASE
saturates as increases. Figure 19 right side shows evidence of the two regimes:
red points refer to amplification while green points refer to absorption.
Another experiment we used to measure gain is a signal amplification experiment [35]. We used a thin layer of
Si-nc formed on a transparent quartz substrate. If one measures the transmitted intensity when the system is
optically pumped (I
ON
) subtracts the photoluminescence intensity (I
PL
) and normalizes to the incident intensity (I
o
)
one can write
()
()
exp
ON PL
QZ QZ Si nc P Si nc
O
II
TdgJd
I
α
−−
−
==−−
(5)
where α
QZ
and d
QZ
are the absorption and thickness of the quartz substrate, d
Si-nc
the thickness of the Si-nc layer
and g
Si-nc
(J
P
) the pump power density J
P
dependent gain coefficient.
Figure 20 reports the results of such an experiment. As the pumping rate is increased the transmission intensity
increases too. For J
P
=1.4 kWcm
-2
the transmitted intensity is larger than 1. This means that overall amplification of
the signal beam is achieved: the transmitted intensity is larger than the incident intensity even accounting for the
losses through the substrate [35].
A summary of the optical properties of the Si-nc system is shown in Fig. 21 where absorption, gain and
luminescence spectra are compared. It is worth noticing the large energy difference between absorption and
emission spectra: where absorption is negligible emission (either stimulated or spontaneous) is strong.
Furthermore, the gain spectrum peaks at the high energy wings of the luminescence spectrum. These data can be
- 14 -
explained with a four-level model of gain where lattice relaxation of Si=O double bonds at the interface of the Si-nc
provides the energetic for the four level model. Shifts between luminescence and gain point to a different nature of
the active centres in the two cases: either two populations of Si-nc are present in the system or interface radiative
recombination is responsible of gain and band-to-band recombination in large S-nc is responsible for
luminescence. The exact model is still under discussion in the literature.
Figure 20. Transmitted intensity as a function of the pump power density. Dark line refers to the transmission of the
sample without any pumping. The inset shows the schematic of the experiment. From [35].
Figure 21 Summary of the optical properties of Si-nc. Black curve is the absorption spectrum, red curve is the gain
spectrum, blue curve is the luminescence spectrum. Data from ref. [33].
Time resolved luminescence experiments in the waveguide geometry help to shine some further light on the
stimulated emission process in Si-nc. Figure 22 reports the results of such an experiment. When the VSL geometry
is used and one measures I
ASE
versus time one can observe that a fast lifetime (ns) is appearing under high
pumping power and at long excitation length. This fast component is superimposed to a slower one (
µs) which is
the only one remaining when either the pump power or the excitation length are decreased. This behaviour is
typical for samples which show gain. Samples which do not show gain have a different behaviour in particular
when high pump power are used the fast component is observed for both long and short excitation lengths. These
observations are due to a critical balance between stimulated emissions and non-radiative recombinations. Let us
consider the lifetime due to stimulated emission,
3
41
3
se NS
gph
R
cn
τπ
ξσ
= .
τ
se
depends on the Si-nc properties:
- 15 -
radius R
NS
, packing density ξ, emission cross section σ
g
; but also on the photon flux density n
ph
which is
propagating in the waveguide. To change the photon flux in the waveguide one has to increase the pumping rate
so that to have more emitted photons, but one has to care also about the propagation losses of the waveguide
which reduce the photon flux density and, thud, the stimulated emission probability (1/τ
se
). The competing and
power dependent non-radiative recombination mechanisms are Auger recombination and confined carrier
absorption. These processes are described by two lifetimes,
3
1
2
A
A
CN
τ
= and
3
1
2
CC
CC
CN
τ
= , respectively [22].
Both lifetimes depend on the excited carrier density in the nanocrystals (N
3
). Their probabilities can be increased
by using high pumping power but not by the photon flux in the waveguide. Optical gain can be only observed when
τ
se
<τ
A
, τ
CC
. The fast component in Fig. 22 is an evidence of stimulated emission in this sample: indeed the fast
lifetime appears when the pump power density but also the excitation length are increased and both these facts
tend to increase the photon density in the waveguide by emission and by amplification. On the others sample
which do not show optical gain we observed that the fast component was dependent only on the pump power and
not on the excitation length, that is only on the carrier density excited in the Si-nc. In this case, the fast component
was due to Auger recombinations. This explains why in the literature sometimes gain has been observed and
sometimes not. In fact, not only the properties of the Si-nc influences the stimulated emission lifetime but also the
waveguide parameters (such as losses and modal confinement) are affecting the value of τ
se
.
Figure 22 Time resolved edge emission from Si-nc waveguide in the VSL geometry. The ASE intensity as a
function of time is plotted for different excitation conditions: black line, low power density and long excitation length,
green line high pump power density and short excitation length, red line high pump power and long excitation
length. From [36].
4. COMPLEX DIELECTRIC STRUCTURES
When the dielectric function of a material is purposely varied in a periodic manner, the photon propagation
properties in the material are drastically modified. Energy regions, where photon propagation along given
directions is permitted or prohibited, appear and the system is described as a photonic crystal. However not only
periodic dielectric systems are of interest but also more complex structure where the dielectric function is varied
aperiodically or randomly. A simple system to produce these complex dielectric structures is porous silicon where
one can vary the dielectric function in one dimension by controlling local variation of the porosity [19]. In this way
1D photonic complex structures can be achieved where new phenomena on photon propagation can be observed.
In order to produce the complex dielectric structures one has to change in a controlled manner the current flow
through the sample while performing the electrochemical etching. A profile in depth of porosity is achieved, i.e. a
profile in depth of the refractive index (fig. 23).
- 16 -
0 40 80 120
1.2
1.8
2.4
Refractive index in IR (1200-2000 nm)
Current Density (mA/cm
2
)
200 s
1000 s
Other
Figure 23. Measured refractive index versus current density used to form thin layer of PS. The various points refer
to various PS thicknesses. Data are courtesy of C. J. Oton.
Multilayer dielectric filters are well know in optics [37]. An example is the dielectric Bragg mirror (DBR) where by
stacking periodically λ/4 thick dielectric layers, a high reflectivity region is obtained around λ. The number of
periods defines the reflectivity while the refractive index mismatch between each layers defines the width of the
high reflectivity region. DBR can be also described as 1D periodic photonic crystals where the high reflectivity
region is interpreted as the photonic band-gap. If one forms a defect in the periodic crystals, or, in classical optics
terms, if one forms a microcavity by using two DBR separated by a λ-thick layer, a high transmission mode
appears in the stop-band, or a propagating photon state associated with the defect resonance appears in the
photonic-band gap. This is observed in the transmission spectra shown in Fig. 24 as a high transmission peak in
the 1d photonic crystal band-gap [38]. One can also notice, in the high resolution spectrum of Fig 24b, the high
quality of the structure since we got a Q-factor of 3380 which is extremely high for a microcavity based on a porous
material where Rayleigh light scattering causes optical losses of 100 cm
-1
at 1.55 µm. In the same figure, we
compare the results with calculation made by using a transfer matrix method [39]. The extremely good agreement
between calculations and measurements is important to validate the dielectric stack parameters (refractive index
and thickness of each layer) used in the calculations. In this way we can use the transfer materix method also to
calculate the optical field inside the structures.
1554 1556 1558 1560 1562 1564
0.0
0.1
0.2
0.3
0.4
0.5
(b)
FWHM = 0.46 nm
Q = 3380
HI-RES experiment
simulation
Transmission
Wavelength (nm)
900 1200 1500 1800 2100 2400
0.0
0.2
0.4
0.6
0.8
1.0
(a)
experiment
simulation
Transmission
Figure 24 Transmission spectra of a single λ-thick microcavity: solid dots are the experimental data and the lines
are the simulations. (a) Measurements with 1 mm spot in a wide wavelength range, (b) measurements with 35 µm
spot with a high resolution (HI-RES) tuneable laser source. From [38]
- 17 -
The controll of the ecthing process is so high that one can easily form multiple cavity layers, or in other terms
multiple defects in the photonic crystals. A SEM image of a cross section of coupled microcavity structure is shown
in Fig. 25. Optically, if the reflectivity of the central mirrors is low, the single resonances couple and a splitting of the
resonance peak in a number of peaks occur.
Figure 25 (left) cross section of a 7 coupled microcavity structure made in Porous silicon. After the etching of the
structure an high current pulse allows to detach the layer from the substrate so that a free standing film is obtained.
The film is then glued onto a plastic holder to allow handling of the sample. (Right) Optical photograph of a free
standing microcavity. From [38].
1500 1520 1540 1560 1580 1600 1620
0.0
0.1
0.2
0.3
0.4
0.5
0.6
simulation
HI-RES
experiment
Transmission
Wavelength (nm)
1200 1400 1600 1800 2000
0.0
0.1
0.2
0.3
0.4
0.5
0.6
0.7
0.8
0.9
1.0
(b)
(a)
experiment
simulation
Transmission
Figure 26. (left) Transmission spectra of a ten coupled microcavity structure, with λ/2-thick cavities sandwiched
between 4.5-period external DBRs (dots) and numerical calculations (lines). (a) Wide range measurements with
1mm spot size, (b) HI-RES measurement with 35 µm diameter spot. From [38]. (right) Results of a transfer matrix
calculations of the scattering state electric field associated with the coupled microcavity structure.
This is observed in Fig. 26 where the transmission of a 10 coupled cavity sample is reported. In the wide stop band
region a transmission band forms (Fig. 26 a). A high resolution spectrum of the sample shows that this band has
high transmission and that it is split in a number of nearby peaks: one for each cavity. Also for this sample, the
agreement between calculations and experimental data is remarkably good. We used the same parameters to get
the optical mode intensity map inside the sample. This is shown in Fig 26 right for a wavelength region inside the
photonic band-gap region [40]. It is observed that a band of photonic coupled states forms inside the photonic
band-gap. Photons can propagate through the stop band due to the presence of coupled resonances. It is very
Log(|E| )
2
W
avelength [nm]
- 18 -
interesting to compare these systems: single microcavity and multiple coupled microcavities, with their electronic
counterpart: single isolated quantum well and superlattices. In both case the presence of a layer within barrier
materials (DRB in the photonic case, high band-gap material in the electronic case) cause the appearance of a
state in an otherwise forbidden energy region. In both case if one stacks more cavities/wells coupling of the single
states occurs and a miniband is formed where particles can freely move. For this reason, we call the coupled
microcavity system optical superlattice. If one uses this analogy further, it is tempting to try to reproduce optically
electrical phenomena. The key ingredient will be to develop the optical analogue of an electric field: i. e. an external
means to tilt the energy band of the optical superlattice. To this aim we notice that the resonance wavelength
position is given by λ=nd=δ so if one change n or d or both through the structure one is able to change locally the
resonance wavelength. If the optical path δ is increased/decreased linearly then,
λ
λδ δ
+
∆= +∆
which ends with
the tilting of the optical superlattice miniband [41]. We call ∆δ the optical path gradient. This simple reasoning is
confirmed by the calculation of the optical superlattice with a gradient. This is shown in Fig. 27, where an optical
gradient of 14% induces a significant tilting of the photonic structures.
b)
depth in the sample [ m]µ
log(|E(z)| )
2
wavenumber [cm ]
-1
10
4
3
Figure 27 Transfer matrix calculations of an optical superlattice with a 14% optical path gradient applied along the
sample. The lines show the tilting in the photonic gap structures. It is worth noting that the effect of the applied
optical path gradient causes the formation of a Wannier Stark ladder of photonic states inside the photonic band
gap. From [41].
01234
0
4x10
-5
8x10
-5
Time [ps]
14% gradient
0
2x10
-3
3x10
-3
10% gradient
0
7x10
-3
1x10
-2
Transmitted Intensity [a.u.]
Oscillation period T
B
8% gradient
0.0
0.5
1.0
Reference pulse,
no sample
Figure 28. Time resolved transmitted intensity of a short photon pulse through a biased optical superlattice. The
different panels refer to different samples with an increasing value of the optical path gradient. Note the drop in the
transmitted intensity as the gradient increases, which is an evidence of the increased localization of the photons
inside the tilted superlattice. The photons get Bragg reflected inside a thinner region as the gradient increases and
hence the tilting of the miniband increases. This is also observed in a decrease of the Bloch oscillation periods.
From Ref. [41]
- 19 -
In the first paper about electronic superlattice, it was suggested that the demonstration of the formation of a
miniband of electronic state was the observation of electronic Bloch oscillations [42]. These are due to the fact that
when an electron is accelerated by a static electric field it increases energy up to the band edge where is Bragg
reflected back. So in presence of a static electric field, the electron starts to oscillate back and forth. A static bias
produces an oscillating current. It is very difficult to observe Bloch oscillations in a bulk material due to the
high-energy bandwidth of the conduction bands. The situation is more favourable in a superlattice where the
folding of the Brilluoin zone causes the formation of minibands few hundreds of meV wide. This phenomenon
predicted in the middle seventies has been observed only at the beginning of the nineties due to the small coherent
time of carriers in semiconductors [43]. Photons have the advantage of longer coherent times. The possibility of
tilting the photonic miniband in an optical superlattice makes possible the observation of Bloch oscillations. Pho-
tons are Bragg reflected by the tilted miniband edges which is observed as the appearance of a train of pulses
when a short pulse is injected into the photonic structures. Figure 27 reports the first measurements of this os-
cillating light produced by a single incoming pulse [41].
Figure 29 Transfer matrix calculations of the intensity distribution of the light inside the sample. The intensity is
plotted as a colour scale versus the normalized frequency
ω
0
and depth inside the sample, with
ω
0
=192.3 THz. (a)
Flat miniband situation, ∆δ=0%, (b) optical Wannier Stark ladder, ∆δ= 6.7%, (c) resonant Zener tunnelling
(ZT), ∆δ= 10.3%. The calculated transmission spectra are shown in the right panels (a slight offset of 0.27% is
used to allow for the use of a logarithmic scale). The blueshift of the spectral features with increasing gradient is
due to the reduced optical thickness of the layers. From [40].
The anlogy between electrons and photons can be tested even further if one considers now the effect of a bias
(optical path drift) on a two miniband optical superlattices (Fig. 29, which reports calculations). For zero bias, the
photonic structure is characterized by two minibands of propagating states. A transmission experiment will
measure two transmission bands in the photonic band-gap. If one starts to bias the optical superlattice (increase
the optical path gradient) a ladder of localized photonic states appears (Fig. 29b). A transmission experiment will
measure a drastic drop in the transmission with the appearance of a serie of equally spaced weak peaks. This
spectrum reflects the lack of propagating states in the structure. If the bias is increases even further the first
Wannier Stark ladder state of one miniband resonantly coulpes with the last Wannier Stark state of the other
miniband. This coupling causes the formation of an extended state trough the whole structure and photons can
- 20 -
tunnel through the sample. Indeed transmission experiments show that a strong peak appears. This fact is a
manifestation of the resonant photonic Zener tunneling. The electronic counterpart of this phenomenon is the
Zener tuneling of the electrons in a biased superlattice or, more lousy, the Zener tunneling of electrons from the
valence band to the conduction band in a reverse biased diode in breakdown.
Figure 30 Transmission spectra of the optical superlattices: (a) flat band situation ∆δ = 0%, (b) ∆δ = 6.7%, (c) ∆δ =
10.3%, (d) ∆δ =18%. (e)–(h ) A zoom of the wide range spectra around the miniband region. Resonant Zener tun-
nelling is observed in (c) and (g ) as an enhanced transmission peak in the centre of the minigap. From [40].
The experimental evidence of Zener tunneling is shown in Fig. 30. The various pannels refer to different applied
bias (optical path gradient). For no bias, the transmission spectrum shows two transmission band, when bias is
applied the transmission drops due to the formation of localized Wannier Stark ladder states. For a critical bias
value a resonant coupling (Zener tunneling) between Wannier Stark states occurs and a strong Zener tunneling
peak appears. As the bias is increased further, the coupling is removed and the transmission drops again. If we
plot the transmission intensity at the resonat wavelength as a function of the optical path gradient value, a plot
similar to an I-V characteristics of an inversed biased diode in breakdown is observed (Fig. 31).
0 5 10 15 20
0
2
4
6
8
10
Experiment
Theory
Gradient [%]
Transmission intensity (%)
I
V
Figure 30. Transmission intensity at the resonant wavelength as a function of the optical path gradient for an
optical superlattice. At a critical gradient value a strong increase is observed. Points are experimental data, line is
a numerical calculation. The inset shows qualitatively the I-V charcteristic of a reverse biased diode. From [40].
- 21 -
5. CONCLUSION
In this review I have shown some of the many applications of Si-nc in photonics. Both quantum size effects, the
new chemestry which occurs at the Si-nc sruface, the tunability of the dielectric functions by changing the
composition of the systems, all allows to generate new phenomena which can be eventually used to add new
functionalities to silicon.
I acknowledge the help of many co-workers both from my resarch group and from international collaboration. They
can be recognized in the cited literature The research here discussed has been made possible by and the financial
support of many programs: from EC the research program SINERGIA, SEMINANO, PHOLOGIC, from MIUR
through FIRB (RBNE01P4JF and BNE012N3X) and COFIN (2004023725) projects and by PAT through PROFILL
project.
REFERENCES
[1] Silicon Photonics, edited by Lorenzo Pavesi and David Lockwood, Topics in Applied Physics vol. 94
(Springer-Verlag, Berlin 2004)
[2] Stefano Ossicini, Lorenzo Pavesi, Francesco Priolo, Light Emitting Silicon for Microphotonics, Springer Tracts
in Modern Physics , Vol. 194 (Springer-Verlag, Berlin 2003]
[3] D. J. Lockwood, G.C. Aers, L. B. Allard, B. Bryskiewicz, S. Charbonneau, D.C. Houghton, J.P. McCaffrey,
A.Wang: Can. J. Phys.
70, 1184 (1992)
[4] M. Luppi, S. Ossicini, J. Appl. Phys.
94 (2003) 2130
[5] M. S. Hybertsen: Phys. Rev. Lett.
72, 1514 (1994)
[6] W. Theiβ, Surf. Sci. Rep.
29 91 (1997)
[7] J. Linnros: Silicon Based Microphotonics: from Basics to Applications, ed. By O. Bisi, S.U. Campisano, L.
Pavesi, F. Priolo (IOS Press, Amsterdam 1999), pp. 47–86
[8] Littau, K. A., P. J. Szajowski, A. J. Muller, A. R. Kortan & L. E. Brus,
.J. Phys. Chem. 97, 1224 (1993)
[9] Fojtik A., M. Giersig & A. Henglein, Ber. Buns. Phys. Chem.
97, 1493 (1993).
[10] Fojtik, A. & A. Henglein, Chem. Phys. Lett.
221, 363 (1994).
[11] Iwasaki, S.; T. Ida, & K. Kimura, Jpn. J. Appl. Phys.
35, L551 (1996).
[12] Wilcoxon, J. P.; G. A. Samara & P. N. Provencio, Phys. Rev. B
60, 2704 (1996).
[13] Leduox, G.; O. Guillois, D. Porterat, C. Reynaud, F. Huisken, B. Kohn, & V. Paillard, Phys. Rev. B
62, 15942
(2000).
[14] Fabio Iacona, Corrado Bongiorno, and Corrado Spinella, Simona Boninelli and Francesco Priolo, J. Appl.
Phys.
95, 37231 (2004).
[15] N. Daldosso, M. Luppi, S. Ossicini, E. Degoli, R. Magri, G. Dalba, P. Fornasini, R. Grisenti, F. Rocca, L.
Pavesi, S. Boninelli, F. Priolo, C.Bongiorno, and F. Iacona, Phys. Rev. B
68, 085327 (2003).
[16] M. Zacharias, J. Heitmann, R. Scholz, U. Kahler, M. Schmidt, and J. Bläsing, Appl. Phys. Lett.
80, 661 (2002).
[17] M. Zacharias, L.X. Yi, J. Heitmann, R. Scholz, M. Reiche, U. Gösele, Solid State Phenomena
94, 95 (2003).
[18] L. T. Canham, Appl. Phys. Lett.
57 (10), 1046 (1990).
[19] O. Bisi, S. Ossicini and L. Pavesi, Surface Science Reports
264, 1-126 (2000).
[20] L. Pancheri, C. J. Oton, Z. Gaburro, G. Soncini, L. Pavesi, Sensors and Actuators B
98 237-239 (2003).
[21] Elena Froner,
Roberta Adamo, Zeno Gaburro, Benno Margesin, Lorenzo Pavesi, Adelio Rigo, Marina Scarpa
J. Nanoparticle Res. (2006).
[22] L. Pavesi, Materials Today
8(1) (January 2005) pag. 18-25.
[23] D. Kovalev D. Kovalev, H. Heckler, G. Polisski, and F. Koch phys. stat. sol. (b)
215, 871 (1999)
[24] M. Wolkin et al., Phys. Rev. Lett.
82, 187 (1999).
[25] Z. Gaburro and L. Pavesi, “Light emitting diodes for Si integrated circuits”, in Handbook of Luminescence,
Display Materials and Devices, vol 3. Display devices, edited by H. S. Nalwa and Lauren Shea Rohwer (American
Scientific Publishers, Stevenson Ranch, USA 2003) pag. 101
[26] F. Iacona et al. Appl. Phys. A: Mater. Sci. Process.
A74, 1 2002
[27] J. Cai and C T. Sah, J. Appl. Phys.
89 (2001) p.2272
[28] R. J. Walters, G. I. Bourianoff, H. A. Atwater Nature Materials
4, 143 (2005)
[29] Kwam Sik Cho, Nae-Man Park, Tae-Youb Kim, Kyung-Hyun Kim, Gun Yong Sung, and Jung H. Shin, Appl.
Phys. Lett.
86, 071909 (2005).
[30] P. Pellegrino, B. Garrido, C. Garcia, J. Arbiol, J.R. Morante, M. Melchiorri, N. Daldosso, L. Pavesi, E. Schedi
and G. Sarrabayrouse, J. Appl. Phys.
97, 074312 (2005)
- 22 -
[31] G. Vijaya Prakash, M. Cazzanelli, Z. Gaburro, L. Pavesi, F. Iacona, G. Franzò and F. Priolo, J. Mod. Opt.
49,
719 (2002).
[32] V.R. Almeida, Xu Qianfan, C.A. Barrios, M. Lipson, Optics Letters
29, 1209 (2004).
[33] L. Dal Negro, M. Cazzanelli, N.Daldosso, Z.Gaburro, L. Pavesi, F. Priolo, D. Pacifici, G. Franzò and F. Iacona,
Physica E
16, 297 (2003)
[34] L. Dal Negro, P. Bettotti, M. Cazzanelli, L. Pavesi, D. Pacifici, Optics Communications
229, 337 (2003)
[35] L. Dal Negro, M. Cazzanelli, B. Danese, L. Pavesi, F. Iacona, G. Franzò and F. Priolo, J. Appl. Phys.
96, 5747
(2004)
[36] L. Dal Negro, M. Cazzanelli, L. Pavesi, S. Ossicini, D. Pacifici, G. Franzò, F. Priolo and F. Iacona, Appl. Phys.
Lett.
82, 4636 (2003)
[37] M. Born and E. Wolf, Principles of Optics Cambridge University Press, Cambridge, UK, 1980.
[38] M. Ghulinyan, C. J. Oton, G. Bonetti, Z. Gaburro, L. Pavesi, J. Appl. Phys.
93, 9724 (2003).
[39] C. J. Oton, L. Dal Negro, P. Bettotti, L. Pancheri, Z. Gaburro, and L. Pavesi, in Radiation—Matter Interaction in
Confined Systems, edited by L. C. Andreani, G. Benedek, and E. Molinari, Società Italiana di Fisica, Bologna, 2002,
p. 303.
[40] M. Ghulinyan, C. J. Oton, Z. Gaburro, L. Pavesi, C. Toninnelli and Diederik Wiersma, Phys. Rev. Lett. 94,
127401 (2005).
[41] Riccardo Sapienza, Paola Costantino, Diederik Wiersma, Mher Ghulinyan, Claudio J. Oton and Lorenzo
Pavesi, Phys. Rev. Lett.
91, 263902 (2003).
[42] L. Esaki, and R. Tsu, IBM J. Res. Dev.
61, 16 (1970).
[43] J. Feldmann, et al., Phys. Rev. B
46, 7252 (1992); K. Leo, et al., Solid. State Comm. 84, 943 (1992).
- 23 -
Lorenzo Pavesi is Professor of Experimental Physics at the University of Trento (Italy). Born the 21
st
of November
1961, he received his PhD in Physics in 1990 at the Ecole Polytechnique Federale of Lausanne (Switzerland). In
1990 he became Assistant Professor, an Associate Professor in 1999 and Full Professor in 2002 at the University
of Trento. He teaches several classes both at the Science as well as at the Engineering Faculties of the University
of Trento. He founded the research activity in semiconductor optoelectronics at the University of Trento and started
several laboratories of optical spectroscopy, growth and advanced treatment of materials. During the last years, he
concentrated on Si-based optoelectronics where he has been working on porous silicon and on silicon
nanostructures. Among his most important achievements the demonstration of the first all porous silicon optical
microcavity, the fabrication of Si LED in a fully CMOS compatible environment, the first evidence of optical gain
and stimulated emission in Si quantum dot nanocrystals, the observation of photonic Bloch oscillations and Zener
tunneling. All of these results opened the way to a Si-based optoelectronics and to the future fabrication of a
Si-based laser. In silicon photonics, he is one of the worldwide recognized experts, he organized several
international conferences, workshops and schools and is a frequent invited speaker. He manages several
research projects, both national and European. He is an author or co-author of more than 250 papers, author of
several reviews, editor of 8 books, author of 1 book and holds five patents.