Báo cáo khóa học: Binding analyses between Human PPARc–LBD and ligands Surface plasmon resonance biosensor assay correlating with circular dichroic spectroscopy determination and molecular docking ppt
Bạn đang xem bản rút gọn của tài liệu. Xem và tải ngay bản đầy đủ của tài liệu tại đây (587.53 KB, 12 trang )
Binding analyses between Human PPARc–LBD and ligands
Surface plasmon resonance biosensor assay correlating with circular dichroic
spectroscopy determination and molecular docking
Changying Yu
1,2
, Lili Chen
1
, Haibing Luo
1
, Jing Chen
1
, Feng Cheng
1
, Chunshan Gui
1
, Ruihao Zhang
1
,
Jianhua Shen
1
, Kaixian Chen
1
, Hualiang Jiang
1
and Xu Shen
1
1
Drug Discovery and Design Center, State Key Laboratory of Drug Research, Shanghai Institute of Materia Medica, Shanghai
Institutes for Biological Sciences, Chinese Academy of Sciences, Shanghai, China;
2
College of Marine Life Sciences,
Ocean University of China, Qingdao, China
The binding characteristics of a series of PPARc ligands
(GW9662, GI 262570, cis-parinaric acid, 15-deoxy-D
12,14
-
prostaglandin J
2
, LY171883, indomethacin, linoleic acid,
palmitic acid and troglitazone) to human PPARc ligand
binding domain have been investigated for the first time by
using surface plasmon resonance biosensor technology, CD
spectroscopy and molecular docking simulation. The surface
plasmon resonance biosensor determined equilibrium dis-
sociation constants (K
D
values) are in agreement with the
results reported in the literature measured by other methods,
indicating that the surface plasmon resonance biosensor can
assume a direct assay method in screening new PPARc
agonists or antagonists. Conformational changes of PPARc
caused by the ligand binding were detected by CD deter-
mination. It is interesting that the thermal stability of the
receptor, reflected by the increase of the transition tem-
perature (T
m
), was enhanced by the binding of the ligands.
The increment of the transition temperature (DT
m
)of
PPARc owing to ligand binding correlated well with the
binding affinity. This finding implies that CD could possibly
be a complementary technology with which to determine the
binding affinities of ligands to PPARc. Molecular docking
simulation provided reasonable and reliable binding models
of the ligands to PPARc at the atomic level, which gave a
good explanation of the structure-binding affinity relation-
ship for the ligands interacting with PPARc.Moreover,the
predicted binding free energies for the ligands correlated well
with the binding constants measured by the surface plasmon
resonance biosensor, indicating that the docking paradigm
used in this study could possibly be employed in virtual
screening to discover new PPARc ligands, although the
docking program cannot accurately predict the absolute
ligand-PPARc binding affinity.
Keywords: PPARc; receptor binding; surface plasmon
resonance biosensor; circular dichroism spectroscopy;
molecular docking.
The peroxisome proliferator-activated receptor (PPAR)
belongs to the nuclear receptor superfamily [1] that plays
an important role in the regulation of the storage and
catabolism of dietary fats [2]. PPAR contains three
subtypes, PPARa, PPARb (alsotermedPPARd)and
PPARc.PPARc is a ligand-dependent transcription factor
influencing the adipocyte differentiation and glucose
homeostasis [3]. Binding of ligands to PPARc causes
conformational change in the receptor. Upon binding of
an agonist to PPARc, a-helices H12, H3, H4, and H5 of the
receptor form a charge clamp and a hydrophobic pocket,
which are essential for the recruitment of coactivator–
receptor complexing and the transcriptional activation of
the PPARc target genes [4,5]. It has been demonstrated that
PPARc is the receptor of the thiazolidinedione (TZD) class
of ligands [6]. Among the TZD type of anti-diabetic drugs,
rosiglitazone and troglitazone are potent adipocyte differ-
entiating agents, which activate ap2 gene expression in a
PPARc-dependent manner [7]. As PPARc ligands may
regulate the adipogenesis, they can be designed and
modified for the treatment of cardiovascular and diabetes
diseases [2]. Therefore, PPARc is an attractive target for
new drug discovery.
Ligand binding to PPARc is responsible for controlling
the biological functions, and discovering new ligands that
may modulate PPARc’s function is a major focus in the
pharmaceutical industry. Accordingly, using new technol-
ogy to measure ligand–PPARc binding is significant for
Correspondence to H. Jiang, Drug Discovery and Design Center,
State Key Laboratory of Drug Research, Shanghai Institute of
Materia Medica, Shanghai Institutes for Biological Sciences,
Chinese Academy of Sciences, 555 Zu Chong Zhi Road,
Zhangjiang Hi-Tech Park, Shanghai 201203, China.
Fax: + 86 21 50806918, Tel.: + 86 21 50807188,
E-mail: and X. Shen, address as above.
Fax: + 86 21 50807088, Tel.: + 86 21 50806600 ext. 2112;
E-mail:
Abbreviations: 15-d-PGJ
2
, 15-deoxy-D
12,14
-prostaglandin J
2
; CPA,
cis-parinaric acid; GW9662, 2-chloro-5-nitrobenzanilide; indometha-
cin, 1-(4-chlorobenzoyl)-5-methoxy-2-methyl-1H-indole-3-acetic acid;
LBD, ligand binding domain; LBP, ligand binding pocket; LY171883,
1-{2-hydroxy-3-propyl-4-[(1H-tetrazol-5-yl)butoxyl]phenyl} ethanone;
PPARc, peroxisome proliferator-activated receptor c;RU,resonance
unit; SPR, surface plasmon resonance; TZD, thiazolidinedione.
(Received 31 July 2003, revised 10 November 2003,
accepted 20 November 2003)
Eur. J. Biochem. 271, 386–397 (2004) Ó FEBS 2003 doi:10.1046/j.1432-1033.2003.03937.x
both the function study of the receptor and ligand discovery.
Numerous technologies, such as competition radioreceptor
assay [8–10], protease protection assay [11], coactivator-
dependent receptor ligand assay (CARLA) [12] and scintil-
lation proximity assay (SPA) [13], have been used to
measure the binding constants for ligand–PPARc inter-
actions and in screening of ligands. By employing these
technologies, some important parameters evaluating the
binding affinity or activity for many ligands to PPARc,such
as K
i
, K
D
,EC
50
and IC
50
, have been obtained. However,
these technologies either need specific radioligands for
labeling or the reporter gene has to be transfected in the cell
to be detected, both of which limit the screening speed for
finding new ligands, especially at the primary screening step.
Recently, the surface plasmon resonance (SPR) biosen-
sor technology has been recognized as a powerful tool
in monitoring receptor–ligand interactions with advan-
tages of no labeling, real-time and noninvasive measure-
ments [14]. This advanced technology will become a
potential secondary screening tool in drug screening. It
has been successfully used to measure the binding
interactions of small molecules to the ligand-binding
domain (LBD) of human estrogen receptor [15]. To the
best of our knowledge, there is to date no report
concerning the ligand–PPAR binding assay by using
SPR biosensor technology. Promoted by the discovery of
new PPAR agonists with the eventual aim of developing
new drugs for the treatment of type II diabetes, we are
trying to construct screening modes and corresponding
assay methods. SPR biosensor technology was used to
determine the binding affinities of PPARc ligand binding
domain (PPARc–LBD) with nine typical ligands, viz.
GI262570 [16], troglitazone [16], linoleic acid [17,18],
GW9662 [19], cis-parinaric acid [20], 15-d-PGJ
2
[17],
indomethacin [21], Palmitic acid, and LY171883 [22]
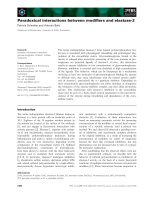
(Fig. 1). It can be demonstrated that SPR biosensor
technology can quantitatively detect the binding affinities
of the tested ligands to PPARc, and the dissociation
constants (K
D
s) measured by SPR biosensor are in
agreement with data reported in the literature.
Upon binding of ligands, great conformational changes
take place for PPARc [23]. To address the ligand binding
effect to thermal stability of PPARc, circular dichroism
(CD) spectroscopic technology was used to investigate the
conformational changes of PPARc–LBD resulted from
the ligand binding. In addition, the thermally induced
unfolding process of both apo-PPARc–LBD and its
ligand-bound complexes were also studied using CD
spectroscopy, and the transition temperature (T
m
)for
each complex was estimated from the CD responses. To
our knowledge, this is the first report of use of CD to
detect the conformational change and to monitor the T
m
of PPARc unfolding. The result indicated that the thermal
stability of PPARc–LBD enhanced by the ligand binding,
the transition temperature increments (DT
m
)ofPPARc–
LBD caused by ligand binding have a good correlation
with the binding affinities. This finding suggests that CD
canalsobeusedinstudyingligand–PPARc binding and
in screening new ligands.
To address the structure–binding affinity relationship,
molecular docking method was used to construct the
binding models of the tested ligands with PPARc–LBD.
The 3D models provided a good explanation for the
differences of the binding affinities from a structural
viewpoint. The predicted binding free energies of the ligands
to PPARc correlate well with the binding affinities derived
from the SPR biosensor determination, indicating that the
docking paradigm used in this study may be involved in
the cycle of discovering new PPARc agonists or antagonists
as virtual screening tool.
Experimental procedures
Preparation of ligand samples
The structures of the ligands used in this study are shown in
Fig. 1. Indomethacin, cis-parinaric acid and palmitic acid
were purchased from Calbiochem, 15-deoxy-D
12,14
-prota-
glandin J
2
(15-d-PGJ
2
) and linoleic acid were from Biomol
and GW9662, LY171883 and troglitazone were from
CAYMAN Chem. Co. (Ann Arbor, MI, USA). All the
other reagents were purchased from Sigma in AR grade.
GI262570 was synthesized in our laboratory by using
methods modified from Henke et al. [16] and Collins et al.
[24].
1
H NMR (400 MHz, CDCl
3
): d(p.p.m.) 8.82 (s, 1H),
8.03 (m, 2H), 7.60–7.37 (m, 10H), 7.22 (d, 2H, J ¼ 8.60Hz),
4.37(m,1H),4.16(t,2H,J ¼ 6.22 Hz), 3.20 (m, 2H), 3.00
(t, 2H, J ¼ 6.22Hz), 2.36 (s, 3H); LRESI-MS: m/e 546(M-
H)-; anal. C
30
H
30
N
2
O
5
, found: C, 74.79; H, 5.51; N, 5.07;
required: C, 74.71; H, 5.53; N, 5.12.
Fig. 1. Structures of the PPARc ligands used in this study.
Ó FEBS 2003 Binding analyses of human PPARc–LBD to ligands (Eur. J. Biochem. 271) 387
All the test compounds were dissolved in DMSO as
20 m
M
stock solutions for the Biacore and CD experiments.
Expression and purification of human PPARc ligand
binding domain (PPARc–LBD) protein
pET15b-hPPARc–LBD plasmid was kindly provided by
J. Uppenberg (Department of Structural Chemistry, Phar-
macia and Upjohn, Stockholm, Sweden). The expression
and purification of the recombinant human PPARc–LBD
in Escherichia coli were carried out by using a method
slightly modified from Uppenberg et al.[3].E. coli
BL21(DE3) cells transformed with the plasmid were grown
in LB medium containing 50 lgÆmL
)1
of ampicillin at
37 °C. The expression of PPARc–LBD was induced by the
addition of 0.2 m
M
of isopropyl b-
D
-thiogalactoside
(IPTG). After induction for 5 h at 20 °C, the cells were
harvested and disrupted by sonication against NaCl/P
i
buffer. The supernatant was applied to a Ni-nitrilotriacetic
acid column (1 mL resin), and the column was washed with
30 column volumes of loading buffer A (NaCl/P
i
containing
10 m
M
imidazole, pH 8.8) followed by 10 column volumes
of loading buffer B (NaCl/P
i
containing 25 m
M
imidazole,
pH8.8).ThePPARc–LBD protein was then eluted with
elution buffer C (NaCl/P
i
containing 500 m
M
imidazole,
pH 8.8). For the Biacore experiments, imidazole in
PPARc–LBD protein was removed by dialysis against
HBS-EP buffer (10 m
M
Hepes, 150 m
M
NaCl, 3.4 m
M
EDTA, 0.005% (v/v) surfactant P20, pH 7.4), while for
the CD experiment, imidazole in PPARc–LBD protein was
eradicated by dialysis against CD buffer (20 m
M
sodium
phosphate, pH 7.4). The PPARc–LBD protein sample was
concentrated by using Centriprep and Centricon concen-
trators. Any insoluble materials in the protein were removed
by filtration. The concentration of protein was deter-
mined from its molar extinction coefficient of e
280
¼
12 045
M
)1
Æcm
)1
.
Purification of PPARc–LBD/ligand complexes
To purify the PPARc–LBD/ligand complex, 20 l
M
PPARc–LBD in 1.5 mL of CD buffer was incubated with
15 lL of the ligand stock solution [20 m
M
in dimethyl
sulfoxide (DMSO)] at 4 °C for 12 h, the excessive DMSO
and the ligand compound were then removed by use of
aHiTrap
TM
Desalting column (Amersham Pharmacia
Biotech AB) with CD buffer. The PPARc–LBD/ligand
complex with desired concentration was concentrated
through a Centricon concentrator on demand.
Surface plasmon resonance (SPR) analyses
The interaction analyses between immobilized PPARc–
LBD and its ligands were performed using the dual flow cell
Biacore 3000 instrument (Biacore AB, Uppsala, Sweden).
Immobilization of the protein to the hydrophilic carboxy-
methylated dextran matrix of the sensor chip CM5 (Biacore)
was carried out by the standard primary amine coupling
reaction. The protein to be covalently bound to the matrix
was diluted in 10 m
M
sodium acetate buffer (pH 4.3) to a
final concentration of 0.35 mgÆmL
)1
. Equilibration of the
baseline was completed by a continuous flow of HBS-EP
buffer through the chip for 1–2 h. All the Biacore data were
collected at 25 °C with HBS-EP as running buffer at a
constant flow of 20 lLÆmin
)1
. All the sensorgrams were
processed by using automatic correction for nonspecific
bulk refractive index effects. All the equilibrium constants
(K
D
s) evaluating the protein–ligand binding affinity were
determined by the steady state affinity fitting analysis of the
results from Biacore data. As the binding process for 15-d-
PGJ
2
is slow, its kinetic analysis of the binding to PPARc–
LBD regarding the association (k
on
) and dissociation (k
off
)
rate constants were investigated based on the 1 : 1 (Lang-
muir) binding fitting mode.
CD spectral analyses
CD spectra of PPARc–LBD and its complexes at different
temperatures were obtained by use of a JASCO 715
spectropolarimeter equipped with a Neslab water bath.
The CD spectra scans of the molar ellipticity were recorded
using an optical cell with a 0.1 cm path-length for the far-
UV region. Averages of six scans were collated. The mean
residue ellipticity of the protein was calculated using molar
concentration multiplied by the number of residues. The
ellipticities at 222 nm for PPARc–LBD and its complexes
were accumulated for analysis by
ORIGIN
7.0 (http://
www.OriginLab.com), a program that combines numerical
integration and nonlinear global fitting routines.
Molecular modeling
The 3D structures of the ligands were constructed using
standard geometric parameters of molecular modeling
software package
SYBYL
6.8 (). The
geometries of the ligands were subsequently optimized by
using the Power method encoded in
SYBYL
6.8 to a root-
mean-squared (rms) energy gradient of 0.05 kcalÆmol
)1
ÆA
˚
)1
.
Tripos force field [25] with Gasteiger–Hu
¨
ckel charges [26,27]
was employed during the ligand minimization. The protein
models were constructed according to the crystal struc-
ture of PPARc–LBD–thiazolidinedione (TZD) complex
retrieved from the Brookhaven Protein Data Bank (PDB)
[28,29], entry 2PRG [5]. The ligand-binding pocket (LBP) of
the receptor was defined as the collection of the amino acids
enclosed within a sphere of 6.5 A
˚
radius around the bound
ligand (TZD). The binding models of the ligands to the
receptor were constructed by docking the ligands into the
LBP of PPARc–LBD employing the flexible docking
program
FLEXX
[30]. During the docking simulations,
standard parameters of the
FLEXX
implemented in
SYBYL
6.8 were used. The global lowest-energy binding configur-
ation of a ligand to the protein was identified by optimizing
the rotation and translation of the ligand within the binding
pocket. Normally
FLEXX
provides more than 10 candidate
configurations; configuration corresponding to the lowest
interaction energy was selected as the final structure for
further analysis. The binding free energies of the ligands
with the receptor were predicted by using the scoring
function of
AUTODOCK
3.0 [31]. The scoring function of
AUTODOCK
was empirically calibrated at the level of binding
free energy based on the traditional molecular force field
terms, in which not only the restriction of internal rotors
depending on the number of torsion angles of the ligand, but
388 C. Yu et al. (Eur. J. Biochem. 271) Ó FEBS 2003
also on the desolvation upon binding and the hydrophobic
effect (solvent entropy changes at solute–solvent interfaces)
were calculated. Thus, this scoring function can reflect the
ligand–protein binding free energies more accurately.
All molecular modeling and docking simulations were
performed on a Silicon Graphics Origin3200 workstation
(with four CPUs).
Results
SPR determination of binding affinity
Immobilization of PPARc–LBD typically resulted in a
resonance signal at about 2000–2100 resonance units (RUs).
The binding responses in RUs were continuously recorded
and presented graphically as a function of time. The
association could be described in a simple equilibrium
(A,analyte;B,ligand;AB,complex).
A þ B Ð AB
To determine the equilibrium dissociation constant for the
interaction, the equilibrium response (R
eq
)datawerefitto
an independent-binding-site model [32]:
R
eq
¼
X
i
R
max; i
 C  K
on; i
1 þ C Â K
on;i
ð1Þ
where, R
max
stands for the maximal response, C is the
concentration of a ligand, and K
on
is the equilibrium
association constant. For a single-site interaction, i ¼ 1, for
a two-site binding, i ¼ 2, and so on. The Biacore biosensor
determination results for the binding of the ligands with
immobilized PPARc–LBD in the CM5 chip are shown in
Fig. 2. The response data indicate that, in reaching the
equilibrium, both the association and dissociation of
15-d-PGJ
2
towards the immobilized PPARc–LBD are slow
(Fig. 2A). However, the association and dissociation phases
of the other compounds were transitory, the responses reach
equilibrium towards PPARc–LBD quickly, within 2 s, and
the compounds dissociated from the protein chip surface
completelyafter5sasshowninFig.2B.
Two fitting methods are generally used in the data
analyses for slow and fast response modes, respectively. The
first fitting method is the 1 : 1 (Langmuir) binding fitting
model, in which the association rate constant (k
on
)and
dissociation rate constant (k
off
) are fitted simultaneously by
rate Equation 2,
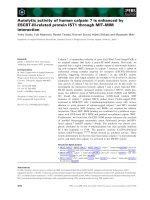
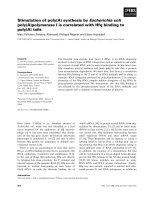
Fig. 2. Specificity of ligands binding to PPARc–LBD measured by SPR (Biacore 3000). Representative sensorgrams obtained from injections for
15-d-PGJ
2
at concentrations of 0.156, 0.312, 0.625, 1.25, 2.5, 5.0, 10.0, and 20.0 l
M
(A); for troglitazone at concentrations of 0.00977, 0.0195,
0.0391, 0.0781, 0.156, 0.625, 5.0, and 20.0 l
M
(B); for LY171883 at concentrations of 0.625, 1.25, 2.5, 5.0, 10.0, and 20.0 l
M
(C) and for GW9662 at
concentrations of 0.00977, 0.039, 0.156, 0.625, 2.5, 5.0, and 20.0 l
M
(D); over PPARc–LBD immobilized on the CM5 chip. The ligands were
injected for 120 s, and dissociation was monitored for more than 150 s.
Ó FEBS 2003 Binding analyses of human PPARc–LBD to ligands (Eur. J. Biochem. 271) 389
dR
dt
¼ k
on
 C ÂðR
max
À RÞÀk
off
 R ð2Þ
where, R represents the response unit, C is the concentra-
tion of the ligand. This fitting model is normally used in the
determination of slow binding. For the fast binding
ligands, steady state affinity fitting model has to be
employed in calculating the binding constants. Accord-
ingly, the binding kinetic constants of 15-d-PGJ
2
to
PPARc–LBD were calculated by using Equation 2. The
results are shown in Table 1. The binding constants, in
terms of K
D
, of other compounds to PPARc–LBD were
obtained employing steady state fitting methods; the steady
state plots against the concentrations of troglitazone are
shown in Fig. 3A.
For ligand LY171883, up to 20 l
M
, the response only
reached two units, as shown in Fig. 2C, and its biosensor
RU was independent of the analyte concentration.
Therefore, it can be tentatively concluded that
LY171883 did not bind or showed very weak affinity
to PPARc–LBD, at least in the present experimental
conditions. For ligand GW9662, at concentrations ranging
from 9.77 n
M
to 20 l
M
, the responses at equilibrium
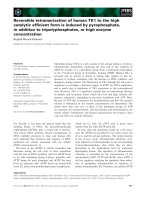
increased from approximate 0.3–17RUs (Fig. 2D). Esti-
mated from the steady state plot against the concentration
(Fig. 3B), the K
D
value of GW9662 binding to PPARc–
LBD is about 1.59 l
M
. Similar to GW9662, the K
D
values
of the remaining ligands binding to PPARc–LBD were
evaluated employing the steady state-fitting model, which
are listed in Table 2.
CD determination
Large conformational change occurs for the PPARc–LBD
when binding with ligands, especially for helix 12 (H12) [23].
To investigate the thermal properties associated with the
conformational changes caused by ligand binding and to
identify the relationship between the binding affinity and the
thermal parameter, CD spectroscopic analyses were per-
formed to both the apo-PPARc–LBD and its ligand
complexes. The CD spectroscopic data were collected at
the temperatures ranging from 4 to 90 °C. Because all the
ligands do not exhibit CD spectroscopic reflection within
far-ultraviolet wavelength (data are not shown), the CD
responses may assign to conformational change of the
protein.
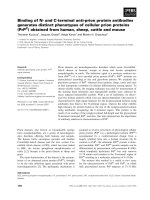
As an example, the CD spectra of PPARc–LBD in the
absence and presence of Troglitazone and GI262570 at 4,
20, 40, 60, 90 °C, and 4 °C again (cooled down to 4 °Cfrom
90 °C) are shown in Fig. 4. Similar profiles were observed
for the remaining ligands (data are not shown). Comparing
the CD features of the apo- and ligand bound PPARc–
LBDs, we can see that ligand binding indeed induced a
secondary structure change for PPARc–LBD.Thisisin
agreement with the X-ray crystallographic results [33,34],
which clearly demonstrated apo- and ligand bound PPARc–
LBDs adopted different conformational arrangements.
When comparing the CD spectra at 4 °C with those at
4 °C cooled down from 90 °C, a major difference of the CD
features is observed, suggesting that the unfolding processes
foreitherPPARc–LBD or its ligand complexes are
irreversible (Fig. 4). Corresponding to the thermally
induced unfolding processes, transition temperatures exist
between 40 and 60 °C (Fig. 4). Thermal unfolding profiles
of apo-PPARc–LBD and its complexes with the tested
ligands were obtained by monitoring the 222-nm ellipticities
(h) as functions of temperature. Dh is defined as the
ellipticity determined at a given temperature subtracting
that determined at the lowest experimental temperature
(4 °C in this study); and Dh
max
is defined as the Dh at the
highest experimental temperature (90 °C in this study). The
profiles of Dh/Dh
max
for apo-PPARc–LBD and its ligand-
bound complexes plotted against temperature are shown
in Fig. 5. The transition temperature (T
m
)valueswere
obtained by fitting Dh/Dh
max
data in
ORIGIN
7.0. The result
Table 1. The kinetic constants of 15-deoxy-D
12,14
-protaglandin J
2
(15-d-PGJ
2
)bindingtoPPARc–LBD. R
max
, maximum analyte binding capacity;
k
on
, association rate constant; k
off
: dissociation rate constant; K
D
, equilibrium dissociation constant. K
D
¼ k
off
/k
on
; v
2
statistical value in Biacore.
R
max
(RU) k
on
(
M
)1Æ
s
)1
) k
off
(s
)1
) K
D
(
M
) v
2
36.7 ± 3.06 257 ± 9.86 3.90 ± 0.074 · 10
)3
1.51 ± 0.105 · 10
)5
0.386
Fig. 3. Equilibrium data analysis of ligands binding to PPARc–LBD.
The data for the SPR sensorgrams (Fig. 2) were fitted to a single-site
interaction model. The plots of steady state RU vs. the concentrations
of troglitazone (A) and GW9662 (B), respectively, were obtained by
using a steady-state fitting model.
390 C. Yu et al. (Eur. J. Biochem. 271) Ó FEBS 2003
is listed in Table 2. The T
m
value of apo-PPARc–LBD is
% 46.14 °C, while for the ligand-bound complexes, the T
m
temperatures increased with the values of 46.91–53.06 °C.
Binding models
For the tested ligands, only the co-crystal structure of
GI262570 with PPARc-LBP was reported [35], PDB entry
1FM9. Therefore, we obtained the binding models of the
tested ligands with PPARc-LBP employing the docking
program,
FLEXX
[30]. The binding conformations of the
ligands to PPARc-LBP derived by docking are schemati-
cally presented in Fig. 6. The corresponding hydrogen
bonds and hydrophobic interactions were, respectively,
calculated by using
HBPLUS
[36] and
LIGPLOT
[37] program,
which are shown in Fig. 7. The binding fashions of these
ligands with PPARc-LBP are in general analogous to that
of TZD class agonists: the polar head interacts with the
hydrophilic portion of the LBD, and the hydrophobic tail
stretches down into the large hydrophobic pocket of
PPARc forming strong hydrophobic contacts with several
lipophilic residues such as Cys285, Leu330, Ile341, Met348
and Met364 (Fig. 6). The polar heads of the ligands can be
divided into three sorts: TZD, carboxylic acid, o-hydroxyl-
acetophenone. Ligands with a TZD polar head (2:
troglitazone) form five hydrogen bonds with Gln286,
His449, Tyr473, His323 and Ser289 (Fig. 7B); ligands with
a carboxylic acid polar head (5: cis-parinaric acid) form
four hydrogen bonds with His449, Tyr473, His323 and
Ser289 (Fig. 7C); the polar head of LY171883 (9) forms
only three hydrogen bonds with Tyr327, Ser289 and
His323 (Fig. 7D). As far as the hydrophobic interactions
are concerned, the a-substituted groups of carboxyl group
of GI262570 (1) form several hydrophobic contacts
(Fig. 7A) with PPARc, besides the four highly conserved
hydrogen bonds.
Based on the binding models derived by F
LEX
X, the
binding free energies of the ligands with PPARc-LBP were
predicted by using
AUTODOCK
program [31]. The predicted
data are listed in Table 3. As will be discussed later, the
AUTODOCK
predicted binding free energies are in well
agreement with the K
D
values of Biacore (Table 3),
indicating again the reasonability of the binding models
for these ligands to PPARc-LBP.
Discussion
Binding affinity derived from the SPR assay
In the present study, for the first time, SPR biosensor
technology was used to directly measure the binding
interactions of small ligands to PPARc–LBD. The K
D
values of the tested ligands to PPARc–LBD derived from
the SPR determinations are in general agreement with those
measured by other methods (Table 2). Upon 15-d-PGJ
2
binding to PPARc–LBD, the association rate constant (k
on
)
and dissociation rate constant (k
off
) were estimated to be
257 ± 9.86
M
)1
Æs
)1
and 3.90 ± 0.074 · 10
)3
Æs
)1
(Table 1);
these two rate constants have not been reported elsewhere.
Fromtherateconstants,theK
D
of 15-d-PGJ
2
binding to the
receptor was measured as 15.1 ± 1.05 l
M
, which is close
to the value of 11.6 l
M
produced from the radioligand
competition-binding assay [17] (Table 2). Also, the SPR
measured K
D
values of GI262570, troglitazone, linoleic acid,
and indomethacin are in agreement with those determined
by other methods [16,17].
However, disagreement is observed between the Biacore-
determined K
D
values and the data reported in the literature
for GW9662 and cis-parinaric acid (CPA; Table 2). CPA is
a naturally existing polyunsaturated fatty acid, it is fluor-
escent in a hydrophobic environment. The binding affinity
of CPA to PPARc–LBD produced from Biacore assay
(7.80 l
M
)is% 10-fold larger than that (0.669 l
M
) obtained
from fluorescent assay by Palmer and Wolf [20]. This
inconsistency may result from the fact that CPA is easily
photochemically dimerized. During the Biacore assay, the
CPA solution could barely escape from the light and
air, allowing the monitored concentration of CPA to be
lower than expected. Therefore, the higher K
D
value was
measured.
GW9662 has been reported as an irreversible ligand of
PPARc–LBD with a very high binding affinity
(IC
50
¼ 3.3 n
M
) [19]. GW9662 may react with Cys285 of
PPARc–LBD establishing as the site of covalent modifica-
tion by releasing HCl molecule (Cl atom is from the
structure of GW9662) [19]. However, in the Biacore assay,
such an irreversible binding was not observed. Upon the
response of GW9662 in Biacore measurement, after equi-
librium phase for 120 s, the response returned to the
Table 2. The equilibrium constant and T
m
for the PPARc–LBD and the compounds complex. The equilibrium constants (K
D
s) and T
m
values were
obtained by Biacore and CD measurements, respectively. K¢
D
values are the equilibrium constants from the references (numbers in the parentheses).
Number Analyte K
D
(l
M
) K¢
D
(l
M
) T
m
(°C)
PPARc–LBD – – 46.14 ± 0.31
1 GI262570 0.0034 ± 0.00023 0.0011 [16] 53.06 ± 0.25
2 Troglitazone 0.274 ± 0.0142 0.30 [16] 50.39 ± 0.27
3 Linoleic acid 1.3 ± 0.084 4.9 [17]
a
49.31 ± 0.19
4 GW9662 1.59 ± 0.187 0.0033
b
[19] 48.31 ± 0.14
5 cis-Parinaric acid 7.80 ± 0.24 0.669 [20] 48.94 ± 0.22
6 15-d-PGJ
2
15.1 ± 1.05 11.6 [17] 49.49 ± 0.04
7 Indomethacin 38.0 ± 0.88 42 [17] 48.15 ± 0.33
8 Palmitic acid 156 ± 4.72 – 47.79 ± 0.25
9 LY171883 >1000 – 46.91 ± 0.38
a
Ligand bound to GST–PPARc–LBD.
b
IC
50
value.
Ó FEBS 2003 Binding analyses of human PPARc–LBD to ligands (Eur. J. Biochem. 271) 391
baseline rapidly, followed by another binding in the next
cycle, suggesting that the binding of GW9662 to PPARc–
LBD is reversible rather than irreversible. The binding
affinity produced from Biacore assay is only 1.59 l
M
(Table 2). The reversible nature of GW9662 binding to
PPARc–LBD may be attributed to the fact that in the
Biacore experiment, the incubation time of GW9662 with
PPARc–LBD is not long enough for the ligand to react with
Cys285. In addition, reaction conditions such as pH value
and temperature might also affect the covalent modification
of PPARc by GW9662.
Palmitic acid was reported as a natural ligand of PPARa
[38], but there is no quantitative binding affinity for this
ligand to PPARc as yet. For the first time, we found that
palmitic acid was also a weak ligand of PPARc.Biacore
SPR biosensor determination revealed that the binding
constant of this ligand to PPARc–LBD is % 156 l
M
(Table 2). LY171883 is an LTD
4
receptor antagonist, which
was reported to be capable of activating PPARc by
transactivation assay at micromolar concentrations [22].
However, SPR determination did not detect the binding of
LY171883 to PPARc, even at millimolar concentrations
(Fig. 2C).
SPR biosensor experiments require immobilization of a
receptor or ligand on a surface and monitoring its binding to
a second component in solution [14]. Without an appropri-
ate method for immobilizing one reactant onto the detecting
chip, SPR Biacore technology cannot be applied in binding
assay and drug screening. Omitting the ligands with
uncertain K
D
values (GW9662 and cis-parinaric acid), the
SPR Biacore values of K
D
have a good correlation with
those from reported binding affinities (K¢
D
in Table 2), the
correlation relationship between these two data sets is
K
D
¼ 1.062K¢
D
, the correlation coefficient R is as higher as
0.985. This demonstrates that SPR Biacore technology and
the protein immobilizing method can be used to monitor the
ligand–PPARc binding. With the advantages of SPR
Biacore technology in binding assay such as label-free and
real time detections [14], the measurement methods esta-
blished in this study can also be extended to drug screening
for discovering new agonists or antagonists of PPARc.
Thermal stability correlates with the binding affinity
X-ray crystal structures indicated that ligand-bound PPARc
adopts different conformations with respect to the apo-
PPARc [5,33–35]. The CD spectra indeed reflect the
conformational changes induced by the bound ligands
(Fig. 4). However, ligands studied in this paper with similar
function (agonists) bind to a similar conformation of
Fig. 5. Temperature dependence of ellipticity of apo-PPARc–LBD and
its complexes at 222 nm. Plots were obtained by fitting Dh/Dh
max
data
with the temperature for apo-PPARc–LBD (
¤), GI262570 (—),
linoleic acid (j), cis-parinaric acid (m)15-d-PGJ
2
(·), troglitazone (…).
Fig. 4. Circular dichroism spectra of PPARc–LBD (A), troglitazone/
PPARc–LBD (B) and GI262570/PPARc–LBD (C) complexes. Plots
were obtained at 4 °C(—),20°C(j), 40 °C(m), 60 °C(·), 90 °C(
¤),
and 4 °C again cooled down from 90 °C( ).
392 C. Yu et al. (Eur. J. Biochem. 271) Ó FEBS 2003
PPARc-LDB because different ligand-bound PPARc pro-
duced a similar CD spectral feature (Fig. 4). This is also in
agreement with the crystal structures of ligand–PPARc–
LDB complexes [5,33–35]. Nevertheless, the CD determin-
ation indicated that ligand binding increased the thermal
stability of PPARc. To quantitatively analyze the relation-
ship between transition temperature and binding affinity, we
defined the transition temperature increment (DT
m
)asthe
T
m
of a ligand complex subtracting that of the apo-PPARc–
LBD. The DT
m
data might reflect thermal stability of
PPARc–LBD caused by the ligand binding. It is interesting
that the DT
m
values correlate linearly with the binding
affinities of the ligands except GW9662 (Fig. 8). The
departure of GW9662 from the linear relationship is also
derived from the experimental condition (see Discussion in
the above section). Regression analysis without GW9662
resulted following the relationship between DT
m
values and
binding affinities of the ligands to PPARc–LBD:
À log K
D
¼ 2:52 þ 0:90 Â DT
m
n ¼ 8; SD ¼ 0:293; R
2
¼ 0:952
ð3Þ
where, n is the number of tested ligands, SD is the standard
error, R
2
is the correlation coefficient. This correlation
implies the direct relationship between the ligand binding
affinity and the thermal stability. Apparently, strong
binding of a ligand increases the thermal stability of
PPARc–LBD, which thereby increases the T
m
of thermally
induced unfolding of PPARc–LBD. This finding implies
that CD spectroscopic method can also be used in detecting
the binding affinity of ligands to PPARc andinscreening
new PPARc binders. Those compounds exhibiting larger
T
m
values using this paradigm would therefore be expected
to have potent binding affinity.
Structure–affinity relationship
To explore the binding characteristics of the ligands to
PPARc at the molecular level, molecular docking method
was applied to construct the ligand–PPARc binding models
and to predict the binding affinities. Due to the uncertain
binding affinity, GW9662 was not included in the docking
analysis.
AUTODOCK
predicted binding free energies of the
eight tested ligands to PPARc to have a good correlation
with the binding constants (Table 3 and Fig. 9). The
regression equation for SPR Biacore measured binding
affinity (–logK
D
), which was obtained by using the predicted
binding free energy (Table 3) as a unique descriptor. By
means of a simple linear regression analysis, the statistical
results are presented in Eqn 4:
À log K
D
¼ 2:93 À 0:34 Â DG
binding
n ¼ 8; SD ¼ 0:726; R
2
¼ 0:846
ð4Þ
where, n is the number of tested ligands, SD is the standard
error, and R
2
is the correlation coefficient. This correlation
between the predicted binding free energies and the Biacore-
measured binding affinity demonstrates again that the
binding models of the ligands to PPARc derived from
docking simulation are, in a way, reliable. However, Fig. 9
Fig. 6. The binding conformations of the test PPARc ligands. The first image is the conformational superposition within the binding pocket of
PPARc, showing that these ligands adopt a similar fashion to PPARc. The yellow structure in the first image is the binding conformation of
GI262570 retrieved from the crystal structure of the PPARc-GI262570 complex (PDB entry 1FM9).
Ó FEBS 2003 Binding analyses of human PPARc–LBD to ligands (Eur. J. Biochem. 271) 393
shows several dots, especially those corresponding to
linoleic acid and LY171883, that depart from the regression
line. This indicates that docking parameters would be
improved if Eqn 4 was used in predicting ligand-PPARc
binding affinity accurately.
AUTODOCK
predicted that binding free energy (DG
binding
)
contains three terms: intermolecular electrostatic interaction
(DG
es
), intermolecular atomic affinity (DG
nes
)andintra-
molecular torsional free energy (DG
tor
), which, respectively,
represent the contributions of the receptor–ligand electro-
static interactions, non-electrostatic interactions (including
hydrogen bonding and hydrophobic interaction), and the
entropy effect from the loss of torsion degrees of freedom
upon ligand binding (Table 3). The separated terms of the
predicted binding free energies indicate that non-electro-
static interactions dominate the binding of the ligands and
Fig. 7. Schematic representations of hydrogen bonds and hydrophobic interactions of PPARc with GI262570 (A), troglitazone (B), cis-parinaric acid
(C), and LY171883 (D). The corresponding hydrogen bonds and hydrophobic interactions were, respectively, calculated by using
HBPLUS
[36] and
LIGPLOT
[37] programs. Dashed lines represent hydrogen bonds and spiked residues form hydrophobic contacts with the ligands.
394 C. Yu et al. (Eur. J. Biochem. 271) Ó FEBS 2003
receptor. Moreover, the non-electrostatic interactions cor-
relate well with the total binding free energies, and the
correlation coefficient (R
2
) is as high as 0.92, while the other
two terms do not correlate with the total binding free
energy. The result predicted by docking is in good
agreement with the structural properties of both receptor
and ligands. The majority of binding sites of PPARc is
lipophilic, and the lipophilicity of the ligands is also very
high, so a hydrophobic effect must play a key role in
receptor–ligand binding.
On the other hand, the polar head of each ligand forms
strong hydrogen bonds with the polar pocket of PPARc.
Structurally, the polar heads of troglitazone, cis-parinaric
acid and LY171883 form 5, 4 and 3 hydrogen bonds with
PPARc, respectively, indicating that the ability of the polar
heads in forming hydrogen bonds with PPARc is in a
decreasing order of TZD > carboxylic acid group >
o-hydroxylacetophenone (Fig. 7). By considering the fact
that the tails of the ligands are located in the same
hydrophobic pocket of PPARc (Fig. 6), the above order
explains adequately why LY171883 is the weakest PPARc
binder and troglitazone is much more active than the ligands
containing a carboxylic acid polar head such as cis-parinaric
acid, linoleic acid, 15-d-PGJ
2
and palmitic acid (Table 2). In
comparison with other ligands, GI262570 forms several
additional hydrophobic contacts with PPARc (Fig. 7A),
which enhances the binding affinity of GI262570 to PPARc.
On the contrary, the hydrophobic tail of indomethacin is
shorter than those of other ligands, which decreases the
hydrophobic interactions with PPARc–LBD. The flexible
palmitic acid contains a bond with more rotational potential
than cis-parinaric acid; binding with the receptor the former
ligand lost more entropy than the later (Table 3). This is one
of the reasons that cis-parinaric acid binds to PPARc more
tightly than does palmitic acid (Table 2).
In conclusion, we demonstrated that SPR biosensor
technology can quantitatively measure the binding affinity
for ligand–PPARc interaction, and thereby can be poten-
tially extended in the compounds screening for discovering
the new agonists or antagonists of PPARc. CD spectros-
copy detected the conformational changes of PPARc
induced by ligand binding. Ligand binding enhances the
thermal stability of PPARc, which is reflected in the increase
of the transition temperature (T
m
), and correlates well with
the ligand binding affinity. The binding models constructed
by using docking modeling for the ligands to PPARc
provided a good explanation for the structure-binding
affinity relationship, and provided an attractive way for
predicting the overall binding affinity, although its separate
components cannot be as accurately predicted. This result
indicated that the binding models, docking paradigm and
scoring function might be extended to virtual screening for
finding new hits of PPARc ligands from the available
databases. Accordingly, combining above three methods is
Fig. 8. The correlation between binding affinity and thermal stability.
ThenegativelogarithmofK
D
was plotted against the DT
m
.Thedata
were analyzed by linear fitting method using
ORIGIN
7.0.
Fig. 9. The correlation between the SPR binding affinities and Auto-
Dock-predicted binding free energies.
Table 3. The binding free energies of the ligands binding to PPARc. The binding free energies (kcalÆmol
)1
) of the protein–ligand complex were
estimated by the scoring function of
AUTODOCK
3.0.
Number Ligand – log (K
D
) DG
binding
DG
nes
DG
es
DG
tor
1 GI262570 8.46852 ) 16.20 ) 20.14 ) 0.11 4.05
2 Troglitazone 6.56225 ) 10.98 ) 12.79 ) 0.06 1.87
3 Linoleic acid 5.88606 ) 4.47 ) 9.26 0.12 4.67
5 cis-Parinaric acid 5.10791 ) 5.91 ) 9.08 0.06 3.11
6 15-d-PGJ
2
4.82102 ) 6.02 ) 10.61 ) 0.07 4.67
7 Indomethacin 4.42022 ) 3.79 ) 5.56 0.21 1.56
8 Palmitic acid 3.80688 ) 3.75 ) 8.48 0.06 4.67
9 LY171883 < 3 ) 2.92 ) 6.12 0.09 3.11
Ó FEBS 2003 Binding analyses of human PPARc–LBD to ligands (Eur. J. Biochem. 271) 395
possibly an appropriate strategy for identifying novel
ligands that may bind to PPARc, i.e. (a) search potentially
active compounds from the molecular databases by using
molecular docking; (b) perform a primary screening by
means of SPR biosensor technology and (c) confirm the
binding affinities of candidate compounds employing CD
spectroscopic technology [39]. It has to be emphasized that
the paradigm described above can just provide primary hits
for PPARc binders. Structural optimization by using either
traditional medicinal chemistry or combinatorial chemistry
should be performed based on the active hits for finding
more potent PPARc ligands.
Acknowledgements
We would like to thank Jonas Uppenberg for providing us the pET15b-
hPPARc-LBD plasmid. The research was supported by grants from
National Natural Science Foundation of China (grants 29725203,
20372069 and 20072042), the State Key Program of Basic Research of
China (grants 1998051115, 2002CB512807 and 2002CB512802), Life
Science Foundation for Young Scientists of CAS (grant STZ-00–06),
Shanghai Basic Research Project (grant 02DJ14070), and Qi Ming Xing
Foundation of Shanghai Ministry of Science and Technology (grant
00QB14034). The technical support from Biacore AB Co. is acknow-
ledged.
References
1. Mangelsdorf, D.J. & Evans, R.M. (1995) The RXR heterodimers
andorphanreceptors.Cell 83, 841–850.
2. Willson, T.M., Brown, P.J., Sternbach, D.D. & Henke, B.R.
(2000) The PPARs: from orphan receptors to drug discovery.
J. Med. Chem. 43, 527–550.
3. Uppenberg, J., Svensson, C., Jaki, M., Bertilsson, G., Jendeberg,
L. & Berkenstam, A. (1998) Crystal structure of the ligand binding
domain of the human nuclear receptor PPARc. J. Biol. Chem. 273,
31108–31112.
4. Lee, G., Elwood, F., McNally, J., Weiszmann, J., Lindstrom, M.,
Amaral,K.,Nakamura,M.,Miao,S C.,Cao,P.,Learned,R.M.,
Chen, J L. & Li, Y. (2002) T0070907, a selective ligand for
peroxisome proliferator-activated receptor c, functions as an
antagonist of biochemical and cellular activities. J. Biol. Chem.
277, 19649–19657.
5. Nolte, R.T., Wisely, G.B., Westin, S., Cobb, J.E., Lambert, M.H.,
Kurokawa, R., Rosenfeld, M.G., Willson, T.M., Glass, C.K. &
Milburn, M.V. (1998) Ligand binding and co-activator assembly
of the peroxisome proliferator-activated receptor-c. Nature 395,
137–143.
6. Reginato, M.J. & Lazar, M.A. (1999) Mechanisms by which
thiazolidinediones enhance insulin action. Trends Endocrinol.
Metab. 10, 9–13.
7. Hulin, B., McCarthy, P.A. & Gibbs, E.M. (1996) The glitazone
family of antidiabetic agents. Curr. Pharm. Des. 2, 85–102.
8. Cobb, J.E., Blanchard, S.G., Boswell, E.G., Brown, K.K., Char-
ifson, P.S., Cooper, J.P., Collins, J.L., Dezube, M., Henke, B.R.,
Hull-Ryde, E.A., Lake, D.H., Lenhard, J.M., Oliver, W. Jr,
Oplinger, J., Pentti, M., Parks, D.J., Plunket, K.D. & Tong, W Q.
(1998) N-(2-Benzoylphenyl)-
L
-tyrosine PPARc agonists. 3.
Structure–activity relationship and optimization of the N-aryl
substituent. J. Med. Chem. 41, 5055–5069.
9. Young, P.W., Buckle, D.R., Cantello, B.B.C., Chapman, H.,
Clapham, J.C., Coyle, P.J., Haigh, D., Hindley, R.M., Holder,
J.C., Kallender, H., Latter, A.J., Lawrie, K.W.M., Mossakowska,
D., Murphy, G.J., Cox, L.R. & Smith, S.A. (1998) Identification
of high-affinity binding sites for the insulin sensitizer rosiglitazone
(BRL-49653) in rodent and human adipocytes using a radio-
iodinated ligand for peroxisomal proliferator-activated receptor c.
J. Pharmacol. Exp. Ther. 284, 751–759.
10. Rhoads, R.P., Greenwood, P.L., Bell, A.W. & Boisclair, Y.R.
(2000) Organization and regulation of the gene encoding the sheep
acid-labile subunit of the 150-kilodalton insulin-like growth fac-
tor-binding protein complex. Endocrinology 141, 1425–1433.
11. Dowell, P., Peter, V.J., Zabriskie, T.M. & Leid, M. (1997) Ligand-
induced peroxisome proliferator-activated receptor a conforma-
tional change. J. Med. Chem. 272, 2013–2020.
12. Krey, G., Braissant, O., Horset, F.L., Perroud, M., Kalkhoven,
E., Parker, M. & Wahli, W. (1997) Fatty acids, eicosanoids, and
hypolipidemic agents identified as ligands of peroxisome
proliferator-activated receptors by coactivator- dependent
receptor ligand assay. Mol. Endocrinol. 11, 779–791.
13. Nicholsa, J.S., Parksa, D.J., Conslerb, T.G. & Blancharda, S.G.
(1998) Development of a scintillation proximity assay for peroxi-
some proliferator-activated receptor c ligand binding domain.
Anal. Biochem. 257, 112–119.
14. Cooper, M.A. (2003) Optical biosensors in drug discovery. Nat.
Rev. Drug Discovery 1, 515–528.
15. Rich, R.L., Hoth, L.R., Geoghegan, K.F., Brown, T.A., LeMotte,
P.K.,Simons,S.P.,Hensley,P.&Myszka,D.G.(2002)Kinetic
analysis of estrogen receptor/ligand interactions. Proc. Natl Acad.
Sci. USA 99, 8562–8567.
16. Henke, B.R., Blanchard, S.G., Brackeen, M.F., Brown, K.K.,
Cobb, J.E., Collins, J.L., Harrington, W.W., Hashim, M.A., Hull-
Ryde,E.A.,Kaldor,I.,Kliewer,S.A.,Lake,D.H.,Leesnitzer,
L.M.,Lehmann,J.M.,Lenhard,J.M.,Orband-Miller,L.A.,
Miller,J.F.,Mook,R.A.Jr,Noble,S.A.,Oliver,W.Jr,Parks,
D.J., Plunket, K.D., Szewczyk, J.R. & Willson, T.M. (1998) N-(2-
Benzoylphenyl)-
L
-tyrosine PPARc agonists. 1. Discovery of a
novel series of potent antihyperglycemic and antihyperlipidemic
agents. J. Med. Chem. 41, 5020–5036.
17. Ferry, G., Bruneau, V., Beauverger, P., Goussard, M., Rodriguez,
M.,Lamany,V.,Dromaint,S.,Caner,E.,Galizzi,J.P.&Boutin,
J.A. (2001) Binding of prostaglandins to human PPARc:tool
assessment and new natural ligands. Eur. J. Pharmacol. 417, 77–89.
18. Kliewer, S.A., Sundseth, S.S., Jones, S.A., Brown, P.J., Wisely,
G.B., Koble, C.S., Devchand, P., Wahli, W., Willson, T.M.,
Lenhard, J.M. & Lehmann, J.M. (1997) Fatty acids and eicosa-
noids regulate gene expression through direct interactions with
peroxisome proliferator-activated receptors a and c. Proc. Natl
Acad. Sci. USA 94, 4318–4323.
19. Leesnitzer, L.M., Parks, D.J., Bledsoe, R.K., Cobb, J.E., Collins,
J.L.,Consler,T.G.,Davis,R.G.,Hull-Ryde,E.A.,Lenhard,J.M.,
Patel, L., Plunket, K.D., Shenk, J.L., Stimmel, J.B., Therapontos,
C., Willson, T.M. & Blanchard, S.G. (2002) Function
consequences of cyseine modification in the ligand binding sites
of peroxisome proliferator activated receptor by GW9662.
Biochemistry 41, 6640–6650.
20. Palmer, C.N.A. & Wolf, C.R. (1998) cis-Parinaric acid is a ligand
for the human peroxisome proliferator activated receptor c:
development of a novel spectrophotometric assay for the discovery
of PPARc ligands. FEBS Lett. 431, 476–480.
21. Lehmann, J.M., Lenhard, J.M., Oliver, B.B., Ringold, G.M. &
Kliewer, S.A. (1997) Peroxisome proliferator-activated receptors a
and c are activated by indomethacin and other non-steroidal anti-
inflammatory drug. J. Biol. Chem. 272, 3406–3410.
22. Kliewer, S.A., Forman, B.M., Blumberg, B., Ong, E.S., Borgme-
yer, U., Mangelsdorf, D.J., Umesono, K. & Evans, R.M. (1994)
Differential expression and activation of a family of murine per-
oxisome proliferator-activated receptors. Proc.NatlAcad.Sci.
USA 91, 7355–7359.
23. Kallenberger,B.C.,Love,J.D.,Chatterjee,V.K.K.&Schwabe,
J.W.R. (2003) A dynamic mechanism of nuclear receptor activa-
396 C. Yu et al. (Eur. J. Biochem. 271) Ó FEBS 2003
tionanditsperturbationinahumandisease.Nat. Struct. Biol. 10,
136–140.
24. Collins, J.L., Blanchard, S.G., Boswell, G.E., Charifson, P.S.,
Cobb, J.E., Henke, B.R., Hull-Ryde, E.A., Kazmierski, W.M.,
Lake, D.H., Leesnitzer, L.M., Lehmann, J., Lenhard, J.M.,
Orband-Miller, L.A., Gray-Nunez, Y., Parks, D.J., Plunkett,
K.D. & Tong, W Q. (1998) N-(2-Benzoylphenyl)-
L
-tryosine
PPARc agonists. 2. Structure–activity relationship and optimiza-
tion of the pheny alkyl ether moiety. J. Med. Chem. 41, 5037–5054.
25. Vinter, J.G., Davis, A. & Saunders, M.R. (1997) Strategic
approaches to drug design. I. An intergrated software framework
for molecular modeling. J. Comput. Aided Mol. Des. 1, 31–51.
26. Marsili, M. & Gasteiger, J. (1980) Pi charge distribution from
molecular topology and pi orbital electronegativity. Croat. Chem.
Acta. 53, 601–614.
27. Gasteiger, J. & Marsili, M. (1980) Iterative partial equalization of
orbital eletronegativity – a rapid access to atomic charges. Tetra-
hedron 36, 3219–3228.
28. Bernstein, F.C., Koetzle, T.F., Williams, G.J., Meyer, E.F. Jr,
Brice, M.D., Rogers, J.R., Kennard, O., Shimanouchi, T. &
Tasumi, M. (1977) The protein data bank: a computer-based
archival file for macromolecular structures. J. Mol. Biol., 112,
535–542.
29. Berman, H.M., Westbrood, J., Feng, Z., Gilliland, G., Bhat, T.N.,
Weissig, H., Shindyalov, I.N., & Bourne, P.E. (2000) The Protein
Data Bank. Nucl. Acids. Res., 28, 235–242.
30. Rarey, M., Kramer, B., Lengauer, T. & Klebe, G. (1996) A fast
flexible docking method using an incremental construction algo-
rithm. J. Mol. Biol. 261, 470–489.
31. Morris, G.M., Goodsell, D.S., Halliday, R.S., Huey, R., Hart,
W.E., Belew, R.K. & Olson, A.J. (1998) Automated docking using
a lamarckian genetic algorithm and empirical binding free energy
function. J. Comp. Chem. 19, 1639–1662.
32. Rich, R.L., Dayas, Y.S.N., Morton, T.A. & Myszka, D.G. (2001)
High-resolution and high-throughput protocols for measuring
drug/human serum albumin interactions using BIAcore. Anal.
Biochem. 296, 197–207.
33. Oberfteld, J.L., Collins, J.L., Holmes, C.P., Goreham, D.M.,
Cooper, J.P., Cobb, J.E., Lenhard, J.M., Hull-Ryde, E.A., Mohr,
C.P., Blanchard, S.G., Parks, D.J., Moore, L.B., Lehmann, J.M.,
Plunket, K., Miller, A.B., Milburn, M.V., Kliewer, S.A. & Will-
son, T.M. (1999) A peroxisome proliferator-activated receptor c
ligand inhibits adipocyte differentiation. Proc. Natl Acad. Sci.
USA 96, 6102–6106.
34. Cronet, P., Petersen, J.F.W., Folmer, R., Blomberg, N., Sjoblom,
K., Karlsson, U., Lindstedt, E. & Bamberg, K. (2001) Structure of
the PPARa and -c ligand binding domain in complex with AZ242;
ligand selectivity and agonist activation in the PPAR family.
Structure 9, 699–706.
35. Gampe, R.T., Montana, V.G., Lambert, M.H., Miller, A.B.,
Bledsoe, R.K., Milburn, M.V., Kliewer, S.A., Willson, T.M. &
Xu,H.E.(2000)AsymmetryinthePPARc/RXRa crystal struc-
ture reveals the molecular basis of heterodimerization among
nuclear receptors. Mol. Cell. 5, 545–555.
36. McDonald, I.K. & Thornton, J.M. (1994) Satisfying hydrogen
bonding potential in proteins. J. Mol. Biol. 238, 777–793.
37.Wallace,A.C.,Laskowski,R.A.&Thornton,J.M.(1995)
LIGPLOT
: a program to generate schematic diagrams of protein–
ligand interactions. Protein Eng. 8, 127–134.
38. Willson, T.M. & Wahli, W. (1997) Peroxisome proliferator-
activated receptor agonists. Curr. Opin. Chem. Biol. 1, 235–
241.
39. Shen, J., Xu, X., Cheng, F., Liu, H., Luo, X., Shen, J., Chen, K.,
Zhao, W., Shen, X. & Jiang, H. (2003) Virtual screening on
natural products for discovering active compounds and target
information. Curr. Medical Chem. 10, 2327–2342.
Ó FEBS 2003 Binding analyses of human PPARc–LBD to ligands (Eur. J. Biochem. 271) 397