Báo cáo khóa học: Mechanistic insight into the peroxidase catalyzed nitration of tyrosine derivatives by nitrite and hydrogen peroxide doc
Bạn đang xem bản rút gọn của tài liệu. Xem và tải ngay bản đầy đủ của tài liệu tại đây (281.52 KB, 12 trang )
Mechanistic insight into the peroxidase catalyzed nitration of tyrosine
derivatives by nitrite and hydrogen peroxide
Enrico Monzani
1
, Raffaella Roncone
1
, Monica Galliano
2
, Willem H. Koppenol
3
and Luigi Casella
1
1
Dipartimento di Chimica Generale,
2
Dipartimento di Biochimica, Universita
`
di Pavia, Italy;
3
Institute of Inorganic Chemistry,
ETH Ho
¨
nggerberg, Zu
¨
rich, Switzerland
Peroxidases perform the nitration of tyrosine and tyrosyl
residues in proteins, in the presence of nitrite and hydrogen
peroxide. The nitrating species is still unknown but it is
usually assumed to be nitrogen dioxide. In the present
investigation, the nitration of phenolic compounds derived
from tyrosine by lactoperoxidase and horseradish peroxi-
dase was studied, with the aim of elucidating the mechanism
of the reaction. The results indicate that nitrogen dioxide
cannot be the only nitrating species and suggest the presence
of two simultaneously operative pathways, one proceeding
through enzyme-generated nitrogen dioxide and another
through a more reactive species, assumed to be complexed
peroxynitrite, which is generated by reaction of hydrogen
peroxide with the enzyme–nitrite complex. The importance
of the two pathways depends on peroxide and nitrite con-
centrations. With lactoperoxidase, nitration through the
highly reactive intermediate is preferred except at very low
nitrite concentration, while with horseradish peroxidase, the
nitrogen dioxide driven mechanism is preferred except at
very high nitrite concentration. The preferred mechanism for
the two enzymes is that operative in the physiological nitrite
concentration range.
Keywords: nitrogen dioxide; peroxidases; peroxynitrite;
phenol nitration; reactive nitrogen species.
It is well documented that reactive nitrogen species derived
from nitrogen monoxide (NO) are involved in many
pathological conditions [1,2]. Although NO performs many
important physiological functions, ranging from neuro-
transmission to blood pressure regulation, and is involved in
the defence mechanism against microorganisms [3,4], over-
production of NO can have damaging effects [4,5]. Nitrite
is a major product of nitrogen monoxide metabolism [6]
and markedly increased nitrite levels have been detected
in situations, e.g. during inflammatory processes, where NO
is overproduced [7,8]. However, nitrite does not accumulate
in vivo because it is oxidized (to nitrate) by the Fe
2+
-O
2
form of hemoglobin (oxyHb) or the Fe
2+
-O
2
form of
myoglobin (oxyMb), producing the Fe
3+
forms of these
(metHb and metMb) [6], respectively, or by other inflam-
matory oxidants such as hypochlorous acid [9], causing the
formation of reactive nitrogen species [10].
An additional pathway for nitrite oxidation that is
receiving increasing attention is its reaction with peroxidases
in the presence of hydrogen peroxide [11–16]. This reaction
produces reactive nitrogen species that have been shown to
degrade chlorophyll [11], nitrate tyrosine [12] and tyrosyl
residues in proteins [13,14]. The latter reactions are of
particular importance because, in addition to those invol-
ving the more typical peroxidase catalyzed oxidations of
chloride and thiocyanate [12], they may serve a defensive
function against microorganisms. Several mechanisms for
the peroxidase catalyzed phenol nitration in the presence of
nitrite/hydrogen peroxide have been proposed but, in spite
of recent efforts, the nature of the nitrating species has
not been fully clarified yet. The currently favored pathway
[15,16] involves one-electron oxidation of nitrite by the
peroxide-generated enzyme intermediates known as com-
pound I and compound II [17,18]:
E þ H
2
O
2
! compound I þ H
2
O ð1Þ
compound I þ NO
2
À
! compound II þ NO
2
ð2Þ
compound II þ NO
2
À
þ 2H
þ
! E þ NO
2
þ H
2
O ð3Þ
where E represents the native (Fe
3+
)formoftheenzyme.
For myeloperoxidase, the reaction of the enzyme inter-
mediates by nitrite has been studied recently in detail [15].
According to this mechanism, NO
2
could either nitrate
a phenol with a reaction stoichiometry of 2 : 1 or directly
react with a peroxidase-generated phenoxy radical accord-
ing to reaction 5:
NO
2
þ PhOH ! NO
2
À
þ PhO
þ H
þ
ð4Þ
NO
2
þ PhO
! O
2
NÀPhOH ð5Þ
An alternative pathway, involving a two-electron enzymatic
oxidation of nitrite to nitryl cation, a powerful phenol
nitrating agent [19]:
E þ H
2
O
2
! compound I þ H
2
O ð1Þ
compound I þ NO
2
À
þ 2H
þ
! E þ NO
2
þ
þ H
2
O ð6Þ
is considered unlikely in view of the extremely rapid reaction
of NO
2
+
with water, to yield nitrate [20].
Correspondence to L. Casella, Dipartimento di Chimica Generale,
Via Taramelli 12, 27100 Pavia, Italy.
Fax: + 39 0382 528544, Tel.: + 39 0382 507331,
E-mail:
Abbreviations: LPO, lactoperoxidase; HRP, horseradish peroxidase.
(Received 21 November 2003, revised 29 December 2003,
accepted 13 January 2004)
Eur. J. Biochem. 271, 895–906 (2004) Ó FEBS 2004 doi:10.1111/j.1432-1033.2004.03992.x
In a recent report, the reaction of lactoperoxidase
compound I with nitrite was found to lead directly to
nitrate, without formation of NO
2
radicals as intermediates
[21]. Moreover, additional work on eosinophil peroxidase
and myeloperoxidase suggested that these proteins perform
nitrations in the presence of nitrite and hydrogen peroxide,
generating peroxynitrite [22]. Therefore, different enzymes
may activate nitrite through different mechanisms. In this
paper we provide new mechanistic insight into the lacto-
peroxidase and horseradish peroxidase mediated nitration
of the representative tyrosine derivatives 14 by nitrite/
hydrogen peroxide and, in particular, we address the
problem of the possible contribution of peroxynitrite in
this reaction. Peroxynitrite nitrates phenolic substrates
[23,24] and could conceivably be formed by reaction of
hydrogen peroxide with a peroxidase-nitrite complex:
E ỵ NO
2
! ENO
2
7ị
ENO
2
ỵ H
2
O
2
! EOH
ỵ OẳNOOH 8ị
The present investigation extends our previous studies on
the peroxidase catalyzed oxidation of phenolic compounds
by hydrogen peroxide [2527]. The latter reaction competes
with phenol nitration and gives rise to the dimeric and
oligomeric phenol coupling products shown.
Materials and methods
Materials and instrumentation
Bovine lactoperoxidase was puried according to a new
procedure, which is an improvement of that reported by
Ferrari et al. [28]. Horseradish peroxidase (HRP) was
obtained from Sigma as a freeze-dried powder (RZ ẳ 3.2
at pH 7.0, e
402
ẳ 103 m
M
)1
ặcm
)1
).
L
-Tyrosine, 3-nitro-
L
-tyrosine, tyramine, 3-(4-hydroxyphenyl)-propionic acid
and 4-hydroxybenzonitrile were from Sigma-Aldrich.
N-Acetyltyramine was prepared by reaction between tyr-
amine and acetic anhydride as reported previously [25].
Peroxynitrite was prepared according to a literature proce-
dure [29]. NO
2
was obtained by air oxidation of NO. All
other chemicals were reagent grade and used as received.
Hydrogen peroxide solutions were freshly prepared by
diluting a 30% (v/v) solution in water and were standard-
ized by iodimetry. Optical spectra were measured with an
HP 8452 A diode array spectrophotometer (Agilent Tech-
nologies, Italy). Stopped-ow experiments were carried out
with a SMF-3 Bio-Logic coupled to a diode array J & M
TIDAS spectrophotometer (J&M Analytische Mess und
Regeltechnik GmbH, Germany) with 6 ms dead time and a
0.5 cm path length cell, or an Applied Photophysics model
RS-1000 (Applied Photophysics Ltd, UK) instrument
with 1 ms dead time and 1 cm or 0.2 cm path length cells.
NMR spectra were obtained at 400 MHz with a Bruker
AVANCE spectrometer (Bruker BioSpin, Italy). Electro-
spray ionization MS data were acquired using a Finnigan
LCQ ion trap mass spectrometer (Thermo, Italy).
Purication of lactoperoxidase (LPO)
Fresh untreated bovine milk (10 L) was defatted by centrif-
ugation (twice for 1 h at 10 900 g,4C), the pH of the
resulting liquid was adjusted to 6.6, and casein was precipi-
tated by addition of 2
M
CaCl
2
(60 mL per L of defatted
milk). After stirring overnight at 4 C, the precipitate was
eliminated by centrifugation (twice for 1 h at 10 900 g,
4 C). The whey was dialyzed against 10 m
M
Tris/HCl
(pH 7.0) and applied sequentially through two tandemly
linked ion exchange columns packed with DEAE-cellulose
(5 ã 50 cm) and CM-cellulose (2.6 ã 30 cm) preequilibrated
with the same buffer. At the end of sample loading, the
unbound material was washed out with the initial buffer until
the absorbance at 280 nm became negligible. The columns
were then detached from each other and the LPO bound to
the cation exchange column was eluted by making the buffer
0.5
M
in NaCl. This step was followed by gel ltration on
Sephadex G-100 in a column (6 ã 65 cm) equilibrated with
20 m
M
Tris buffer, 0.15
M
NaCl, pH 7.0. The 412 nm
absorbing fractions were pooled and, using an Amicon
30 kDa cut-off lter (Millipore), concentrated and equili-
brated in 10 m
M
phosphate buffer, pH 6.8. All these steps
were carried out at 4 C. The protein was then separated
from contaminating lactoferrin by ion exchange chromato-
graphy on a Mono S HR 10/10 column (Amersham Phar-
macia Biotech), equililibrated with the phosphate buffer, and
connected to an Akta Purier system (Amersham Pharmacia
Biotech). Elution was achieved at a ow rate of 3 mLặmin
)1
for 20 min with the equilibration buffer, followed by a three-
step linear gradient: from 025% of buffer B (10 m
M
phosphate buffer, 1
M
NaCl, pH 6.8) in 20 min, from 25
35% in 60 min and from 35100% of buffer B in 20 min,
and monitored at 280 and 412 nm. The lactoperoxidase
containing peak was manually collected and the homo-
geneity of the protein was checked by SDS/PAGE under
reducing and nonreducing conditions in 10% gels. The
enzyme preparation gave 75 mg of protein with RZ > 0.90.
The concentration of enzyme solutions was determined
optically using e
412
ẳ 114 m
M
)1
ặcm
)1
.
Preparation of nitrophenols
The nitrated derivatives of 1, 2 and 4 are not commercially
available and were therefore prepared in a small scale by
LPO mediated reactions.
3-(4-Hydroxy-3-nitrophenyl)-propionic acid. 3-(4-Hydro-
xyphenyl)-propionic acid (50 mg) was dissolved in 25 mL of
a5m
M
phosphate buffer solution at pH 7.5 containing
sodium nitrite (0.08
M
). To this solution, dilute solutions of
LPO in the same buffer (nal concentration 3 ã 10
)8
M
)and
hydrogen peroxide (nal concentration 8.0 ã 10
)4
M
)were
added in small amounts during 0.5 h at 25 Cinorderto
obtain an intense and persistent yellow color. Then, the pH of
896 E. Monzani et al.(Eur. J. Biochem. 271) ể FEBS 2004
the solution was brought to about 4 in order to obtain the
product in the acidic form. The reaction products were
extracted several times with dichloromethane and the
organic phase was rotary evaporated to dryness. The residue
was chromatographed on a silica gel column using a mixture
of dichloromethane/methanol (95 : 5, v/v). 3-(4-Hydroxy-3-
nitrophenyl)-propionic acid eluted as the first fraction. The
product was recovered upon evaporation of the solvent (yield
% 40%). Table 1 details the analytical data obtained for
3-(4-hydroxy-3-nitrophenyl)-propionic acid. The extinction
coefficient of 3-(4-hydroxy-3-nitrophenyl)-propionic acid at
422 nm in phosphate buffer (pH 7.5) is 3600
M
)1
Æcm
)1
.
3-Nitrotyramine. N-Acetyltyramine (50 mg) was dissolved
in 10 mL of a 10 m
M
phosphate buffer solution at pH 7.5
containing sodium nitrite (0.25
M
). To this solution, several
additions of a dilute solution of LPO in the same buffer
(final concentration 3.0 · 10
)8
M
) and hydrogen peroxide
(final concentration 8.0 · 10
)4
M
)weremadeandthe
mixture was allowed to react while stirring at room
temperature for 1 h. After acidification to pH 4, the organic
products were extracted with chloroform and the solution
was rotary evaporated to dryness to give a red solid. The
crude 3-nitro-N-acetyltyramine was hydrolyzed by refluxing
it in a 1
M
solution of sodium hydroxide (10 mL) for 1 h.
After rotary evaporation, the residue was applied on a
silica gel column and chromatographed using a gradient of
dichloromethane/methanol. The product was recovered
after evaporation of the solvent (yield 20%). Table 2 details
the analytical data obtained for 3-nitrotyramine. The
extinction coefficient of 3-nitrotyramine at 422 nm in
phosphate buffer pH 7.5 is 2800
M
)1
Æcm
)1
.
4-Hydroxy-3-nitrobenzonitrile. 4-Hydroxybenzonitrile
(100 mg) was dissolved in 25 mL of a 5 m
M
phosphate
buffer solution at pH 7.5. Dilute solutions of LPO (final
concentration 5.6 · 10
)8
M
), hydrogen peroxide (0.88 m
M
)
and sodium nitrite (6 m
M
) were added in small portions to
the substrate solution during 1 h at 25 °C. Formation of the
product was accompanied by the development of a yellow
and persistent color in the solution. Then, the pH of the
mixture was brought to about 4 in order to obtain the
product in the protonated form. The solution was extracted
several times with ethyl acetate and the organic phase was
rotary evaporated to dryness. The residue was chromato-
graphed on a silica gel column using dichloromethane
as eluent. 4-Hydroxy-3-nitrobenzonitrile eluted as the first
fraction. The product was recovered upon evaporation of
the solvent (yield % 5%). Table 3 details the analytical data
obtained for 4-hydroxy-3-nitrobenzonitrile. The extinction
coefficient of 4-hydroxy-3-nitrobenzonitrile at 422 nm in
phosphate buffer (pH 7.5) used in the kinetic experiments
is 1700
M
Æcm
)1
and the wavelength of maximum absorption
is at 400 nm (e 2200
M
)1
Æcm
)1
).
Kinetic experiments of phenol nitration
The kinetics of the enzymatic phenol nitration were studied
spectrophotometrically using a magnetically stirred,
thermostated optical cell of 1 cm path length, in 200 m
M
phosphate buffer, pH 7.5. The temperature was main-
tained at 25 ± 0.1 °C. The reactions were conveniently
followed through the increase of absorbance at 422 nm,
due to the formation of the nitrophenolic derivatives, in
the initial phase of the reactions. The conversion of the
data from DAÆs
)1
to
M
Æs
)1
was performed using the e
422
values for 1–4; for 3-nitro-
L
-tyrosine, the extinction
coefficient e
422
¼ 4000
M
)1
Æcm
)1
was used. In order to
reduce the effect of noise in the absorbance readings, the
difference between the absorbance at 422 nm and that at
820 nm, where the absorption remains negligible during
the assay, was monitored. Preliminary experiments were
Table 1. Analytical data of 3-(4-hydroxy-3-nitrophenyl)-propionic acid. Elemental analysis,
1
H-NMR, MS (ESI) and IR characterization data of
3-(4-hydroxy-3-nitrophenyl)-propionic acid.
Elemental analysis (%)
1H NMR (CDCl
3
)
(d)
MS (ESI)
(m/z)
MS/MS (ESI m/z 210.3)
(m/z)
IR (NaCl, Nujol mull)
(mÆcm
)1
)
Calculated Found
C 51.19 C 50.95 10.5 (broad, OH) 212.3 [M+1] 166.3 [(M-CO
2
)+1] 1510 m(NO
2
)
as
H 4.30 H 4.27 7.95 (d, 1H, phenyl 2-H) 1338 m(NO
2
)
s
N 6.63 N 6.60 7.44 (dd, 1H, phenyl 6-H) 850 m(C-N)
7.12 (d, 1H, phenyl 5-H)
2.96 (t, 2H,CH
2
-CO)
2.69 (t, 2H, C-CH
2
-Ph)
Table 2. Analytical data of 3-nitrotyramine. Elemental analysis,
1
H-NMR, MS (ESI) and IR characterization data of 3-nitrotyramine.
Elemental analysis (%)
1H NMR
(D
2
O)
(d)
MS (ESI)
(m/z)
MS/MS
(ESI m/z 210.3)
(m/z)
MS-MS-MS
(ESI, m/z 166.2)
(m/z)
IR (NaCl,
Nujol mull)
(mÆcm
)1
)Calculated Found
C 52.74 C 52.13 7.72 (d, 1H, phenyl 2-H) 183.2 [M +1] 166.2 [(M-NH
3
)+1] 120.2 [(M-NH
3
-NO
2
)+1] 1522 m(NO
2
)
as
H 5.53 H 5.59 7.18 (dd, 1H, phenyl 6-H) 166.2 [(M-NH
3
) +1] 1345 m(NO
2
)
s
N 15.38 N 14.95 6.70 (d, 1H, phenyl 5-H) 858 m(C-N)
3.15 (t, 2H, CH
2
-N)
2.78 (t, 2H, C-CH
2
-Ph)
Ó FEBS 2004 Peroxidase catalyzed nitration (Eur. J. Biochem. 271) 897
performed with substrates 1–4 to find appropriate condi-
tions to follow the reactions and, in particular, to establish
conditions of saturation of hydrogen peroxide, in order to
avoid inconvenient excess of this reagent. Steady-state
kinetics were then studied as a function of both the phenol
and nitrite concentrations. For each substrate, the condi-
tions required to study the rate dependence on the
reactants concentrations were found through the following
steps: (a) determination of the peroxide concentration that
maximizes the nitration rate with high substrate and nitrite
concentrations (typically starting from [phenol] ¼ 2m
M
and [NO
2
–
] ¼ 0.2
M
for LPO or 2.0
M
for HRP); (b) study
of the dependence of the rate versus substrate concentra-
tion maintaining [H
2
O
2
] as optimized in the previous step
andhigh[NO
2
–
]; (c) study of the dependence of the rate
versus nitrite concentration maintaining [H
2
O
2
]and
[PhOH] saturating as found in step b; (d) when the
substrate and nitrite concentrations that maximize the rate
did not fit with those used in step a, the whole procedure
was repeated starting with different [NO
2
–
] and [phenol] in
an iterative way.
The kinetic studies were then performed with the
following concentrations of the reactants: (a) dependence
of the rate versus phenol concentration with LPO (50 n
M
):
[1] ¼ 0–10 m
M
,[H
2
O
2
] ¼ 0.42 m
M
,[NO
2
–
] ¼ 94 m
M
;[2] ¼
0–1.0 m
M
,[H
2
O
2
] ¼ 0.84 m
M
,[NO
2
–
] ¼ 78 m
M
;[3] ¼
0–20 m
M
,[H
2
O
2
] ¼ 0.84 m
M
,[NO
2
–
] ¼ 30 m
M
;[4] ¼
0–10 m
M
,[H
2
O
2
] ¼ 1.3 m
M
,[NO
2
–
] ¼ 0.2
M
; (b) depend-
ence of the rate versus phenol concentration with HRP
(30 n
M
): [1] ¼ 0–20 m
M
,[H
2
O
2
] ¼ 1.60 m
M
,[NO
2
–
] ¼
2.1
M
;[2] ¼ 0–10 m
M
,[H
2
O
2
] ¼ 3.0 m
M
,[NO
2
–
] ¼ 2.1
M
;
[3] ¼ 0–1.0 m
M
,[H
2
O
2
] ¼ 0.24 m
M
,[NO
2
–
] ¼ 2.1
M
;
[4] ¼ 0–24 m
M
,[H
2
O
2
] ¼ 0.40 m
M
,[NO
2
–
] ¼ 2.1
M
;(c)
dependence of the rate versus nitrite concentration
(0–0.4
M
)withLPO(50n
M
): [1] ¼ 1.0 m
M
,[H
2
O
2
] ¼
0.42 m
M
;[2] ¼ 1.0 m
M
,[H
2
O
2
] ¼ 0.84 m
M
;[3] ¼ 0.6 m
M
,
[H
2
O
2
] ¼ 0.84 m
M
;[4] ¼ 5.0 m
M
,[H
2
O
2
] ¼ 1.3 m
M
;
(d) dependence of the rate versus nitrite concentration
(0–3.5
M
)withHRP(30n
M
): [1] ¼ 13.0 m
M
,[H
2
O
2
] ¼
1.6 m
M
;[2] ¼ 5.0 m
M
,[H
2
O
2
] ¼ 3.0 m
M
;[3] ¼ 0.70 m
M
,
[H
2
O
2
] ¼ 0.24 m
M
;[4] ¼ 17.0 m
M
,[H
2
O
2
] ¼ 0.40 m
M
.
Nitration of 3 at low nitrite concentration
The nitration of tyrosine by LPO and HRP was also studied
at a pathophysiological concentration of nitrite. With
LPO (0.50 l
M
) the concentrations of the reactants were:
[H
2
O
2
] ¼ 0.84 m
M
,[3] ¼ 0.59 m
M
,[NO
2
–
] ¼ 100 l
M
.With
HRP (0.50 l
M
) the concentrations of the reactants were:
[H
2
O
2
] ¼ 0.24 m
M
,[3] ¼ 0.69 m
M
,[NO
2
–
] ¼ 100 l
M
.
Peroxidase catalyzed oxidation of 4
Steady state kinetic experiments of catalytic oxidation of 4
by LPO or HRP and hydrogen peroxide were performed in
200 m
M
phosphate buffer (pH 7.5) at 25 ± 0.1 °C, accord-
ing to the following procedure. To the solution containing
the enzyme (56 n
M
LPO or 71 n
M
HRP) and variable
amounts of 4 (0–50 m
M
) in an optical quartz cell of 1 cm
path length, hydrogen peroxide (0.2 m
M
) was added to the
fixed final volume of 1.6 mL. The progress of the reaction
was followed by monitoring the absorbance changes at
322 nm due to the formation of the oxidative coupling
dimer of 4. The initial rates were determined from the linear
part of the trace at 322 nm. To convert the rates from
DAÆs
)1
to
M
Æs
)1
it was necessary to determine the extinction
coefficient of the dimeric product of the reaction. This e
322
value was obtained from a plot of absorbance versus
number of moles of hydrogen peroxide consumed in the
HRP-catalyzed oxidation of 4, where hydrogen peroxide
was the limiting reagent. The following reagent concentra-
tions were used: [HRP] 33 n
M
,[4]0.3m
M
,and[H
2
O
2
]from
3.8 · 10
)5
to 1.5 · 10
)4
M
, the other conditions were the
same as in the kinetic experiments. From this analysis the
e
322
value of 5600
M
)1
Æcm
)1
was obtained.
Reduction of compound II by substrates
The second-order catalytic constant for the reaction
between HRP compound II and nitrite was determined
in 200 m
M
phosphate buffer (pH 7.5) at 25.0 ± 0.1 °C.
Compound II was prepared by incubation of the protein
solution (7.0 l
M
) with a small excess (two mol equivalents)
of hydrogen peroxide for 1 min. The transformation to the
iron(III) species was followed by monitoring the absorbance
changes of the protein with time (readings every 0.1 s), using
a variable excess of nitrite (from 40 l
M
to 1.6 m
M
). The
compound II reduction to iron(III) followed a first-order
behavior. In order to decrease the noise in the readings, the
determination of the observed rate constants (k
obs
)was
performed following the reaction at the two wavelengths
where the spectral changes are largest and interpolating
their difference in absorbance (A
400
–A
420
nm) with a first-
order equation. The replot of k
obs
versus [NO
2
–
] was linear
and the slope gave the catalytic constant.
In a similar way, the second-order catalytic constants for
the reaction between LPO or HRP compound II and the
representative phenols 3 and 4 were determined. The enzyme
compound II derivatives (2 l
M
) were prepared as described
before. Solutions of the substrates (1–10 m
M
) in an appro-
priate volume of 200 m
M
phosphate buffer (pH 7.5) were
Table 3. Analytical data of 4-hydroxy-3-nitrobenzonitrile. Elemental analysis,
1
H-NMR, MS (ESI) and IR characterization of 4-hydroxy-
3-nitrobenzonitrile.
Elemental analysis (%)
1H NMR (CDCl
3
)
(d)
MS (ESI)
(m/z)
IR (NaCl, Nujol mull)
(mÆcm
)1
)
Calculated Found
C 51.23 C 50.80 10.9 (broad, OH) 165.1 [M +1] 1510 m(NO
2
)
as
H 2.46 H 2.54 8.5 (d, 1H, phenyl, 2H) 1320 m(NO
2
)
s
N 17.07 N 16.89 7.8 (dd, 1 H, phenyl, 6H) 870 m(C-N)
7.3 (d, 1 H, phenyl, 5H)
898 E. Monzani et al.(Eur. J. Biochem. 271) Ó FEBS 2004
prepared from fresh stock solutions. The reactions were
carried out under pseudo-first-order conditions and followed
by monitoring the disappearance of compound II with time
(readings every 0.1 s). The rate constants (k
obs
)were
determined from the changes in the difference of absorbance
(A
402
–A
420
) with time, which were fitted to a first-order
equation. The replots of k
obs
versus [phenol] were linear and
the slopes gave the catalytic constants.
Stopped-flow experiments
The reaction between LPO, nitrite and H
2
O
2
was followed in
a stopped-flow apparatus using an optical cell of path length
0.5 cm; one of the syringes was filled with a solution of the
enzyme (5.4 l
M
) and NaNO
2
(20 or 300 m
M
) in 200 m
M
phosphate buffer (pH 7.5) at 25 °C. The other syringe was
filled with H
2
O
2
(1.7 m
M
). Mixing of the two solutions in the
reaction cuvette reduced the concentration of the reactants
to one half. Control experiments were carried out without
peroxide and with either one tenth or twofold concentration
of the oxidant. In analogous experiments performed with
HRP, a path length of 0.2 cm was used; one of the syringes
was filled with a solution of the enzyme (75 l
M
)andNaNO
2
(2
M
or 50 m
M
) in the same buffer as above. The other
syringe was filled with H
2
O
2
(2.0 m
M
). Control experiments
were carried out without peroxide.
Nitrate assay
The determination of nitrate formed competitively by the
enzymatic reaction with nitrite and hydrogen peroxide in
various conditions was carried out using a Metrohm IC ion
chromatograph (Metrohn AG, Switzerland) with a Super-
Sep column at a 1 mLÆmin
)1
flow rate. All the experiments
were performed in triplicate. In a typical experiment, 10 m
M
sodium nitrite was allowed to react for 20 min with 0.8 m
M
hydrogen peroxide in the presence of 5 m
M
2 and 10 n
M
LPO in 20 m
M
phosphate buffer (higher buffer concentra-
tions reduce the sensitivity of nitrate determination) pH 7.5,
at 25 °C. Then, the sample was diluted tenfold in double
distilled water and injected into the column. Other experi-
ments were performed without enzyme, in the absence or
presence of substrate (55 m
M
),andwith140m
M
nitrite and
2m
M
hydrogen peroxide.
Binding experiments
The binding of nitrite to LPO and HRP was studied
spectrophotometrically, by following the spectral changes
upon addition of small aliquots of a concentrated NaNO
2
solution in 200 m
M
phosphate buffer (pH 7.5) to the enzyme
solution in the same buffer, at 25 ± 0.1 °C. No attempts
were made to keep the ionic strength constant. With LPO
(6 · 10
)6
M
), a1
M
stock nitrite solutionand an opticalcell of
1 cm path length were used. In the case of HRP (6 · 10
)5
M
),
the binding process exhibited biphasic behavior and, in order
to reach saturation in the second step, the titration was per-
formed using a more concentrated solution of NaNO
2
(4
M
)
in a cell with a smaller path length (0.1 cm). The spectral data
were analyzed, after subtraction of the absorption due to free
nitrite, as described previously [30] to obtain equilibrium
constants and stoichiometry of adduct formation.
Differential pulse voltammetry
Polarographic experiments on substrates 2 and 4 were
performed at room temperature in 200 m
M
phosphate
buffer (pH 7.5), using an Amel model 591/ST Polarograph
coupled with an Amel 433 Trace Analyzer, with a glassy
carbon electrode and an Ag/AgCl/KCl saturated reference
electrode. The scans were performed from 300 to 1200 mV
using a differential pulse voltammetry of 100 mVÆs
)1
and a
pulse amplitude of 50 mV. The redox potential measured
polarographically corresponds to the transformation of the
phenols to the corresponding phenoxide radicals; the values
of 840 mV (versus Ag/AgCl/KCl saturated) for 4 and
790 mV for 2 were found. Voltammeric oxidation of
phenols causes passivation of the electrode surface that
results in rapidly diminishing voltammetric curve response
and enlarged peaks. For this reason, the absolute values of
the oxidation potentials of the compounds investigated may
be affected by experimental conditions (electrode surface,
pH and concentration of the solutions). However, the
differences between the values of the oxidation potentials
found are significant because they were obtained in the same
experimental conditions.
HPLC analysis of the nitration products
The product mixtures derived from the chemical or
enzymatic nitration of compounds 1–4 and phenylacetic
acid (5) were analyzed by HPLC using a Jasco MD-1510
instrument with diode array detection and a Supelco LC18
reverse-phase semipreparative column (250 · 10 mm;
Sigma-Aldrich). Elution was carried out using 0.1%
trifluoroacetic acid in distilled water (solvent A) and 0.1%
trifluoroacetic acid in acetonitrile (solvent B), with a flow
rate of 5 mLÆmin
)1
. Elution started with 100% solvent A
for 4 min, followed by a linear gradient from 100% A to
100% B in 20 min. Spectrophotometric detection of the
eluate was performed in the range 200–600 nm.
Reaction of 2 and 4 with peroxynitrite
Solutions of the phenol (2 or 4) (1 m
M
) in 200 m
M
phosphate buffer (pH 7.5) were treated with five- or tenfold
molar excess peroxynitrite for 5 min at room temperature.
The reaction mixtures were analyzed by HPLC as described
above. The retention times of 2 and 4 were 11.5 and
12.7 min, respectively, and those of the corresponding
nitration products, 3-(4-hydroxy-3-nitrophenyl)-propionic
acid and 4-hydroxy-3-nitrobenzonitrile, were 13.9 and
15.7 min, respectively. The identity of the products was
checked by comparison with the spectra of authentic
samples. Yields of nitration products were estimated from
the extinction coefficients of the phenolic derivatives and the
peak areas in the HPLC chromatograms.
Nitration of phenylacetic acid, 5
CO
2
-free peroxynitrite. A solution of 5 was purged with
argonfor20minandthenreactedwithtenfoldmolarexcess
peroxynitrite. HPLC analysis of the reaction mixture
showed, as well as unreacted 5, five minor peaks with
retention times of 9.9, 10.1, 10.4, 12.2 and 12.4 min.
Ó FEBS 2004 Peroxidase catalyzed nitration (Eur. J. Biochem. 271) 899
Peroxynitrite-CO
2
. A solution of 5 (1 m
M
) in 200 m
M
phosphate buffer (pH 7.5), equilibrated with atmospheric
CO
2
, was treated with five- or tenfold molar excess
peroxynitrite for 5 min at room temperature, and then
analyzed by HPLC. The chromatogram contained only
one peak corresponding to 5, with a retention time of
11.6 min.
Peroxidase/H
2
O
2
/NO
2
–
. The catalytic nitrations of 5
were performed under the following experimental condi-
tions: HRP (30 n
M
), [5] ¼ 1m
M
,[H
2
O
2
] ¼ 0.4 m
M
,
[NaNO
2
] ¼ 0, 0.025, 0.25 or 2
M
;LPO(50n
M
),
[5] ¼ 1m
M
,[H
2
O
2
] ¼ 1.3 m
M
,[NaNO
2
] ¼ 0, 0.025 or
0.25
M
. Analysis of the product mixtures resulting from
the reactions carried out in the presence of high nitrite
concentrations (2
M
for HRP and 0.25
M
for LPO) showed
extensive modification of substrate 5. The HPLC chroma-
togram showed two main peaks at 11.1 and 11.3 min,
and minor peaks for unreacted 5 and six other products
with retention times of 9.9, 10.4, 11.8, 12.0, 12.2 and
12.4 min.
Formation of phenol dimers by the HRP/H
2
O
2
/NO
2
–
system
The phenol dimers formed by the HRP/H
2
O
2
/NO
2
–
system
during the nitration of 1 and 2 were analyzed by HPLC in
the same conditions as reported in a previous work [31]. The
reactions were performed in 200 m
M
phosphate buffer
(pH7.5)at25°C in the presence of 30 n
M
HRP and
variable nitrite concentration (0, 0.2, and 1.0
M
). The
other reagents were as follows: with [1] ¼ 13.0 m
M
,
[H
2
O
2
] ¼ 1.6 m
M
;with[2] ¼ 5.0 m
M
,[H
2
O
2
] ¼ 3.0 m
M
.
Results
Steady-state kinetics
The kinetics of phenol nitration were studied by following
the characteristic absorption near 420 nm of the nitrophen-
ols in neutral medium. At this wavelength the interference
by the phenolic dimers formed according to the normal
peroxidase reaction [25–27] is completely negligible. The
enzymatic nitration reaction of phenols 1–4 was studied as a
function of both the phenol and nitrite concentrations, with
the other reagents saturating, except for the HRP experi-
ments, where saturating nitrite concentrations were too
high. In these cases, the kinetics were studied at a nitrite
concentration corresponding to % 60% saturation. With
both LPO and HRP, the rate of the enzymatic reaction
exhibits a hyperbolic dependence on the concentration of
the phenols. A more complex behavior was found when
the rate dependence was studied as a function of nitrite
concentration. For substrates 1–3,theLPOmediated
reactions exhibited a normal saturation behavior, while
the HRP mediated reactions were biphasic (Fig. 1). With
substrate 4, inhibition was observed for both LPO and HRP
at moderate concentrations of nitrite (Figs 2 and 3). The
saturation behavior found for 1–3 is not due to nitrite
inhibition on the peroxide involving step, as this should
be connected to a change in the slow step; instead, the rate
does not increase on increasing peroxide concentration.
These findings indicate that an efficient nitration reaction
requires the interaction of the enzyme with both nitrite and
phenol.
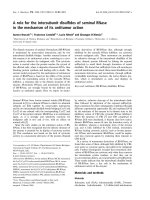
Fig. 1. Biphasic behavior of the rate of HRP-mediated phenol nitration
as a function of nitrite concentration. Rate dependence of HRP-cata-
lyzed nitration of 2 on nitrite concentration in 200 m
M
phosphate
buffer (pH 7.5), at 25 °C. The inset shows an expansion of the plot in
the low nitrite concentration range.
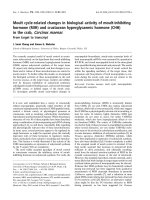
Fig. 2. Inhibition of the LPO-mediated phenol nitration by nitrite. Plot
of the rate of LPO-catalyzed nitration of phenol 4 as a function of
nitrite concentration in 200 m
M
phosphate buffer (pH 7.5), at 25 °C.
The inset shows an expansion of the plot in the low nitrite concen-
tration range.
Fig. 3. Inhibition of the HRP-mediated phenol nitration by nitrite. Plot
of the rate of HRP-catalyzed nitration of phenol 4 as a function of
nitrite concentration in 200 m
M
phosphate buffer (pH 7.5), at 25 °C.
The inset shows an expansion of the plot in the low nitrite concen-
tration range.
900 E. Monzani et al.(Eur. J. Biochem. 271) Ó FEBS 2004
The experimental data can be interpreted considering two
simplified mechanisms, which differ with respect to the
active species involved and for the dependence on the
oxidant concentration. The first mechanism, pathway A
(Scheme 1), considers that product formation follows
reactions 9–14 (corresponding to reactions 1–5 shown
above). Compound I and compound II react with nitrite
or the phenol generating free diffusible radicals [16]. The
nitrating agent is thus NO
2
, which can be derived from
either compound I or compound II. The observation of
substrate saturation behavior indicates that, even if NO
2
could react with free phenol, the reaction is faster when the
phenoxy radical is formed by direct reaction with com-
pound I or compound II.
E þ H
2
O
2
! compound I þ H
2
O (fast) ð9Þ
compound I þ NO
2
À
, compound I=NO
2
À
! compound II þ NO
2
ð10Þ
compound I þ PhOH , compound I=PhOH
! compound II þ PhO
þ H
þ
ð11Þ
compound II þ NO
2
À
, compound II=NO
2
À
À!
2H
þ
E þ NO
2
þ H
2
O ð12Þ
compound II þ PhOH , compound II=PhOH
À!
2H
þ
E þ PhO
2
þ H
2
O ð13Þ
PhO
þ NO
2
! O
2
NÀPhOH ð14Þ
Scheme 1. Pathway A mechanism.
The PhO
•
produced can also give rise to dimeric coupling
products through the normal peroxidase catalytic cycle
[25–27]:
2PhO
! dimers ð15Þ
The second mechanism (pathway B), represented in
Scheme 2, where E–NO
2
–
is the peroxidase-nitrite complex
and E
nitr
the nitrating active species. This mechanism first
considers binding of nitrite to the iron center of the protein.
Upon reaction of this complex with hydrogen peroxide, E
nitr
is formed in a fast step. While in the absence of the phenol,
E
nitr
degrades to E and nitrate (or performs nitration of
protein residues), in the presence of bound substrate, the
formation of O
2
N–PhOH competes with the degradation.
The interaction of the protein with the substrate can precede
the interaction with peroxide and even with nitrite, without
altering the essence of the mechanism.
E þ NO
2
À
, EÀNO
2
À
ð16Þ
EÀNO
2
À
þ H
2
O
2
! E
nitr
þ H
2
O ðfastÞð17Þ
E
nitr
þ PhOH ,½E
nitr
ÀPhOHÀ!
2H
þ
E þ O
2
NÀPhOH
þ H
2
O ð18Þ
Scheme 2. Pathway B mechanism.
Species derived from E
nitr
may also react with free PhOH,
generating phenoxyl radical and thus dimers (according to
reaction 15). Although we could not determine the rate of
the competitive dimer formation due to the strong nitrite
absorption in the same region as the dimers absorb
(% 300 nm), HPLC analysis of the product mixture after
reaction of 1 or 2 with the system peroxidase/NO
2
–
/H
2
O
2
shows that, while phenol dimers are formed at every nitrite
concentration, the relative amount of dimers versus nitro-
phenol strongly decreases upon increasing [NO
2
–
] (data not
shown). This indicates that reaction 15 competes with
reactions 14 and 18 only at low nitrite concentration.
The two nitrating mechanisms can be simultaneously
operative, the first one predominating at low and the
second at high nitrite concentration. When peroxide
concentration is high, the steps involving H
2
O
2
can be
considered fast. In these conditions, pathway A can be
described as a ping-pong mechanism [32], leading to the
rate equation:
r ¼
k
cat
½E
1 þ
K
nitrite
M
½NO
2
À
þ
K
PhOH
M
½PhOH
ð19Þ
where k
cat
represents the turnover rate of enzymatic
nitration, and K
nitrite
M
and K
PhOH
M
are the Michaelis constants
for nitrite and the phenol, respectively.
The fraction of the enzyme involved in pathway B is
ruled by the nitrite concentration, through the pre-equilib-
rium binding of reaction 16. Thus, because the rate
determining step of the turnover is reaction 18, the initial
rate equation for pathway B is:
r ¼
k
cat
½E
1 þ
K
nitrite
M
½NO
2
À
Á 1 þ
K
PhOH
M
½PhOH
ð20Þ
where here K
nitrite
M
is connected to the reciprocal of the
binding constant of reaction 16.
The primary kinetic data can be further simplified to
conventional Michaelis–Menten kinetics under conditions
in which either the term K
nitrite
M
=½NO
2
or the term
K
PhOH
M
=½PhOH become negligible, i.e. as stated above,
operating with saturating (or almost saturating) nitrite or
phenol concentrations, respectively. It should be noted that
the biphasic behavior observed in the plot of rate versus
[NO
2
–
] (Fig. 1), is due both to the presence of the two
nitration mechanisms and to dimer production in the low
nitrite concentration range. The kinetic parameters for the
catalytic reactions by LPO and HRP are collected in
Tables 4 and 5. The actual enzymatic turnover rates are
somewhat larger because part of the enzyme is engaged in
the nonproductive nitrate formation. For the nitrite inhib-
ited reactions of substrate 4 an estimate of the bimolecular
rate constants corresponding to the linear part of the plots
in Fig. 2, at low nitrite concentration, was obtained
(Table 5). Also, from the decreasing portion of the rate
versus nitrite concentration plots, the following values of
the inhibition constants were estimated: for LPO
K
I
¼ 20 ± 7
M
)1
,forHRPK
I
¼ 50 ± 5
M
)1
.
For comparison purposes we determined the kinetic
parameters for the LPO and HRP catalyzed oxidation of
4 to dimeric coupling products in the presence of hydrogen
peroxide, as this particular phenolic substrate was not
included in our previous studies [25–27]. The following
results were obtained (pH 7.5): with LPO, k
cat
¼ 16 ± 2 s
)1
Ó FEBS 2004 Peroxidase catalyzed nitration (Eur. J. Biochem. 271) 901
and K
M
¼ 11 ± 1 m
M
;withHRP,k
cat
¼ 19 ± 2 s
)1
and
K
M
¼ 20 ± 4 m
M
.
Nitrite binding
Nitrite forms six coordinated, low-spin adducts with the
iron(III) centers of HRP [33] and LPO [34]. When studied in
the conditions used in our kinetic experiments (pH 7.5), the
spectra of these adducts displayed the following optical
features: for HRP–NO
2
–
, k
max
¼ 416 (e 100 m
M
)1
Æcm
)1
),
534 (e 13.9 m
M
)1
Æcm
)1
)and576nm(e 9.8 m
M
)1
Æcm
)1
);
for LPO–NO
2
–
, k
max
¼ 424 (e 101 m
M
)1
Æcm
)1
), 546
(e 11.4 m
M
)1
Æcm
)1
) and 588 nm (e 8.5 m
M
)1
Æcm
)1
). Spectra
taken during titration of an LPO solution with nitrite
exhibited several isosbestic points, at 420, 482, 524 and
600 nm. Fitting of the data gave a binding constant
K
b
¼ 22.0 ± 0.5
M
)1
. In the case of HRP, the changes in
the protein spectrum with the addition of the ligand are
biphasic, with modest changes at low nitrite concentrations,
and do not show isosbestic points. This behavior can be
accounted for by the binding of two nitrite ions to HRP, the
first one affects marginally the heme environment, probably
through electrostatic interactions with polar amino acid
residues in the active site, while the second anion binds to
the iron. An estimate of the binding constant for the latter
step gave K
b
¼ 1.3
M
)1
(data not shown).
Nitrate production
Both nitrating species formed according to mechanisms A
and B can undergo competitive degradation to nitrate.
Table 6 shows the amount of nitrate produced in various
experimental conditions. In the absence of enzyme, nitrate
formation at pH 7.5 is negligible within the time of the
experiment. In the presence of LPO, the amount of nitrate
produced corresponds to 80% of the hydrogen peroxide
oxidizing equivalents. If 2 is added at a concentration that
gives saturation in the steady-state kinetic experiments, the
amount of nitrate produced decreases to 50% of the
peroxide added. Further addition of phenol, up to 55 m
M
,
does not affect the yield of NO
3
–
in the reaction. In addition,
increasing nitrite concentration from a value below satura-
tion (10 m
M
) to an almost saturating value (140 m
M
) does
not change the yield of NO
3
–
. These findings indicate that
nitrate is formed by degradation of peroxidase-generated
reactive nitrogen species; in the presence of substrate,
nitrophenol formation competes with NO
3
–
formation.
Reduction of peroxidase compound II by substrates
In a recent study, reduction of LPO compound II by nitrite
wasreportedtobefast(3.5· 10
5
M
)1
Æs
)1
at pH 7.2) [21].
We found that nitrite is much less efficient in the reduction
of HRP compound II, because the bimolecular rate
constant for this reaction is 6.6 ± 0.4
M
)1
Æs
)1
at pH 7.5
Table 5. Kinetic data as a function of nitrate concentration for the enzymatic nitration of tyrosine derivatives 1–4. Steady-state kinetic parameters
determined for the LPO and HRP mediated nitration of 1–4 by nitrite and hydrogen peroxide as a function of nitrite concentration, in 0.2
M
phosphate buffer, pH 7.5 at 25 °C.
Phenol
LPO HRP
K
nitrite
M
(m
M
)
k
cat
(s
)1
)
k
cat
=K
nitrite
M
(
M
)1
Æs
)1
)
K
nitrite
M
(m
M
)
k
cat
(s
)1
)
k
cat
=K
nitrite
M
(
M
)1
Æs
)1
)
1 48 ± 5 380 ± 15 7.9 · 10
3
1600 ± 200 500 ± 30 3.0 · 10
2
2 30 ± 3 135 ± 5 4.5 · 10
3
1600 ± 170 580 ± 30 3.6 · 10
2
3 16 ± 1 80 ± 2 5.0 · 10
3
1200 ± 200 13 ± 1 11
4 3.6 · 10
4
3.5 · 10
4
Table 6. Competitive production of nitrate during enzymatic nitration.
Nitrate produced by the LPO/NO
2
–
/H
2
O
2
system in the presence of
different concentrations of nitrite, phenol 2 and hydrogen peroxide,
after 20 min reaction in 20 m
M
phosphate buffer, pH 7.5, at 25 °C.
LPO
(l
M
)
Phenol 2
(m
M
)
NO
2
–
(m
M
)
H
2
O
2
(m
M
)
NO
3
–
(m
M
)
0 5 10 0.8 0.01 ± 0.01
0.1 0 10 0.8 0.67 ± 0.02
0.1 5 10 0.8 0.39 ± 0.01
0.1 55 10 0.8 0.40 ± 0.02
0.1 10 140 0.8 0.40 ± 0.03
0.1 10 10 2 1.36 ± 0.01
Table 4. Kinetic data as a function of phenol concentration for the enzymatic nitration of tyrosine derivatives 1–4. Steady-state kinetic parameters
determined for the LPO and HRP mediated nitration of 1–4 by nitrite and hydrogen peroxide as a function of phenol concentration, in 0.2
M
phosphate buffer, pH 7.5 at 25 °C.
PhOH
LPO HRP
K
PhOH
M
(m
M
)
k
cat
(s
)1
)
k
cat
=K
PhOH
M
(
M
)1
Æs
)1
)
K
PhOH
M
(m
M
)
k
cat
(s
)1
)
k
cat
=K
PhOH
M
(
M
)1
Æs
)1
)
1 0.12 ± 0.01 380 ± 10 3.2 · 10
6
6.8 ± 0.7 390 ± 10 5.7 · 10
4
2 0.14 ± 0.02 130 ± 5 9.4 · 10
5
1.1 ± 0.2 510 ± 30 4.6 · 10
5
3 0.11 ± 0.01 75 ± 2 6.8 · 10
5
0.8 ± 1 17 ± 2 2.0 · 10
4
4 15 ± 1 60 ± 4 3.8 · 10
3
40 ± 8 80 ± 10 2.0 · 10
3
902 E. Monzani et al.(Eur. J. Biochem. 271) Ó FEBS 2004
(a value of 13.3
M
)1
Æs
)1
was reported previously for this
reaction at pH 7.0 [35]). Data on the rate of reduction of
LPO compound II [36] and HRP compound II by several
phenols [37,38] are available in the literature, although
sometimes they disagree, possibly because different condi-
tions were employed. We determined here the rate constants
of LPO and HRP compound II reduction by the represen-
tative substrates 3, obtaining the values of (9.4 ± 0.1) · 10
3
and (1.1 ± 0.1) · 10
3
M
)1
Æs
)1
, respectively, and 4, obtain-
ing (4.5 ± 0.1) · 10
3
and (9.3 ± 0.3) · 10
3
M
)1
Æs
)1
,
respectively, at pH 7.5 and 25 °C.
Stopped-flow experiments
Because of the relatively large enzyme concentration
required in these experiments, all the attempts to monitor
the spectrum of the enzymatic species was prevented, even in
the early phase of the reaction, by the very fast development
of prominent absorptions of the nitrophenolic products,
which cover the protein Soret band. Therefore, the spectrum
of LPO and HRP could only be monitored when the
enzymes were treated with nitrite and hydrogen peroxide in
the absence of phenols. Using LPO and saturating nitrite
(150 m
M
), upon addition of hydrogen peroxide (0.85 m
M
)
the Soret band, initially at 425 nm, shifted to 422 nm in a
few seconds, with an isosbestic point at 424 nm (Fig. 4).
The final spectrum is most likely due to a LPO–NO
2
–
derivative in which the protein has been modified by
nitration of some endogenous tyrosine residue(s). The
formation rate of the band at 422 nm is the same as the
rate of disappearance of the band at 425 nm, with an
apparent first-order behavior (k
obs
¼ 3.2 ± 0.2 s
)1
). If a
phenol is added to the solution a few seconds after mixing,
no substrate nitration is observed. The nitration is instead
observed if hydrogen peroxide is added together with the
substrate. These findings indicate that, during the transfor-
mation, all the peroxide is consumed. When the experiment
was performed with a subsaturating nitrite concentration,
after mixing the enzyme solution with peroxide, the spectra
of the iron(III) form of the enzyme (with a weak shoulder at
longer wavelength) was observed. The same feature was
observed using a tenfold larger peroxide concentration.
With HRP, either using saturating or subsaturating nitrite
concentrations, upon addition of hydrogen peroxide, the
spectrum of compound II was invariably observed
(k
max
¼ 422 nm).
Reaction of 2 and 4 with peroxynitrite
The reaction of excess peroxynitrite with 2 and 4 was
studied in comparative experiments in 200 m
M
phosphate
buffer (pH 7.5). The reactions yield the same nitration
products as in the enzymatic reaction, but the behavior of
the two phenolic compounds is different. Compound 2 was
almost completely nitrated by five or 10 molar equivalents
peroxynitrite, with estimated conversions of 90 and 98%,
respectively. In the same conditions, the reactivity of phenol
4 is almost negligible, the maximum yield of 4-hydroxy-3-
nitrobenzonitrile amounting to less than 5%.
Nitration of 5
Phenylacetic acid was used as a probe for various nitrating
agents in 200 m
M
phosphate buffer (pH 7.5). Bolus addi-
tions of several volumes of nitrogen dioxide to solutions of 5
did not yield any nitration products. When 5 was reacted
with peroxynitrite in the absence of carbon dioxide several
products due to nitration, hydroxylation, or both, were
observed. In the presence of carbon dioxide, nitration by
peroxynitrite was quenched. The reactions of peroxidase/
H
2
O
2
/NO
2
–
on 5 were found to be dependent on nitrite
concentration. At low nitrite concentration (25 m
M
)no
reaction was observed; with higher nitrite concentrations
(0.25
M
for LPO, 2
M
for HRP), a complex mixture of
products was formed. When the reaction was carried out
with an intermediate concentration of nitrite, the number
of products and their yields were reduced. These complex
mixtures contained the same products formed by the
peroxynitrite reaction.
Discussion
In several diseases, the level of 3-nitrotyrosine increases in
human tissues and fluids due to the formation of nitrating
agents that modify the tyrosines. In vitro, the nitration
reaction can occur according to several pathways and with
different nitrating agents. Therefore, more than a single
pathway can also be operative in vivo [40]. The ability of the
peroxidase/H
2
O
2
system to oxidize NO
2
–
to NO
2
is well
known [11] and the latter is thought to be responsible for
phenol nitrations catalyzed by LPO, myeloperoxidase and
HRP [12,16]. So far, peroxynitrite has been excluded as
nitrating agent by the analysis of
15
N CIDNP experiments
[16], and due to the absence of hydroxylated phenylalanine
residues in the products, while NO
2
+
has not been
considered due to its fast degradation in solution [12].
Nonetheless, if the active species does not diffuse into the
solution, but reacts with the substrate bound close to the
active site, nitration by these species could occur before their
degradation is complete. Our study focused on the systems
of LPO/NO
2
–
/H
2
O
2
and HRP/NO
2
–
/H
2
O
2
.Bothareable
to perform the nitration of phenols with, particularly in the
first case, high efficiency. Phenol dimers are also formed
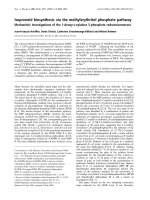
Fig. 4. Spectral changes of LPO upon reaction with nitrite and hydrogen
peroxide. UV/Vis spectral changes observed with time upon reacting
LPO (2.7 l
M
)andnitrite(150m
M
)withH
2
O
2
(0.85 m
M
) in 200 m
M
phosphate buffer (pH 7.5), at 25 °C. The reaction was followed with a
0.1–2.0 s time scale in a stopped-flow apparatus (0.5 cm path length
cell).
Ó FEBS 2004 Peroxidase catalyzed nitration (Eur. J. Biochem. 271) 903
competitively, but the importance of this reaction decreases
upon increasing [NO
2
–
]. It is worth noting, in this respect,
that the k
cat
/K
M
values associated with dimer formation in
the normal peroxidase cycle [25,26] are much smaller than
the k
cat
=K
PhOH
M
for nitration (Table 1). Therefore, the dimers
produced when a large amount of nitrite is present are
probably derived from phenoxy radicals generated by the
nitrating species. The difference in k
cat
=K
PhOH
M
for phenol
nitration and dimer formation depends largely on the K
PhOH
M
values, which are much smaller for nitration (Table 4) than
for dimer formation in the normal peroxidase reaction (up
to two orders of magnitude smaller for tyrosine) [24–26].
This indicates that in the presence of nitrite, the binding sites
involved in the two reactions are different. A close proximity
between the phenol and the porphyrin is necessary for the
electron transfer that produces a phenoxy radical in the
normal peroxidase reaction, while in the nitration process
the phenol does not need to approach the heme as closely,
because it may simply interact at the protein surface.
The k
cat
values for the enzymatic nitration of 1–3 do not
follow the substrate redox potentials (for the couple
phenoxy radical/phenol), which decrease in the order
3 > 1 > 2 (with values of E
p
of 900, 830 and 810 mV
versus Ag/AgCl/KCl saturated in acetate buffer, pH 5,
respectively) [27], indicating that these parameters are
influenced by the substrate disposition in the enzyme–
substrate complex. As expected, the k
cat
values obtained
from the rate dependence on nitrite concentration (Table 5)
are similar to those obtained varying the phenol concentra-
tion. The corresponding K
nitrite
M
values are connected to the
affinity of nitrite for the protein site where it is transformed
into the nitrating species, in the presence of the phenol.
Interestingly, these constants resemble the reciprocal of the
nitrite binding constants to the proteins.
According to Schemes 1 and 2, the nitrating species
produced by the enzyme is either NO
2
,formedby
compound I or II and nitrite (pathway A), or E
nitr
formed
by the enzyme–nitrite complex and H
2
O
2
in pathway B. For
LPO, the reaction of compound I with nitrite is extremely
fast (% 2 · 10
7
M
)1
Æs
)1
) and produces nitrate instead of
NO
2
[21]. The reaction between LPO–NO
2
–
and H
2
O
2
also
does not produce NO
2
, as this would yield compound II,
but instead a nitrating species with optical features (Soret
band at 425 nm) similar to LPO–NO
2
–
.Weattributethis
species to a complexed peroxynitrite:
EÀNO
2
À
þ H
2
O
2
! EÀN(O)OO
À
þ H
2
O ð21Þ
because the alternative formation of NO
2
+
would produce
the iron(III) form of the enzyme, which has markedly
different optical features. Therefore, the enzymatic nitration
by LPO can only proceed through pathway A at low
concentrations of nitrite, where one-electron reduction of
compound I is due to the phenolic substrate, reduction of
compound II is due to nitrite, and nitrophenol is formed by
reaction 14. In other conditions, pathway B is preferred by
this enzyme. For the HRP mediated nitration, NO
2
is the
major nitrating agent, but also in this case the peroxynitrite
pathway cannot be completely excluded. Compound I can
be competitively reduced by nitrite (k ¼ 6.7 · 10
5
M
)1
Æs
)1
at pH 6.9 [41]) or the phenol (k % 10
5
)10
6
M
)1
Æs
)1
[42]), but
reduction of compound II can only occur by reaction with
the phenolic substrate (k % 10
3
)10
6
M
)1
Æs
)1
[43]) to support
an efficient mechanism. In fact, reduction of HRP com-
pound II by nitrite (reaction 12) is a slow process, with a
second-order rate constant of 6.6 ± 0.4
M
Æs
)1
,whichis
much smaller than the k
cat
=K
nitrite
M
values for nitration of all
the substrates (Table 5). It is thus conceivable that nitrations
mediated by HRP proceed through pathway A up to
moderate concentrations of nitrite. At high nitrite concen-
tration, pathway B becomes dominant also for this enzyme,
and the biphasic behavior observed in the rate dependence
on nitrite concentration testifies to the change in the
mechanism.
The presence of phenol dimers in the enzymatic nitra-
tions, even at high nitrite concentrations, does not contrast
with the complexed peroxynitrite nature of the species E
nitr
.
In fact,
15
N chemical induced dynamic nuclear polarization
experiments showed that nitrophenol formation by reaction
between tyrosine and peroxynitrite also occurs through the
coupling of nitrogen dioxide and tyrosyl radical [44]. In
addition, the large amount of nitrate accompanying the
LPO catalyzed nitration reaction can be accounted for by
the promotion of peroxynitrite isomerization by iron(III)
porphyrin systems [45].
Cyanophenol 4 is a good mechanistic probe for the
enzymatic nitration. The higher redox potential makes
oxidation and nitration of this compound by peroxidases
more difficult than for 1–3. The behavior of 4 differs from
that of the other substrates in two respects. The K
PhOH
M
value
for nitration of 4 is in the same range as those found in the
normal LPO and HRP mediated peroxidase reactions. This
indicates that 4 binds to the enzymes in a similar manner in
both types of reactions, i.e. close to the heme [25]. In
addition, the enzymatic nitration is inhibited by excess
nitrite, i.e. in conditions where the peroxynitrite pathway is
favored. As shown by independent experiments, peroxyni-
trite is a poor nitrating agent for this substrate. The
enzymatic nitration of 4 can therefore proceed only through
the NO
2
pathway.
In contrast, phenylacetic acid is a good probe for
peroxynitrite. It is known that 5 reacts with peroxynitrite
to form nitrophenyl and also nitrophenol derivatives, while
the reaction is blocked in the presence of CO
2
[46]. We
found that 5 is unreactive both to NO
2
and the peroxidase/
H
2
O
2
/NO
2
)
system in conditions where the predominant
mechanism is through NO
2
, i.e. at low [NO
2
–
]. Though, at
high [NO
2
–
], the enzymatic systems produce several nitrated
and hydroxylated products independently of the presence of
CO
2
. This clearly indicates that in the latter conditions a
nitrating agent is produced (E
nitr
) and this behaves like
peroxynitrite. The lack of effect by CO
2
further shows that
the reaction occurs within the protein and is due to iron-
bound peroxynitrite and not to free peroxynitrite.
The observation that the peroxidase/H
2
O
2
/NO
2
–
system
can proceed through two competing mechanisms raises the
question of whether, at least for LPO, this may have
physiological relevance. At the low nitrite concentration
present in the body most of the enzyme should work
through pathway A. However, because pathway B is much
more efficient, even a small fraction of the enzyme acting
through the bound peroxynitrite intermediate could account
for a large fraction of the nitrophenol produced. In order to
assess this point, we can compare the rate of nitration of
tyrosine obtained at 100 l
M
nitrite concentration (a condi-
904 E. Monzani et al.(Eur. J. Biochem. 271) Ó FEBS 2004
tion observed during inflammatory processes [12]) with the
rate extrapolated from the kinetic data reported in Table 5
ðrate=½enzyme
extrapolated
¼ k
cat
=K
nitrite
M
½NO
2
À
Þ: As the
latter values are obtained from kinetic measurements at high
[NO
2
–
], they refer mostly to pathway B. The rate determined
for tyrosine nitration by LPO (rate/[LPO]
exp
¼ 0.48 s
)1
)
compares with that obtained from extrapolation (rate/
[LPO]
extrapolated
¼ 0.50 s
)1
), while the rate determined for
HRP is more than one order of magnitude larger than
that extrapolated (rate/[HRP]
exp
¼ 0.021 s
)1
versus rate/
[HRP]
extrapolated
¼ 0.0011 s
)1
). These results indicate that at
physiological concentration of nitrite, with LPO, at least part
of the nitration reaction occurs through the bound peroxy-
nitrite species, whereas with HRP, NO
2
Æ
is by far the major
nitrating agent.
Acknowledgements
This work was supported by the Italian CNR (Target Project
ÔBiotechnologyÕ) and MIUR (through PRIN), and by the European
INTAS and COST Chemistry programmes. We thank Petr Latal (ETH
Zu
¨
rich) for the nitrate assay measurements, Reinhard Kissner (ETH
Zu
¨
rich) and Angelo Taglietti (University of Pavia) for assistance in the
stopped-flow experiments, and Antonella Profumo (University of
Pavia) for the determination of the redox potential of the phenolic
compounds.
References
1. Mohsenin, V. (1994) Human exposure to oxides of nitrogen at
ambient and supra-ambient concentrations. Toxicology 89,301–
312.
2. Stamler, J.S. & Feelisch, M. (1996) Biochemistry of nitric oxide
and redox-related species. In Methods in Nitric Oxide Research
(Feelisch, M. & Stamler, J.S., eds), pp. 19–27. Wiley, Chichester,
UK.
3. Moncada, S., Palmer, R.M.J. & Higgs, E.A. (1991) Nitric oxide:
physiology, pathophysiology, and pharmacology. Pharmacol.
Rev. 43, 109–142.
4. Beckman, J.S. & Koppenol, W.H. (1996) Nitric oxide, superoxide,
and peroxynitrite: the good, the bad, and the ugly. Am.J.Physiol.
271, C1424–C1437.
5. Stamler, J.S., Lamas, S. & Fang, F.C. (2001) Nitrosylation: The
prototypic redox-based signaling mechanism. Cell 106, 675–683.
6. Kelm, M. & Yoshida, K. (1996) Metabolic fate of nitric oxide and
related N-oxides. In Methods in Nitric Oxide Research (Feelisch,
M. & Stamler, J.S., eds), pp. 47–58. Wiley, Chichester, UK.
7. Torre,D.,Ferrario,G.,Speranza,F.,Orani,A.,Fiori,G.P.&
Zeroli, C. (1996) Serum concentrations of nitrite in patients with
HIV-1 infection. J. Clin. Pathol. 49, 574–576.
8. Hunt, J., Byrns, R.E., Ignarro, L.J. & Gaston, B. (1995) Con-
densed expirate nitrite as a home marker for acute asthma. Lancet
346, 1235–1236.
9. Klebanoff, S.J. (1993) Reactive nitrogen intermediates and anti-
microbial activity: role of nitrite. Free Radicals Biol. Med. 14,
351–360.
10. Eiserich, J.P., Cross, C.E., Jones, A.D., Halliwell, B. & van der
Vliet, A. (1996) Formation of nitrating and chlorinating species by
reaction of nitrite with hypochlorous acid. A novel mechanism for
nitric oxide-mediated protein modification. J. Biol. Chem. 271,
19199–19208.
11. Shibata, H., Kono, Y., Yamashita, S., Sawa, Y., Ochiai, H. &
Tanaka, K. (1995) Degradation of chlorophyll by nitrogen dioxide
generated from nitrite by the peroxidase reaction. Biochim. Bio-
phys. Acta 1230, 45–50.
12. van der Vliet, A., Eiserich, J.P., Halliwell, B. & Cross, C.E. (1997)
Formation of reactive nitrogen species during peroxidase-cata-
lyzed oxidation of nitrite. J. Biol. Chem. 272, 7617–7625.
13. Sampson, J.B., Ye, Y.Z., Rosen, H. & Beckman, J.S. (1998)
Myeloperoxidase and horseradish peroxidase catalyze tyrosine
nitration in proteins from nitrite and hydrogen peroxide. Arch.
Biochem. Biophys. 356, 207–213.
14. Eiserich, J.P., Hristova, M., Cross, C.E., Jones, A.D., Freeman,
B.A., Halliwell, B. & van der Vliet, A. (1998) Formation of nitric
oxide-derived inflammatory oxidants by myeloperoxidase in neu-
trophils. Nature 391, 393–397.
15. Burner, U., Furtmu
¨
ller, P.G., Kettle, A.J., Koppenol, W.H. &
Obinger, C. (2000) Mechanism of reaction of myeloperoxidase
with nitrite. J. Biol. Chem. 275, 20597–20601.
16. Lehnig, M. (2001) N-15 Chemically induced dynamic nuclear
polarization during reaction of N-acetyl-
L
-tyrosine with the
nitrating systems nitrite/hydrogen peroxide/horseradish peroxi-
dase and nitrite/hypochloric acid. Arch. Biochem. Biophys. 393,
245–254.
17. Anni, H. & Yonetani, T. (1992) Mechanism of action of perox-
idases. Met. Ions Biol. Syst. 28, 219–241.
18. Dunford, H.B. (1999) Heme Peroxidases.Wiley-VCH,NewYork,
USA.
19. Beckman, J.S. (1996) Oxidative damage and tyrosine nitration
from peroxynitrite. Chem. Res. Toxicol. 9, 836–844.
20. Moodie, R.B., Schofield, K. & Taylor, P.G. (1979) Electrophilic
aromatic substitution. Part 21. Rate constants for formation of
nitronium ion in aqueous sulfuric, perchloric, and methane-
sulfonic acids. J. Chem. Soc. Perkin Trans. I 2, 133–136.
21. Bru
¨
ck, T.B., Fielding, R.J., Symons, M.C.R. & Harvey, P.J.
(2001) Mechanism of nitrite-stimulated catalysis by lactoperox-
idase. Eur. J. Biochem. 268, 3214–3222.
22. Brennan, M L., Wu, W., Fu, X., Shen, Z., Song, W., Frost, H.,
Vadseth, C., Narine, L., Lenkiewicz, E., Borchers, M.T., Lusis,
A.J., Lee, J.J., Lee, N.A., Abu-Soud, H.M., Ischiropoulos, H. &
Hazen, S.L. (2002) A tale of two controversies: defining both the
role of peroxidases in nitrotyrosine formation in vivo using eosi-
nophil peroxidase and myeloperoxidase-deficient mice, and the
nature of peroxidase-generated reactive nitrogen species. J. Biol.
Chem. 277, 17415–17427.
23. van der Vliet, A., Eiserich, J.P., O’Neill, C.A., Halliwell, B. &
Cross, C.E. (1995) Tyrosine modification by reactive nitrogen
species: a closer look. Arch. Biochem. Biophys. 319, 341–349.
24. Lymar, S.V., Jiang, Q. & Hurst, J.K. (1996) Mechanism of
carbon dioxide-catalyzed oxidation of tyrosine by peroxynitrite.
Biochemistry 35, 7855–7861.
25. Casella, L., Poli, S., Gullotti, M., Selvaggini, C., Beringhelli, T. &
Marchesini, A. (1994) The chloroperoxidase-catalyzed oxidation
of phenols. Mechanism, selectivity, and characterization of
enzyme-substrate complexes. Biochemistry 33, 6377–6386.
26. Casella, L., Monzani, E., Gullotti, M., Santelli, E., Poli, S. &
Beringhelli, T. (1996) Oxidation of phenolic compounds catalyzed
by cytocrome c peroxidase. Gazz. Chim. Ital. 126, 121–125.
27. Monzani, E., Gatti, A.L., Profumo, A., Casella, L. & Gullotti, M.
(1997) Oxidation of phenolic compounds by lactoperoxidase.
Evidence for the presence of a low-potential compound II during
catalytic turnover. Biochemistry 36, 1918–1926.
28. Ferrari,R.P.,Laurenti,E.,Cecchini,P.I.,Gambino,O.&Son-
dergaard, I. (1995) Spectroscopic investigations on the highly
purified lactoperoxidase Fe(III)-heme catalytic site. J. Inorg. Bio-
chem. 58, 109–127.
29. Hughes, M.N. & Nicklin, H.G. (1968) Kinetics of decomposition
of pernitrous acid. J. Chem. Soc. 450–452.
30. Monzani, E., Alzuet, G., Casella, L., Redaelli, C., Bassani, C.,
Sanangelantoni, A.M., Gullotti, M., De Gioia, L., Santagostini, L.
& Chillemi, F. (2000) Properties and reactivity of myoglobin
Ó FEBS 2004 Peroxidase catalyzed nitration (Eur. J. Biochem. 271) 905
reconstituted with chemically modified protohemin complexes.
Biochemistry 39, 9571–9582.
31. Redaelli, C., Monzani, E., Santagostini, L., Casella, L., Sanang-
elantoni, A.M., Pierattelli, R. & Banci, L. (2002) Characterization
and peroxidase activity of a myoglobin mutant containing a distal
arginine. Chembiochem. 3, 226–233.
32. Cornish-Bowden, A. (1995) Fundamentals of Enzyme Kinetics.
Portland Press, London, UK.
33. Young, L.J. & Siegel, L.M. (1988) On the reaction of ferric heme
proteins with nitrite and sulfite. Biochemistry 27, 2790–2800.
34. Ferrari, R.P., Ghibaudi, E.M., Traversa, S., Laurenti, E., De
Gioia, L. & Salmona, M. (1997) Spectroscopic and binding studies
on the interaction of inorganic anions with lactoperoxidase.
J. Inorg. Biochem. 68, 17–26.
35. Gebicka, L. (1999) Kinetic studies on the oxidation of nitrite by
horseradish peroxidase and lactoperoxidase. Acta Biochim. Pol.
46, 919–927.
36. Zhang, H. & Dunford, H.B. (1993) Hammet qr correlation for
reactions of lactoperoxidase compound II with phenols. Can.
J. Chem. 71, 1990–1994.
37. Dunford, H.B. & Adeniran, A.J. (1986) Hammett rho sigma
correlation for reactions of horseradish peroxidase compound II
with phenols. Arch. Biochem. Biophys. 251, 536–542.
38. Sakurada, J., Sekiguchi, R., Sato, K. & Hosoya, T. (1990) Kinetic
and molecular orbital studies on the rate of oxidation of mono-
substituted phenols and anilines by horseradish peroxidase com-
pound II. Biochemistry 29, 4093–4098.
39. Folkes, L.K. & Candeias, L.P. (1997) Interpretation of the
reactivity of peroxidase compounds I and II with phenols by the
Marcus equation. FEBS Lett. 412, 305–308.
40. Ischiropoulos, H. (1998) Biological tyrosine nitration: a patho-
pysiological function of nitric oxide and reactive oxygen species.
Arch. Biochem. Biophys. 356, 1–11.
41. Roman, R. & Dunford, H.B. (1973) Horseradish peroxidase. XII.
Kinetic study of the oxidation of sulfite and nitrite by compounds
IandII.Can. J. Chem. 51, 588–596.
42. Job, D. & Dunford, H.B. (1976) Substituent effect on the oxida-
tion of phenols and aromatic amines by horseradish peroxidase
compound I. Eur. J. Biochem. 66, 607–614.
43. Patel, P.K., Mondal, M.S., Modi, S. & Behere, D.V. (1997)
Kinetic studies on the oxidation of phenols by the horseradish
peroxidase compound II. Biochim. Biophys. Acta 1339, 79–87.
44. Butler, A.R., Rutherford, T.J., Short, D.M. & Ridd, J.H. (1997)
Tyrosine nitration and peroxonitrite (peroxynitrite) isomerization:
15
NCIDNPNMRstudies.Chem. Commun. 669–670.
45. Crow, J.P. (1999) Manganese and iron porphyrins catalyze per-
oxynitrite decomposition and simultaneously increase nitration
and oxidant yield: Implications for their use as peroxynitrite
scavengers in vivo. Arch. Biochem. Biophys. 371, 41–52.
46. Lehnig, M. (1999) Radical mechanisms of the decomposition of
peroxynitrite and the peroxynitrite-CO
2
adduct and of reactions
with
L
-tyrosine and related compounds as studied by
15
Nchem-
ically induced dynamic nuclear polarization. Arch. Biochem. Bio-
phys. 368, 303–318.
906 E. Monzani et al.(Eur. J. Biochem. 271) Ó FEBS 2004