Báo cáo khoa học: Fifty years of muscle and the sliding filament hypothesis pdf
Bạn đang xem bản rút gọn của tài liệu. Xem và tải ngay bản đầy đủ của tài liệu tại đây (895.98 KB, 13 trang )
REVIEW ARTICLE
Fifty years of muscle and the sliding filament hypothesis
Hugh E. Huxley
Rosenstiel Center, Brandeis University, Waltham, MA, USA
This review describes the early beginnings of X-ray diffrac-
tion work on muscle structure and the contraction mech-
anism in the MRC Unit in the Cavendish Laboratory,
Cambridge, and later work in the MRC Molecular Biology
Laboratory in Hills Road, Cambridge, where the author
worked for many years, and elsewhere. The work has
depended heavily on instrumentation development, for
which the MRC laboratory had made excellent provision.
The search for ever higher X-ray intensity for time-resolved
studies led to the development of synchrotron radiation as
an exceptionally powerful X-ray source. This led to the first
direct evidence for cross-bridge tilting during force genera-
tion in muscle. Further improvements in technology have
made it possible to study the fine structure of some of the
X-ray reflections from contracting muscle during mechan-
ical transients, and these are currently providing remarkable
insights into the detailed mechanism of force development
by myosin cross-bridges.
Keywords: muscle; structure; contraction; X-ray diffraction;
synchrotron radiation; MRC Laboratory of Molecular
Biology.
Early days at the MRC (1948–1952)
I came to the MRC Laboratory as a research student in the
summer of 1948, when it was called the MRC Unit for
Work on the Molecular Structure of Biological Systems,
and consisted of Max Perutz and John Kendrew, who
became my supervisor. Francis Crick joined the unit a short
time later, and Jim Watson was there during my last year as
a graduate student.
I had just finished Part II Physics in 1948, in my third year
in Cambridge, a degree interrupted by four years of working
on radar development in the RAF, during the war. Though
extremely ignorant of biology, I had picked up the idea
that there might be interesting applications of physics to
biological and medical problems. Joining the MRC Unit
sounded like a good way of following that line, with the
advantage that I could stay on and perform research in
Cambridge. This had been my ambition for many years,
though in a different field.
I had just finished learning all about the remarkable ways
in which the physical properties of matter – mechanical,
thermal, electrical – could be accounted for by the properties
and interaction of atoms, which depended on atomic
structure. So it seemed obvious that now one needed to
find out about the structure of biological systems, at the
atomic and molecular levels, to understand how they
worked. X-ray diffraction seemed to offer a way of doing
just that, which this group was exploring, but of course
I had no way of knowing just how extraordinarily fortunate
I was to join them. Nor did we ever dream of quite how
important those years would turn out to be.
I did recognize that I was quite fortunate, as Max, John
and Francis were all such marvelous people to be with, and
I admired and liked them very much. They created a light-
hearted, stimulating intellectual environment, with high
standards and ambitious objectives. It was so exhilarating to
be back again in Cambridge, now as a research student, very
soon after the end of World War II. The clouds of the 1930s
had gone, we had won the war against Fascism – and many
of us had helped to do so – and now there were all sorts of
marvelous ideas and research flourishing around us – Hoyle,
Bondi and Gold with their theory of continuous creation,
Fred Sanger sequencing insulin, Martin Ryle doing great
things in radio astronomy, the first EDSAC computer
whirring away in the maths lab, Nikolaus Pevsner lecturing
on Renaissance Art and Architecture in Italy – and great
hopes for the Labour Government and a better world.
However, the work in the laboratory on hemoglobin and
myoglobin was going slowly, and crystallography was not
a subject that I found I enjoyed – my favorites had been
experimental nuclear and particle physics. So I started
working on muscle structure, which seemed to offer more
opportunity for adventure. Essentially nothing was known
about muscle structure at the submicroscopic level at that
time, except that striated muscles had complicated repeating
pattern of bands and lines (Fig. 1), and that there were
filaments of a complex between two proteins, actin and
myosin, whose individual structures were, of course,
unknown. What the general structure of the complex was,
no one knew either, and yet such knowledge was clearly
essential in order to understand the mechanism of contrac-
tion. This mechanism was still completely mysterious – a
situation that, as a newcomer to biology, I had at first found
very surprising.
To begin to learn something about muscle filament
structure, I knew that I would have first to look for X-ray
reflections in the 100 A
˚
range. This would require cameras
with very narrow slits, which meant problems of X-ray
Correspondence to H. E. Huxley, Brandeis University, Mailstop 029,
415 South Street, MA 02454-9110, USA.
(Received 31 October 2003, accepted 18 February 2004)
Eur. J. Biochem. 271, 1403–1415 (2004) Ó FEBS 2004 doi:10.1111/j.1432-1033.2004.04044.x
intensity, especially with hydrated biological specimens, as
I wanted to look at muscles in the living state. Bernal had
been the first to recognize that maintaining hydration was
essential to obtaining informative X-ray patterns from
protein crystals, and this had opened up the whole subject of
protein crystallography. So it seemed possible that muscles,
too, might give good patterns when in their native state,
though the patterns might be very weak.
This was what began the long road of forever searching
for higher intensity X-ray sources, and the MRC laboratory
provided an ideal base for doing that, which was my good
fortune. Kendrew and Perutz were very open-minded about
research projects, and encouraged me in this venture. The
first step was the acquisition of a prototype very fine focus
(50 lm) X-ray tube giving high brilliance (Fig. 2) obtained
via Kendrew and Bernal from Ehrenberg and Spear at
Birkbeck College.
Using this tube and a miniaturized low-angle X-ray
camera (5 lm beam defining slit, 3 cm specimen-to-film
distance), I was able to get my first diffraction patterns from
live relaxed muscle, with quite practicable exposure times
(a few hours for equatorial patterns and a couple of days
for axial ones). There were indeed sharp reflections from a
highly ordered structure, a tremendously exciting and
promising finding [1].
On the equator, there were reflections whose relative
spacings and intensities suggested that they came from a
hexagonal array of filaments about 450 A
˚
apart and about
100–150 A
˚
in diameter (Fig. 3A). So there was a paracrys-
talline lattice of filaments, in a live muscle! A diagram from
a muscle in rigor showed about the same lattice spacings but
very different relative intensities (Fig. 3B) which I realized
could be accounted for by the presence of a second set of
filaments, located at the trigonal positions of the original
hexagonal lattice. One can see this by constructing very
primitive end-on Fourier projections, with plausible
phases, ± in this case (Fig. 3C). So I guessed that the
original main set of filaments must be myosin and the
second set, actin. That is, that the two contractile proteins
were present in separate filaments, which therefore had
to have cross-connections between them to interact, to
become rigidly bonded in rigor, and to somehow produce
shortening in contraction [2,3].
Axial X-ray patterns showed a pattern of reflections
based on an approximately 420 A
˚
axial repeat (Fig. 4) with
a very strong third order, which remained in rigor, while the
other reflections became very faint. Intriguingly, the axial
period did not change when the relaxed muscle was
passively stretched! However, at that time I thought that
the two sets of filaments were both continuous through the
whole muscle sarcomere, and that the filaments giving the
axial periodicity must develop gaps during stretch. This
mystery was solved a year or two later, in 1953.
Work at MIT (1952–1954)
The year 2003 is in fact another fiftieth anniversary, as well
as being that of the DNA structure, and of Max Perutz’s
discovery of how to phase the X-ray reflections from protein
crystals. It was in 1953 that Jean Hanson and I – Jean from
the King’s College London Biophysics Research Unit – this
time an intentional collaboration! – began working together
Fig. 1. Diagram showing different levels of structure in vertebrate stri-
ated muscle as recognized circa 1950, and approximate dimensions of
band patterns within each repeating unit or sarcomere.
Fig. 2. Prototype model of Ehrenberg–Spear fine-focus X-ray tube used
in early muscle work (diameter of tube is approximately 3.5 cm). Anode
connection is inside safety shield, at 40 kV.
1404 H. E. Huxley (Eur. J. Biochem. 271) Ó FEBS 2004
at the Massachusetts Institute of Technology (MIT),
following up projects we had started earlier at our respective
MRC Units. In September 1953, we published the overlap-
ping, interdigitating, double array of filaments model for the
structure of striated muscle [4].
I had moved to MIT (September of 1952) to learn
electron microscopy in F. O. Schmitt’s group, and to look
for my double array of filaments using that technique. and
in fact, I had soon found I could see them quite readily
(Fig. 5) when I looked at thin cross-sections of vertebrate
striated muscle [5], cut using a special microtome which
Hodge, Spiro and I [6] had designed and built together for
the different projects we were pursuing.
Jean, at the King’s lab, had been using the newly
developed phase contrast light microscope to look at
isolated myofibrils, which gave superb images in that
instrument, and she also had come to MIT to learn electron
microscopy, arriving in January 1953. When she came, we
decided to join forces and work together on muscle, using
light and electron microscopy. We soon found that the
application of myosin-extracting solutions to isolated myo-
fibrils removed the extra density which gave the A-bands of
muscle their characteristic appearance, leaving behind a
ghost fibril, of segments bisected by the original Z-lines
(Fig. 6). At the same time, the thicker filaments seen in the
electron microscope were removed. So we realized that
myosin, making up the thick filaments, was present only in
the A-bands, and was responsible for the higher density
there. The myosin filaments formed a partially overlapping
array with the secondary array of actin filaments, which
were attached to the Z-lines (Fig. 7). Force was developed in
some way within the region of overlap. So it was clear that
the constant axial periodicity I had seen by X-ray diffraction
during stretch could be accounted for by some type of
sliding filament mechanism, and that the contraction
might occur by a similar sliding process, mediated by the
crossbridges which I could see in the EM cross-sections [5].
Confirmation that this was indeed what happened came
by the following year, when Jean and I had measured the
changes in the band-pattern during ATP-induced contrac-
tion of isolated myofibrils, as seen in the phase contrast light
microscope [7]. Both the actin and myosin filaments
remained essentially constant in length, and the sarcomere
Fig. 3. Equatorial X-ray diagrams (slit camera) from frog sartorius
muscle. (A) Live, resting muscle; (B) muscle in rigor; (C, D) corres-
ponding Fourier projections showing electron density distribution in
hexagonal lattice with a ¼ 440 A
˚
, with increased density at trigonal
positions of lattice in rigor.
Fig. 4. Axial X-ray diagram (slit camera) from live, resting frog sarto-
rius muscle, showing long axial repeat, measured to be 415 A
˚
(actually
430 A
˚
) with strong third order.
Fig. 5. Electron micrograph of cross-section of frog sartorius muscle,
showing end-on view of double array of filaments in overlap zone (centre
picture), and of H-zone and I-band (flanking pictures, shaded). (Note:
Not from the 1953 paper [5], where reproduction was poor.)
Ó FEBS 2004 Fifty years of muscle and the sliding filament hypothesis (Eur. J. Biochem. 271) 1405
length changes were accounted for by changes in overlap of
the two arrays. The sliding force had to be developed in
some way by the interaction of the myosin crossbridges with
actin (Fig. 8). A. F. Huxley and Niedergerke reached a
similar conclusion using observations on intact single fibres
observed by interference microscopy [8], and the two papers
were published together in Nature in May 1954. I had met
A. F. Huxley briefly in Woods Hole, Massachusetts the
previous summer, and had told him of our structural model
and current work; and he had told me of the similar line on
band-pattern changes that he and Niedergerke were pursu-
ing. So we agreed to co-ordinate publication, assuming we
reached similar conclusions. Fortunately, we did, and these
papers gave the basic description of the sliding filament
model, which has remained essentially unchanged since
then.
London (1955–1962)
Two or three years later, I was able to get thin enough
longitudinal sections to show the two types of filament, their
overlap, and the crossbridges (Figs 9 and 10) very clearly
with EM [9], but even this was insufficient to convince many
people, who remained skeptical about the whole sliding
filament theory. This was partly because the idea that the
muscle filaments themselves must become shorter had
become so ingrained, and because conclusions based on the
relatively new techniques of EM and X-ray diffraction were
still viewed with suspicion.
Subsequent EM work which I performed in Bernard
Katz’s Biophysics Department, at University College
London, and later back in Cambridge at the new MRC
Laboratory for Molecular Biology (LMB) on Hills Road
(from 1962) used the negative staining technique, which I
Fig. 7. Longitudinal section of frog sartorius
muscle, and diagram showing corresponding
overlapping arrays of thicker (myosin) and
thinner (actin) filaments.
Fig. 8. Diagram of overlapping filament arrays and crossbridges
believed to generate the relative sliding force between the filaments. Also
shown are cross-sectional views at different regions of the muscle
sarcomere.
Fig. 6. Phase-contrast interference light microscope images of rabbit
psoas myofibril before and after myosin extraction, plus density scans,
showing removal of A-band density, leaving residual I-segments (actin-
containing filaments). (For clarity, this is a later picture, not from 1953
paper [4].
1406 H. E. Huxley (Eur. J. Biochem. 271) Ó FEBS 2004
first described in work on Tobacco Mosaic Virus in 1956
[10]. I studied the structure of ÔnaturalÕ filaments of actin
and myosin, prepared directly from muscle by a simple
technique, and of ÔsyntheticÕ filaments, prepared from
purified proteins. The experiments showed that the actin
and myosin molecules were arranged in their filaments with
the appropriated structural polarity for the elements of force
developed by their individual molecular interactions to all
add up in the appropriate directions within each sarcomere
[11]. They also showed that myosin molecules could self-
assemble into filaments with the requisite reversal of polarity
at their midpoints.
The new MRC Laboratory in Hills Road,
Cambridge (1962–1987)
The next big hurdle was to get better X-ray data, and to
begin the attempt to get data from contracting muscle in
order to learn more about how the crossbridges produced
the sliding force. This required more intense X-ray sources,
and more efficient X-ray cameras, and the MRC LMB
provided an ideal environment to develop and apply these
techniques. By this time, rotating anode X-ray tubes,
designed by Tony Broad, were already in standard use at
the lab, where their increased intensity had been essential for
the then relatively huge amounts of data collection neces-
sary for solving the myoglobin and hemoglobin structures.
Ken Holmes and I joined forces to put together a system
suitable for the low-angle patterns from frog and insect
flight muscle. Ken and Bill Longley had grafted a Beaudoin
fine focus cathode (which Rosalind Franklin had intro-
duced to Birkbeck, where Ken and Bill had been graduate
students) onto the LMB-designed rotating anode (Fig. 11).
Ken and I developed a focusing mirror large/aperture,
focusing monochromator camera arrangement, which was
enormously more efficient than the normal pinhole or slit
collimator, and is now universally used in almost all
synchrotron X-ray work. Later, Ken and I developed and
had built at the MRC, the ÔBig WheelÕ type of large rotating
anode X-ray generator (Fig. 12), which Gerd Rosenbaum
helped into commercial production at Elliot Automation
Ltd, UK.
So, we were finally able to get two-dimensional X-ray
patterns from contracting muscle in 1964/5, and could see
directly that the actin and myosin axial periodicities hardly
changed in muscles which were contracting with substantial
shortening [12], confirming that the filaments all remained
constant in length. However, the myosin layer lines, coming
from the helical arrangement in resting muscle of the myosin
Fig. 9. Very thin longitudinal sections (rabbit psoas muscle) showing
single layer of filaments lattice, and hence individual thick and thin
filaments and crossbridges between them (1957 micrograph).
Fig. 10. Higher magnification view of very thin longitudinal section on
either side of H-zone. Axial compression during sectioning distorts
relative dimensions, but crossbridges axial spacing is 40 nm and the
thick filament diameter is 12 nm (1957 micrograph).
Fig. 11. Holmes–Longley–Broad rotating anode X-ray tube, circa 1964,
with bending mirror component only of a mirror-monochromator camera
on left hand side, and monochromator-only camera on right hand side
with cylindrical film holder to preserve focusing in high angle work.
Ó FEBS 2004 Fifty years of muscle and the sliding filament hypothesis (Eur. J. Biochem. 271) 1407
crossbridges around the thick filaments, almost completely
disappeared (Fig. 13), but a moderately strong meridional
reflection remained at about 145 A
˚
, about a 1.5% increase
in spacing from the resting value. So the crossbridges had to
have undergone substantial azimuthal (and perhaps radial)
movement while interacting with actin (or at least during the
transition from rest to contraction), while still maintaining
enough of an axial periodicity to give the relatively strong
meridional reflection [13]. Many other details of the layer-
line patterns were now visible (Figs 14 and 15), and of the
equatorial reflections too [14].
This all led to the ÔSwinging Crossbridge ModelÕ (it was,
after all, the 1960s) in which the structural change respon-
sible for developing force and movement was a change of tilt
(or an Ôequivalent change of shapeÕ)ofmyosinheads
attached to actin, during the ATP hydrolysis cycle [15]. The
heads were connected to the myosin filament backbone by a
link (S2) which provided axial rigidity but allowed radial
and azimuthal flexibility (Fig. 16).
These X-ray patterns were studied very extensively [16–
18], and time-resolved data were obtained on the equatorial
Fig. 13. Resting vs. contracting axial X-ray pattern from frog sartorius
muscle, 15 min total exposure, mirror-monochromator camera, showing
loss of myosin layer lines, and slightly strengthened actin 59 reflection.
Fig. 14. High resolution X-ray diagram of myosin layer-lines in resting
muscle, 430 repeat, strong merdional third order. Mirror-monochro-
mator camera, Holmes–Longley–Broad fine focus rotating anode
tube, 90 cms film distance, 20 hours exposure.
Fig. 12. Prototype ‘Big Wheel’ rotating anode tube in MRC (circa
1968).
Fig. 15. Wider angle X-ray diagram showing higher angle actin reflec-
tions from resting muscle. Broader, stronger reflections at top and
bottom of picture are the 5.1 a-helical reflections.
1408 H. E. Huxley (Eur. J. Biochem. 271) Ó FEBS 2004
reflections during the onset and decay of contraction in
single twitches of frog muscle. Nevertheless, we still needed
direct experimental evidence that crossbridge movement
was actually what happened during the force-producing
actomyosin interaction. The problem was (and still is) that
billions of individual crossbridge events happen asynchro-
nously in a contracting muscle, so that all one normally sees
is an X-ray pattern averaged over the whole crossbridge
cycle, even in the shortest exposures. However, A. F. Huxley
and Simmons showed that one can partially and tempor-
arily synchronize these events, for a millisecond or so,
by applying a small, very rapid, length change to a single
muscle fiber [19].
So we now needed an even further large increase in X-ray
intensity in order to be able to record a pattern within such a
very small time interval – the first patterns in 1950 had taken
hours or even days of total exposure time; and even with the
mirror-monochromator-rotating anode tube set up, 10 or
15 min total exposure was needed for patterns with a
minimum amount of detail. Fortunately, Ken Holmes, who
was already thinking about unconventional X-ray sources
while at the MRC lab, was able to show in 1971, with Gerd
Rosenbaum and John Witz [20], that electron synchrotrons,
specifically the one called DESY in Hamburg, could be used
as a powerful X-ray source for diffraction experiments.
However, many frustrating years of development took place
before this potential began to be fully realized. Our work
was performed both in Hamburg, at the EMBL outstation
that was built there especially for this purpose, and at the
NINA synchrotron at Daresbury, with John Haselgrove
and Wasi Faruqi, using a camera which Uli Arndt helped
to design [21].
In 1981, greatly helped by the advent of electron
(or positron) storage rings that provide a much larger,
and relatively continuous, X-ray output instead of the
short and temperamental duty-cycle of synchrotrons, and
with electronic instrumentation largely developed in the
MRC lab [22–24], we were finally able to achieve the
required millisecond time resolution [25,26]. We were able
to show that there was a large decrease in the intensity of
the 145 A
˚
meridional reflection during very rapid <1 ms)
quick-releases in which relative sliding of actin and myosin
filaments in each half sarcomere would be 10 nm or less, as
in the A. F. Huxley-Simmons experiments [19] (Fig. 17).
This was exactly what was expected to be the signature of a
tilting cross-bridge mechanism, where the axial profiles of
all the actin-attached cross-bridges become more spread
out by the temporarily synchronous tilting towards the end
Fig. 16. The swinging, tilting crossbridge-sliding filament mechanism
(1969). Force was developed when myosin S1 heads attached to actin
either tilted (or underwent Ôa change of shapeÕ), and the resultant axial
movement was transmitted to the myosin filament via the S2 portion of
the myosin molecule.
Fig. 17. Abrupt intensity decrease of myosin merdional reflection at
14.5 nm (M3) (h) approximately synchronous with tension decrease (*)
in A. F. Huxley-Simmons type quick release. Time channels 1 msec
(circa 1981, DORIS storage ring, EMBL Hamburg).
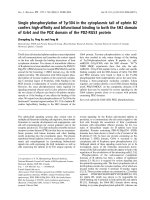
Fig. 18. Advanced Photon Source (APS), Argonne Laboratory, USA.
Scale of the machine can be judged from automobiles and tractor-
trailers on left-hand side of photographs.
Ó FEBS 2004 Fifty years of muscle and the sliding filament hypothesis (Eur. J. Biochem. 271) 1409
of their working strokes. But while this evidence was
strongly consistent with such a mechanism, it still did not
provide conclusive proof, as some type of disordering
process could conceivably have caused the intensity
decrease. However, two new advances, in other areas of
muscle work, then provided strong, independent lines of
support for the sliding-filament, tilting-crossbridge mech-
anism.
Important new types of evidence (1983–2000)
The first was the introduction of in vitro molecular motility
experiments, by Spudich and colleagues [27–30], and by
Yanagida and colleagues [31–35]. In many of these experi-
ments, fluorescently labeled single filaments of actin could
be seen in the light-microscope, sliding unidirectionally in
the presence of ATP, over substrates coated with myosin
molecules, at velocities consistent with the maximum
shortening velocity of the muscles from which the myosin
was derived. This fully vindicated the original sliding
filament hypothesis. The sliding was observed even when
only myosin subfragment-1, i.e. the isolated head-piece of
the molecule, was used, showing that the source of this
movement is in the crossbridge itself, as visualized in the
1969 model [15], and not, for example, in the S2 region, or
the myosin filament backbone. Later, even more remark-
able experiments by Finer, Simmons and Spudich [36]
showed that discrete steps of movement and force develop-
ment could be measured (using optical traps) during the
interaction of an actin filament with a single myosin
molecular, and gave values in the expected range.
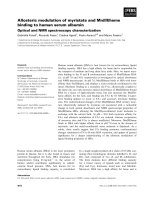
The second major advance came with the solution of
the high-resolution X-ray crystallographic structure of the
myosin S1 head by Rayment and his colleagues [37,38].
The most remarkable feature of this structure was the
presence of a 8.5 nm long single a-helical region extending
out at the C-terminal end of the molecule, with the myosin
light chains twisted around it, and presumably giving it
strength and stability. This immediately suggested that this
ÔneckÕ region might function as a lever-arm, to amplify
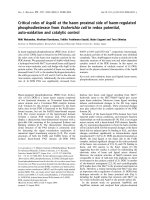
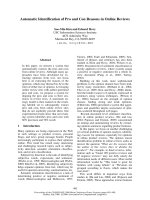
Fig. 19. X-ray diagrams from frog sartorius muscle (fiber axis horizontal)
recorded with CCD detector at the BioCAT beam line at the APS, in
Argonne. Upper frame, resting; lower frame, isometric contraction.
Background scattering has been subtracted electronically, and intensity
displayed on false color scale. Note first meridional actin reflection
(2.75 nm) and fifteenth myosin meridional reflection (2.86 nm) (resting
value) on right-hand side of diagrams: also, strong actin second layer
line reflections in contracting patterns, from tropomyosin/troponin
movement. Recorded from 2 msec time frames, total exposure 100 msec.
Fig. 20. Very high-resolution axial diagram,
isometric contraction. Myosin M3 reflection
(14.5 nm) is the strong reflection at either side
of the picture, and is split into subpeaks by the
interference fringes (spacing approximately
900 nm). Camera, 5.7 m, BioCAT beamline.
1410 H. E. Huxley (Eur. J. Biochem. 271) Ó FEBS 2004
atomic-scale movements around the enzyme site in the
more globular part of the head structure into the 5–10 nm
movements expected from the crossbridges. Later experi-
ments have provided strong experimental support for this
idea, particularly those of Cohen, Szent-Gyorgyi and their
colleagues [39], in which scallop myosin heads, in different
nucleotide states, were shown to have their lever arms
oriented at the widely different angles expected in the tilting
model.
Despite these successes, it still remained to be demon-
strated explicitly that such movement actually takes place
in a contracting muscle, and can be responsible for the
observed physiological behaviour, particularly during tran-
sient length changes.
Recent work (2000 onwards)
I think that reasonably decisive evidence has now been
obtained, some of it quite recently, with the present
generation of purpose-designed, electron-storage ring
X-ray sources such as the ESRF in Grenoble and the
APS at the Argonne National Laboratory, near Chicago
(Fig. 18). These give excellent two-dimensional X-ray
patterns from muscle (Fig. 19) when used with CCD
detectors. (I have been at the Rosenstiel Center, Brandeis
University, Waltham, Massachusetts since retiring from the
MRC in 1987, and have used the BioCAT beamline at the
APS ring quite extensively.) They also have very small
electron-beam cross-sections, and so give X-ray beams that
Fig. 21. Enlarged view of M3 reflection; isometric contraction, in centre
photograph, quick release on left, quick stretch on right. False color gives
imprecise impression of relative intensities.
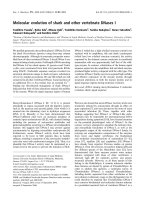
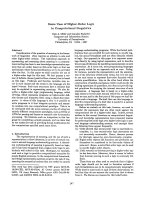
Fig. 22. Diagrammatic illustration of how bipartite structure of thick filaments brings about X-ray interference between diffraction from crossbridges, in
either half of filaments. Lower diagram shows envelope (blue) of M3 reflection which would be given by either half of filament on its own, with
sampled peaks (red) generated by interference fringes (black, dotted) which sample the envelope when the two halves diffract together.
Ó FEBS 2004 Fifty years of muscle and the sliding filament hypothesis (Eur. J. Biochem. 271) 1411
can be focused to extremely small spots or narrow lines,
which can be less that 100 lmwidewithacameralengthof
6 m. At a wavelength of about 1 A
˚
, this gives an order-
to-order resolution of about 60 000 A
˚
, and at the same time
very high total intensity – more than 10
13
photons per
second in the X-ray beam. This is more that 10 million times
stronger than our sources 50 years ago, a factor of
improvement hardly imaginable in the early experiments.
But why should the very high spatial resolution be such
an advantage? The reason is that the myosin meridional
reflections, especially the one at 14.5 nm (the basic axial
period of the crossbridges) contains internal fine structure,
which can give direct information about axial movements of
the myosin heads on a nanometer scale, but which can only
be seen at very high resolution (Figs 20 and 21). We noticed
this fine structure in resting muscle many years ago [13,16]
using a rotating anode X-ray generator and a 2.5 m long
camera to give the necessary resolution, but as exposure
times were then 20–30 h, we were unable to study it in
contracting muscle, and did not think about it long enough
to realize its potential usefulness. Bordas and Lowy were the
first to see the splitting of the 14.5 nm reflection into two
distinct peaks in contracting muscle, using the Daresbury
synchrotron [40], but misinterpreted the pattern as arising
from two distinct sets of crossbridges with slightly different
spacings.
In fact, the fine structure arises from interference
between the diffractions from the two halves of each of
the thick filaments, which have a very precise construc-
tion, so that the axial periodicities of the crossbridges in
the two halves have the same phase relationship to each
other, in all thick filaments (Fig. 22). The centers of
scattering mass of the two crossbridge arrays are a
constant distance apart (approximately 900 nm) for a
given average crossbridge configuration, so that the profile
of the 14.5 nm reflection is sampled by interference fringes
with this periodicity (because of the spatial displacement
produced by sampling a sloping curve, the apparent
spacing of the sampled pattern is in excess of 1000 nm,
which can be misleading).
However, it was Lombardi and his colleagues [40] who
first realized that the relative intensities of the sampled peaks
would provide an extraordinarily sensitive indicator of any
concerted axial movement of the myosin heads, and hence
of changes in crossbridge configuration during a quick
release. In a contracting muscle, the M3 reflection arises in
large part from the population of tension-generating
crossbridges attached to actin (this can be seen from the
large decrease in intensity, down to 20% of the isometric
value, produced by a quick release, as seen in the original
experiments [25,26]). If the tilting crossbridge mechanism is
correct, then in a rapid quick release, there will be a
synchronous movement of the myosin heads towards the
center of the A-bands as they all tilt over, and as the sets of
actin filaments slide towards each other. This will alter the
phase relationship between the two interfering patterns, and
cause a shift in the fringe position. Essentially, the interfer-
ence distance decreases by twice the axial movement of
the center of mass of the attached myosin heads (somewhat
less than the actin filament movement since the end of the
myosin lever arm remains fixed in axial position on the thick
filaments). This will be less than 1% of the total interference
distance, when the filaments move past each other by, say,
5 nm, but as the 14.5 nm reflection intercepts the fringe
system at the 62nd order (approximately), small changes in
the fringe spacing produce very substantial shifts in the
fringe positions at the reflection. These in turn produce large
changes in the relative intensities of the sampled peaks
(Fig. 23). In fact, movements of a few angstroms can readily
be detected and measured, providing an extremely powerful
tool for studying and quantitating crossbridge behavior
during the working stroke.
Lombardi and his colleagues have explored these effects
in very elegant experiments on single muscle fibers [40–43],
and we have pursued similar experiments on whole
muscle [25,26,45–48]. It is perhaps surprising that the
extents of crossbridge tilting are so similar, in the large
number of different filaments (and fibres) illuminated by the
X-ray beam in the whole muscle experiments, so that the
fringe pattern can still be observed after a quick release. But
indeed it is the case and the profiles of the fringes appear just
as sharp as those seen with single fibres.
One can see the ratio of the intensities of the two peaks
change by increasing amounts as one applies larger and
larger quick releases to the muscle. The outer peak (i.e. at
the slightly wider angle) becomes progressively weaker
(Fig. 24), from an initial value of about 0.8 of the
intensity of the inner one, to a saturating value of 0.25–
0.35 at larger releases. This shows that the fringe pattern
Fig. 23. Profiles of M3 reflection, computed from high-resolution X-ray
structure. Blue trace, envelope of reflection given by a single 736 nm
long array of myosin heads with a 14.56 nm repeat. Red trace, sampled
peak produced by two such arrays, with appropriate symmetry, centers
separated by 904 nm. Upper picture, lever arm 48° away from Ray-
ment rigor position (catalytic subunit and lever arm approximately
aligned). Lower picture, lever arm 30° away from rigor position, cor-
responding to an axial shift of 2.97 nm. Large change in intensity
ration is predicted.
1412 H. E. Huxley (Eur. J. Biochem. 271) Ó FEBS 2004
is moving outwards across the profile of the 14.5 nm
reflection, and that therefore the centre of scattering mass
of the crossbridges in each half sarcomere is moving
inwards towards the M-line, thus, decreasing the interfer-
ence distance between the two halves. At the same time,
the total intensity in the reflection changes in the way
already seen in the earlier experiments. This provides,
finally, direct evidence for the type of crossbridge beha-
viour required by the sliding filament, tilting crossbridge
model, i.e. axial movement of myosin heads attached to
actin, with the predicted effects on total intensity of lever
arm tilting. The saturation of the intensity ratio change
shows that a fixed component is also present, probably
due to diffraction from the unattached crossbridges and
structures in the myosin filament backbone. It is also very
noticeable that the overall intensity of the reflection at first
increases slightly, at the smaller releases, and then
decreases, at larger extents of shortening (up to about
10–12 nm of relative filament sliding). The initial increase
is explained readily (as pointed out by M. Irving and his
colleagues [49]) if, in the isometric muscle, the lever-arm is
tilted out beyond the angle at which maximum axial
alignment of the catalytic domain of the head and the
leverarmoccurs.Astheleverarmtiltsinaninward
direction (i.e. towards the center of the sarcomere) during
shortening, the alignment passes though a maximum, and
then progressively decreases more and more with further
shortening. The axial profile of the myosin head becomes
wider and wider, and the M3 reflections shows the
characteristic large intensity decrease.
I do not have space to go into the detailed features of
these studies here, but I really do believe that, altogether,
there is now incontrovertible evidence for the correctness of
the tilting lever-arm model, although of course many
important details still remain to be worked out.
In retrospect, it is remarkable what a lot of informa-
tion was hidden in those original faint reflections, waiting
to be recorded and understood. How fortunate it was
that unexpectedly large improvements in technology,
essential to extract that information, were indeed feasible;
and how fortunate I was to have had the privilege of
working in a laboratory so excellently planned that it was
able to contribute to those developments, and to enable
me to perform the experiments with the help of so many
great colleagues and visitors who have been here
(Table 1).
References
1. Huxley, H.E. (1951) Low-angle X-ray diffraction studies on
muscle. Disscus. Faraday Soc. 11, 148.
2. Huxley, H.E. (1952) Investigations in biological structures by
X-ray methods. The structure of muscle. PhD Thesis, University
of Cambridge, Cambridge, UK.
3. Huxley, H.E. (1953) X-ray diffraction and the problem of muscle.
Proc. Roy. Soc. B. 141,59.
Table 1. People who have collaborated with the author in work on
muscle, both in the MRC Laboratory of Molecular Biology, and else-
where.
Scientific Technical In other Laboratories
Uli Arndt Tony Broad Dick Birks
Wyn Brown Mike Bitton Joan Bordas
David DeRosier Chris Bond Jean Hanson
Wasi Faruqi Barry Channing Alan Hodge
John Finch Mike Fordham Tom Irving
John Haselgrove Michael Fuller Michel Koch
Sarah Hitchcock Dave Hart Bernard Katz
Ken Holmes Keith Hopkins Sally Page
John Kendrew Chris Raeburn Massimo Reconditi
Jake Kendrick-Jones Tony Woollard Bob Simmons
Marcus Kress Alex Wynn Dave Spiro
Peter Moore Hernando Sosa
Vivian Nachmias Alex Stewart
Raul Padron
Tom Pollard
Murray Stewart
Andrew Szent-Gyorgyi
Taki Wakabayashi
Alan Weeds
Fig. 24. Changes in M3 X-ray reflection during quick releases. (Left)
M3 reflections, electronically foreshortened (in vertical direction on
display) recorded after each of a series of quick releases of increasing
magnitude. (Right) Profiles of 1st and 9th frames, illustrating change in
relative intensities of the two peaks in the sampled reflection. The
spacing shift occurs as a result of: (a) a shift of the fringes due to
crossbridge movement and (b) a shift in both the fringes and the
underlying reflection due to compliance, these two effects being
additive.
Ó FEBS 2004 Fifty years of muscle and the sliding filament hypothesis (Eur. J. Biochem. 271) 1413
4. Hanson, J. & Huxley, H.E. (1953) The structural basis of the
cross-striation in muscle. Nature 172, 530–532.
5. Huxley, H.E. (1953) Electron-microscope studies of the organ-
ization of the filaments in striated muscle. Biochem. Biophys. Acta
12, 387–394.
6. Hodge, A.J., Huxley, H.E. & Spiro, D. (1954) A simple new
microtome for ultrathin sectioning. J. Histochem. Cytochem. 2,
55–58.
7. Huxley, H.E. & Hanson, J. (1954) Changes in the cross-striations
of muscle during contraction and stretch and their structural
interpretation. Nature 173, 973–976.
8. Huxley, A.F. & Niedergerke, R. (1954) Structural changes in
muscle during contraction. Interference microscopy of living
muscle fibres. Nature 173, 971–973.
9. Huxley, H.E. (1957) The double array of filaments in cross-striated
muscle. J. Biophys. Biochem. Ctyol. 3, 631–648.
10. Huxley, H.E. (1956) Some observations on the structure of
tobacco mosaic virus. In 1st European Regional Conference Elect.
Micro. Stockholm, pp. 260. Wicksel, Stockholm, Sweden.
11. Huxley, H.E. (1963) Electron microscope studies on the structure
of natural and synthetic protein filaments from striated muscle.
J. Mol. Biol. 7, 281–308.
12. Huxley, H.E., Brown, W. & Holmes, K.C. (1965) Constancy of
axial spacings in frog sartorius muscle during contraction. Nature
206, 1358.
13. Huxley, H.E. & Brown, W. (1967) The low angle x-ray diagram of
vertebrate striated muscle and its behaviour during contraction
and rigor. J. Mol. Biol. 30, 383–434.
14. Huxley, H.E. (1968) Structural difference between resting and
rigor muscle: evidence from intensity changes in the low angle
equatorial X-ray diagram. J. Mol. Biol. 38, 507–520.
15. Huxley, H.E. (1969) The mechanism of muscle contraction.
Science 164, 1356–1366.
16. Haselgrove, J.C. (1970) X-ray Diffraction Studies on Muscle. PhD
Thesis, University of Cambridge, Cambridge, UK.
17. Haselgrove, J.C. & Huxley, H.E. (1973) X-ray evidence for radial
cross-bridge movement and for the sliding filament model in
actively contracting skeletal muscle. J. Mol. Biol. 77, 549–568.
18. Haselgrove, J.C. (1975) X-ray evidence for conformational chan-
ges in the myosin filaments of vertebrate striated muscle. J. Mol.
Biol. 92, 113–143.
19. Huxley, A.F. & Simmons, R.M. (1971) Proposed mechanism of
force generation in striated muscle. Nature 233, 533–538.
20. Rosenbaum,G.,Holmes,K.C.&Witz,J.(1971)Synchrotron
radiation as a source for X-ray diffraction. Nature 230, 434–437.
21. Haselgrove, J.C., Faruqi, A.R., Huxley, H.E. & Arndt, U.W.
(1977) The design and use of a camera for low angle X-ray dif-
fraction experiments with synchrotron radiation. J. Phys. 10,
1035–1044.
22. Faruqi, A.R. & Huxley, H.E. (1978) Time resolved studies on
contracting muscle using low-angle X-ray diffraction. J. Appl.
Cryst. 11, 449–454.
23.Faruqi,A.R.&Huxley,H.E.(1978)Time-resolvedstudieson
contracting muscle using low angle X-ray diffraction I. Design of
data collection system. Nucl. Instr. Methods 156, 19–25.
24. Faruqi, A.R. & Huxley, H.E. (1978) New techniques in the study
of time-resolved X-ray diffraction from muscle. In Proceedings of
the 4th Tamaguchi International Symposium on Biophysics,pp.
367–401. Tsukuba University Press, Japan.
25. Huxley, H.E., Simmons, R.M., Faruqi, A.R., Kress, M., Bordas,
J. & Koch, M.H.J. (1981) Millisecond time-resolved changes in
x-ray reflections from contracting muscle during rapid mechanical
transients, recorded using synchrotron radiation. Proc. Natl.
Acad. Sci. USA 78, 2297–2301.
26. Huxley, H.E., Simmons, R.M., Faruqi, A.R., Kress, M., Bordas,
J. & Koch, M.H.J. (1983) Changes in the x-ray reflections from
contracting muscle during rapid mechanical transients and their
structural implications. J. Mol. Biol. 169, 469–506.
27. Sheetz, M.P. & Spudich, J.A. (1983) Movement of myosin-coated
fluorescent beads on actin cables in vitro. Nature 303, 31–35.
28. Spudich, J.A., Kron, S.J. & Sheetz, M.P. (1985) Movement of
myosin-coated beads on oriented filaments reconstituted from
purified actin. Nature 315, 584–586.
29. Kron, S.J. & Spudich, J.A. (1986) Fluorescent actin filaments
moveonmyosinfixedtoaglasssurface.Proc. Natl. Acad. Sci.
USA 83, 6272–6276.
30. Toyashima, Y.Y., Kron, S.J., McNally, E.M., Niebling, K.R.,
Toyashima, C. & Spudich, J.A. (1987) Myosin subfragment-1
is sufficient to move actin filaments in vitro. Nature 328,
536–539.
31. Yanagida, T., Nakase, M., Nishiyama, K. & Oosowa, F. (1984)
Direct observation of motion of single F-actin filaments in the
presence of myosin. Nature 307, 58–60.
32. Yanagida, T., Arata, T. & Oosawa, F. (1985) Sliding distance of
actin filament induced by a myosin crossbridge during one ATP
hydrolysis cycle. Nature 316, 366–369.
33. Harada, Y., Noguchi, A., Kishino, A. & Yanagida, T. (1987)
Sliding movement of single actin filaments on one-headed myosin
filaments. Nature 326, 605–608.
34. Kishino, A. & Yanagida, T. (1988) Force measurements by
micromanipulation of a single actin filament by glass needles.
Nature 334, 74–76.
35. Kitamura, K., Tokunaga, M., Iwane, A.H. & Yanagida, T. (1999)
A single myosin head moves along an actin filament with regular
steps of 5.3 nanometres. Nature 397, 129–134.
36. Finer, J.T., Simmons, R.M. & Spudich, J.A. (1994) Single myosin
molecule mechanics: piconewton forces and nanometre steps.
Nature 368, 113–119.
37.Rayment,I.,Rypniewski,W.,Schmidt-Base,K.,Smith,R.,
Tomchick,D.,Benning,M.,Winkelmann,D.,Wesenberg,G.&
Holden, H. (1993) Three-dimensional structure of myosin sub-
fragment-1: a molecular motor. Science 162, 50–58.
38. Rayment, I., Holden, M.H., Whittaker, M., Yohn, C.B., Lorenz,
M., Holmes, K.C. & Milligan, R.A. (1993) Structure of the actin-
myosin complex and its implications for muscle contraction.
Science 162, 58–65.
39. Houdusse, A., Szent-Gyorgyi, A.G. & Cohen, C. (2000) Three
conformational states of scallop myosin S1. Proc. Natl. Acad. Sci.
USA 97, 11238–11243.
40. Bordas, J., Lowy, J., Svensson, A., Harries, J.A., Diakun, G.P.,
Gandy, J., Miles, C., Mant, G.R. & Towns-Andrews, E. (1995)
X-ray evidence that in contracting live frog muscles there
exist two distinct populations of myosin heads. Biophys. J. 68,
99s–105s.
41. Linari, M., Piazzesi, G., Dobbie, I., Koubassova, N., Reconditi,
M., Narayanan, T., Diat, O., Irving, M. & Lombardi, V. (2000)
Interference fine structure and sarcomere length dependence of the
axial X-ray pattern from active single muscle fibers. Proc. Natl
Acad. Sci USA 97, 7226–7231.
42. Lombardi, V., Piazzesi, G., Linari, M., Vannicelli-Casoni, M.E.,
Lucii, L., Boesecke, P., Narayahan, T. & Irving, M. (2000) X-ray
interference studies of the working stroke in single muscle fibres.
Biophys. J. 78,134A.
43. Piazzesi, G., Reconditi, M., Linari, M., Lucii, L., Sun, Y B.,
Koubassova, N., Boesecke, P., Narayanan, T., Irving, M. &
Lombardi, V. (2001) X-ray interference study of myosin head
motions during rapid length changes of single muscle fibres.
Biophys. J. 80, 509a.
44. Piazzesi, G., Reconditi, M., Linari, M., Lucii, L., Sun, Y.,
Nagayanan, T., Boesecke, P., Lombardi, V. & Irving, M. (2002)
Mechanism of force generation by myosin heads in skeletal mus-
cle. Nature 415, 659–662.
1414 H. E. Huxley (Eur. J. Biochem. 271) Ó FEBS 2004
45.Huxley,H.E.,Reconditi,M.,Stewart,A.&Irving,T.(2000)
Interference changes on the 14.5 nm reflection during rapid length
changes. Biophys. J. 78, 134A.
46. Huxley, H.E., Reconditi, M., Stewart, A., Irving, T. & Fischetti,
R. (2001) Use of X-ray interferometry to study crossbridge
behavior during rapid mechanical transients. Biophys. J. 80, 266A.
47.Huxley,H.E.,Reconditi,M.,Stewart,A.&Irving,T.(2002)
Crossbridge and backbone contributions to interference effects on
meridional X-ray reflections. Biophys. J. 82,5A.
48. Huxley, H.E., Reconditi, M., Stewart, A. & Irving, T. (2003) What
the higher order myosin meridional reflections tell us. Biophys.
J. 84, 139A.
49. Irving, M., Allen, T.S.C., Sabido-David, C., Craik, J.S., Brand-
meier, B., Kendrick-Jones, J., Corrie, J.E.T., Trentham, D.R. &
Goldman, Y.E. (1995) Tilting of the light chain region of myosin
during step length changes and active force generation in skeletal
muscle. Nature 375, 688–691.
Ó FEBS 2004 Fifty years of muscle and the sliding filament hypothesis (Eur. J. Biochem. 271) 1415