Báo cáo khoa học: Multiple-probe analysis of folding and unfolding pathways of human serum albumin docx
Bạn đang xem bản rút gọn của tài liệu. Xem và tải ngay bản đầy đủ của tài liệu tại đây (542.09 KB, 9 trang )
Multiple-probe analysis of folding and unfolding pathways of human
serum albumin
Evidence for a framework mechanism of folding
Manas Kumar Santra, Abhijit Banerjee, Shyam Sundar Krishnakumar, Obaidur Rahaman and Dulal Panda
School of Biosciences and Bioengineering, Indian Institute of Technology, Bombay, Mumbai, India
The changes in the far-UV CD signal, intrinsic tryptophan
fluorescence and bilirubin absorbance showed that the
guanidine hydrochloride (GdnHCl)-induced unfolding of
a multidomain protein, human serum albumin (HSA),
followed a two-state process. However, using environment
sensitive Nile red fluorescence, the unfolding and folding
pathways of HSA were found to follow a three-state process
andanintermediatewasdetectedintherange0.25–1.5
M
GdnHCl. The intermediate state displayed 45% higher
fluorescence intensity than that of the native state. The
increase in the Nile red fluorescence was found to be due to
an increase in the quantum yield of the HSA-bound Nile red.
Low concentrations of GdnHCl neither altered the binding
affinity of Nile red to HSA nor induced the aggregation of
HSA. In addition, the secondary structure of HSA was not
perturbed during the first unfolding transition (<1.5
M
GdnHCl); however, the secondary structure was completely
lost during the second transition. The data together showed
that the half maximal loss of the tertiary structure occurred
at a lower GdnHCl concentration than the loss of the sec-
ondary structure. Further kinetic studies of the refolding
process of HSA using multiple spectroscopic techniques
showed that the folding occurred in two phases, a burst
phase followed by a slow phase. An intermediate with
native-like secondary structure but only a partial tertiary
structure was found to form in the burst phase of refolding.
Then, the intermediate slowly folded into the native state.
An analysis of the refolding data suggested that the folding
of HSA could be best explained by the framework model.
Keywords: bilirubin; human serum albumin; framework
model; Nile red; protein folding.
Human serum albumin (HSA), a major protein component
of blood plasma, is the physiological carrier for a broad
range of insoluble endogenous compounds like fatty acids,
lysolecithin, bilirubin and bile salts [1,2]. It also binds to a
wide variety of drugs [3–5]. It has three structurally similar
a-helical domains I–III, which are further divided into
subdomains A and B [6,7]. Recent evidences indicate the
presence of one or more stable intermediates in the
unfolding pathway of multidomain proteins suggesting that
unfolding occurs through multiple steps [8,9]. Surprisingly,
several studies reported that the denaturant-induced unfold-
ing of the multidomain protein HSA occurred through a
highly cooperative two-state process involving only the
native and unfolded states [10–13]. For example, Tayyab
et al. [10,11] found that the urea-induced unfolding of HSA
apparently occurred in a single, concerted step with no
intermediate formation. Further, Muzammil et al. [12]
found that guanidine hydrochloride (GdnHCl)-induced
unfolding occurred in a single step. In addition, a recent
analysis involving multiple probes and the changes in spatial
distances between these probes have shown that GdnHCl-
induced unfolding of HSA occurred through an incremental
loss of structure but no stable intermediate state was
identified in the unfolding process [13]. However, Flora
et al. [14] reported that unfolding of HSA by GdnHCl
occurred in multiple steps, with at least one intermediate.
Thus, the presence of an intermediate state in the unfolding
pathway of HSA remains controversial.
In many proteins, although an intermediate forms during
the unfolding process, the intermediate is often not detected
due to the lack of an appropriate probe. It is believed that
the detection of an intermediate under equilibrium condi-
tions helps in understanding the mechanisms of protein
unfolding and folding and that the folding intermediates
greatly assist in narrowing the search for the native state
by increasing native-like interactions [5–18]. However, often
the intermediates are trapped kinetically in the folding
pathway by non-native interactions that significantly reduce
the folding rate. These intermediates are comprised of
misfolded or randomly collapsed species [17,19–22]. The
partially folded intermediates that are formed under various
folding conditions may have different secondary structures
and compactness depending on the protein and the
experimental conditions. Further, the intermediate states
are not necessarily close either to the native or the unfolded
state [23]. These findings suggest that protein folding occurs
through a diverse array of mechanisms [16,24,25].
Three models, namely the framework model, the hydro-
phobic collapse model and the nucleation model are
frequently used to describe the mechanism of protein
Correspondence to D. Panda, School of Biosciences and Bioengineer-
ing, Indian Institute of Technology, Bombay, Mumbai 400 076, India.
Fax: + 91 22 2572 3480, Tel.: + 91 22 2576 7838,
E-mail:
Abbreviations: HSA, human serum albumin; GdnHCl, guanidine
hydrochloride; ANS, 1-anilinonaphthalene-8-sulfonic acid.
(Received 19 January 2004, revised 3 March 2004,
accepted 18 March 2004)
Eur. J. Biochem. 271, 1789–1797 (2004) Ó FEBS 2004 doi:10.1111/j.1432-1033.2004.04096.x
folding [24–32]. The framework model involves the forma-
tion of the tertiary structures through a hierarchical
assembly of the local elements of the secondary structures
[24,25,29–31,33]. The framework model has been extended
to include the mechanism where some extent of the tertiary
structures is also formed along with the secondary structure.
The hydrophobic collapse model, involves the formation
of a loose hydrophobic core followed by the development of
secondary structural elements resulting in the formation of
the tightly packed native structure [26,29]. According to the
nucleation model, the folding process of a protein starts
with the formation of a rate-limiting configuration by
native-like contacts of neighbouring residues, which then
nucleates into the native structures [27–29]. In the nucleation
model, the tight packing occurs rapidly without the
formation of an intermediate, whereas for both the hydro-
phobic collapse and framework models, the tight packing
occurs only after the formation of an intermediate state.
The folding pathway of HSA could be a complex process
because each domain could fold independently and the
inter-domain interactions could regulate the overall folding
process. However, very little is known about the folding
mechanism of HSA. In this report, multiple probes inclu-
ding bilirubin absorbance, tryptophan fluorescence, Nile
red fluorescence and far-UV CD spectroscopy were used
to identify and characterize the transitions that occurred
during the folding–unfolding of HSA. An intermediate state
was identified in both the unfolding and folding pathways of
HSA and we obtained evidence suggesting that the folding
of HSA follows the framework model.
Experimental procedures
Materials
HSA, fraction V, essentially fatty acid free was purchased
from Calbiochem. According to the manufacturer the
purity level of HSA is ‡ 98%. We also confirmed the purity
level of HSA by Coomassie blue staining of SDS/PAGE
(data not shown). GdnHCl was obtained from Aldrich
Chemical Co. Dicumarol, Sephadex G-25 and bilirubin
were from Sigma Chemical Co. Nile red and 1-anilino-
naphthalene-8-sulfonic acid (ANS) were from Molecular
Probes. All other chemicals used in this study were of
analytical grade.
Binding of Nile red to HSA
Free Nile red in aqueous solution has negligible fluores-
cence. Upon binding to HSA, the fluorescence intensity at
615 nm increased severalfold. Nile red has limited solubility
in aqueous buffer. Therefore, low concentrations of Nile red
were used to determine its affinity to HSA. HSA (1 l
M
)was
incubated with different concentrations (0.2–0.7 l
M
)ofNile
redin25m
M
phosphate buffer (pH 7) at 25 °Cfor30min.
The dissociation constant of HSA and Nile red interaction
was determined using Eqn (1):
DF ¼ DF
max
À K
d
ðDF=½LÞ ð1Þ
where DF
max
is the maximum fluorescence when all the
binding sites are saturated with Nile red, [L] is the free ligand
concentration, DF is the change in fluorescence when Nile red
and HSA were in equilibrium and K
d
is the dissociation
constant. DF
max
was determined using a reverse titration
wherein a fixed concentration of Nile red (0.5 l
M
)was
titrated with increasing amount of HSA in 25 m
M
phosphate
buffer pH 7 at 25 °Cfor30min.DF
max
was determined by
plotting 1/(F–F
0
) vs. 1/HSA and extrapolating 1/HSA
to zero. Here, F
0
and F were the observed fluorescence
intensities of Nile red in the absence and presence of different
concentrations of HSA, respectively. Fluorescence measure-
ments were performed using a JASCO FP-6500 fluorescence
spectrophotometer (Jasco, Tokyo, Japan) at 25 °C equipped
with a constant temperature water-circulating bath. The
excitation and emission band passes were set at 5 nm and
10 nm, respectively. A quartz cell of 0.3 cm path length was
used for all experiments if not stated otherwise.
Unfolding of HSA probed by Nile red fluorescence
HSA (2 l
M
)in25m
M
phosphate buffer pH 7 was incuba-
ted with different concentrations of GdnHCl (0.25–7
M
)at
25 °C for 30 min. Nile red (0.5 l
M
) was then added to the
reaction mixtures and incubated for an additional 30 min
before spectral measurements. The emission spectra were
collected over the range of 575–675 nm using 550 nm as an
excitation wavelength.
Steady-state unfolding of HSA probed by intrinsic
tryptophan fluorescence
HSA (2 l
M
)in25m
M
phosphate buffer pH 7 was dena-
tured by different concentrations of GdnHCl (0.25–7
M
)
at 25 °C for 1 h. The emission spectra were collected over
the range of 310–400 nm using 295 nm as an excitation
wavelength.
Unfolding of HSA in the presence of bilirubin
The binding of bilirubin to HSA increases the ligand’s
absorbance at 475 nm. HSA (10 l
M
)wasdenaturedby
different concentrations of GdnHCl (0.5–7
M
) for 30 min at
25 °C. Then, 10 l
M
of bilirubin was added to individual
samples and incubated for 30 min under identical condi-
tions before taking the absorbance at 475 nm. Absorbance
measurements were performed using a JASCO V-530
UV-visible spectrophotometer.
Unfolding of HSA was probed by monitoring
the change in the secondary structure
HSA (5 l
M
)in25 m
M
phosphate buffer was incubated with
different concentrations of GdnHCl at 25 °Cfor30min.
The far-UV (200–260 nm) CD spectra were recorded at
25 °C using a JASCO spectropolarimeter (model J-810)
equipped with a JASCO PTC 423S Peltier temperature
control system. A quartz cuvette of 1-mm path length was
used for all far-UV CD measurements performed in this
study. Spectra were collected with a scan speed of
200 nmÆmin
)1
and a response time of 1 s. Each spectrum
was the average of five scans. The CD data were analysed
using a JASCO software package.
1790 M. K. Santra et al. (Eur. J. Biochem. 271) Ó FEBS 2004
Refolding studies by monitoring Nile red fluorescence
HSA (100 l
M
) was incubated with 6
M
GdnHCl for 30 min
at 25 °Cin25m
M
sodium phosphate buffer pH 7. Under
these conditions, HSA was found to be fully unfolded as
judged by Nile red fluorescence, tryptophan fluorescence
and far-UV CD spectroscopy. The unfolded sample was
diluted 50 times in phosphate buffer to adjust the final
concentration of HSA to 2 l
M
. At desired time point, Nile
red was added to an aliquot of the diluted unfolded sample
and incubated for 2 min. The binding of Nile red to HSA
was found to be complete within 2 min. After 2 min of
incubation at 25 °C, Nile red fluorescence was monitored as
described previously. The fraction refolded was calculated
by using the following equation:
F
r
¼ 1 À
F
N
À F
F
N
À F
D
ð2Þ
where F
r
is the fraction refolded, F is the observed Nile red
fluorescence intensity at different time intervals, F
N
is the
fluorescence intensity of the native HSA–Nile red complex
and F
D
is the fluorescence intensity of HSA–Nile red
complex in the presence of 6
M
GdnHCl.
Refolding studies by monitoring tryptophan fluorescence
As described for Nile red, HSA (100 l
M
) was first unfolded
by incubating with 6
M
GdnHCl. Then, the unfolded HSA
was diluted 50 times in phosphate buffer and the kinetics of
refolding were followed by monitoring tryptophan fluores-
cence. The excitation and emission wavelengths were
295 nm and 340 nm, respectively. The fraction of refolding
at different times was calculated using Eqn (2).
Ligand binding properties of refolded HSA
HSA was completely unfolded by incubating with 6
M
GdnHCl for 1 h. The denaturant was removed by exhaust-
ive dialysis at 4 °C against 25 m
M
phosphate buffer pH 7.
Native or refolded HSA (3 l
M
) was incubated with different
concentrations (0–50 l
M
)ofdicumarolfor30minat25°C
in 25 m
M
phosphate buffer pH 7. The binding of dicumarol
to the native and refolded HSA was determined by
monitoring the decrease in the tryptophan fluorescence of
HSA. Native or refolded HSA (3 l
M
) was incubated with
different concentrations (10–50 l
M
)ofANSfor30minat
25 °C. The binding of ANS to the native and refolded HSA
was measured by measuring ANS fluorescence intensity at
475 nm using 360 nm as an excitation wavelength. Bilirubin
(5 l
M
) was incubated with 5 l
M
of the native or refolded
HSA for 30 min at 25 °C and the binding of bilirubin to the
native and refolded HSA was determined by measuring the
bilirubin absorbance at 475 nm.
Light scattering assay
The light scattering of 10 l
M
HSA was monitored for
15 min in the absence and presence of different concentra-
tions (0.25
M
,0.5
M
and 1
M
) of GdnHCl. The excitation
and emission wavelengths were set to 400 nm with excita-
tion and emission band pass of 3 nm and 5 nm, respectively.
Calculation of D
m
values from equilibrium unfolding
Several experiments demonstrated that the free energy
(DG
UÀF
) of unfolded proteins at different denaturant
concentrations [D] has a linear relationship with the
denaturant concentration [34]:
DG
D
UÀF
¼ DG
H
2
O
UÀF
À m½Dð3Þ
where m is the slope of the transition, DG
UÀF
H
2
O
is the free
energy of unfolding in the absence of denaturant. The
fluorescence intensity (F) of a protein at equilibrium with
differentconcentrations ofdenaturant[D]canbeexpressed as:
F ¼½ða
F
þ b
F
½DÞ þ ða
U
þ b
U
½DÞ
 expfmð½DÀD
m
Þ=RTg=
½1 þ expfmð½DÀD
m
Þ=RTg ð4Þ
where a
F
and a
U
are the intercepts and b
F
and b
U
are the
slopes of the baselines of the equilibrium fluorescence (F)at
low and high denaturant concentrations, respectively. D
m
is
the denaturant concentration at which 50% of the protein
is unfolded. R is the universal gas constant and T is the
absolute temperature. The data were fitted to this equation
using the linear least-squares method to obtain the best-
fitted values of m and D
m
. The curve fittings were performed
using
MICROSOFT ORIGIN
software.
Calculation of the rate constants from the kinetics
of refolding
HSA was found to follow two phases of refolding, a burst
phase and a slow phase. The burst phase occurred within the
dead-time of the experiment. The rate constant of the burst
phase could not be estimated as there were not sufficient
data points in the burst phase. The rate of the slow phase
was calculated using both tryptophan and Nile red fluor-
escence. The fluorescence intensity of tryptophan or Nile red
was related to the rate of the refolding reaction by Eqn (5):
I ¼ I
U
þð1 À e
ÀkT
ÞÂðI
F
À I
U
Þð5Þ
where, I
u
and I
f
were the fluorescence intensities of the
unfolded and folded proteins, respectively, T is the absolute
temperature and k is the rate constant of the refolding
reaction. Eqn (5) was fitted to the kinetic data to obtain the
best-fitted values of k.
Results
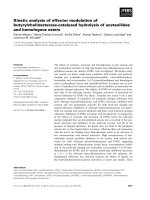
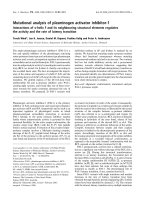
Unfolding of HSA was monitored by the Nile red
fluorescence
Free Nile red in aqueous solution had negligible fluores-
cence but its fluorescence increased 18-fold upon the
addition of 2 l
M
HSA (Fig. 1A). The equilibrium unfolding
pathways of HSA were investigated using environment-
sensitive Nile red fluorescence. The fluorescence intensity of
the HAS-bound Nile red varied in a complex fashion with
increasing concentration of GdnHCl (Fig. 1A). For exam-
ple, the fluorescence intensity increased in the presence of
0.25
M
GdnHCl and decreased at higher concentrations of
GdnHCl (Fig. 1A). The changes in fluorescence intensity at
Ó FEBS 2004 Mechanism of folding and unfolding of HSA (Eur. J. Biochem. 271) 1791
615 nm of the HSA–Nile red complex along with the
changes in the wavelength of emission maximum with
increasing concentration of GdnHCl are shown in Fig. 1B.
The fluorescence intensity of HSA–Nile red complex
increased by % 44% in the presence of 0.25
M
GdnHCl
and the intensity did not change until 1.5
M
GdnHCl. The
fluorescence intensity of free Nile red (in the absence of
HSA) was increased only by 6% in the presence of 0.25
M
GdnHCl showing that the increased fluorescence intensity
of the HSA–Nile red complex in the presence of 0.25
M
GdnHCl was not due to an increase in the quantum yield of
the unbound Nile red. Further, there was a minimal increase
(3 nm) in the emission maximum of HSA–Nile red complex
fluorescence up to 1.5
M
GdnHCl (Fig. 1B). Beyond 1.5
M
GdnHCl, the fluorescence intensity of bound Nile red
decreased sharply with increasing concentration of GdnHCl
accompanied by a large red shift (26 nm) of the wavelength
of emission maximum (Fig. 1B). The unfolding of HSA
appeared to occur through two transitions with the
formation of an intermediate (Fig. 1B). The first transition
occurred at low concentrations of GdnHCl (< 1.5
M
)that
increased the exposure of the hydrophobic surface around
Nile red binding site on HSA and the second unfolding
transition destroyed most of the hydrophobic surfaces of the
protein. The calculated value for the mid-point of unfolding
transition (D
m
) was 2.0 ± 0.01
M
GdnHCl.
The enhanced Nile red fluorescence in the presence of low
concentrations of GdnHCl may be due to either an increase
in the Nile red binding to HSA or due to an increase in the
quantum yield of the HSA-bound Nile red. To discern the
possibilities, the dissociation constants of Nile red binding
to HSA were determined under mild denaturation condi-
tions. The dissociation constants (K
d
) of Nile red and HSA
interaction were found to be 0.39 ± 0.03 l
M
in the absence
of GdnHCl, 0.42 ± 0.04 l
M
in the presence of 1
M
GdnHCl and 1.72 ± 0.32 l
M
in the presence of 2.2
M
GdnHCl. The data indicated that the observed increase in
Nile red fluorescence at low concentrations of GdnHCl was
not due to an increase of Nile red binding to HSA. Further,
theincreaseinNilered(0.5l
M
) fluorescence was measured
in the presence of low (2 l
M
) and high (50 l
M
) concentra-
tions of HSA. In the presence of 50 l
M
HSA, the free Nile
red concentration would be negligible since the K
d
of the
Nile red and HSA interaction was 0.39 ± 0.03 l
M
.
GdnHCl (1
M
) increased the bound Nile red fluorescence
44.8 ± 2.9% in the presence of 2 l
M
HSA and
44.7 ± 2.0% in the presence of 50 l
M
HSA compared to
control (in the absence of GdnHCl). The data suggested
that the increase in Nile red fluorescence in the presence of
1
M
GdnHCl was due to an increase in the quantum yield of
the HSA-bound Nile red.
We also investigated whether low concentrations of
GdnHCl (0.25
M
,0.5
M
and 1
M
) could induce the aggre-
gation of HSA by using a standard light scattering
technique [35,36]. Low concentrations of GdnHCl did not
increase the light scattering signal at 400 nm compared
to the control HSA (in the absence of GdnHCl) signal
suggesting that low concentrations of GdnHCl did not
induce aggregation of HSA (data not shown).
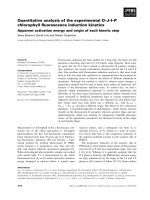
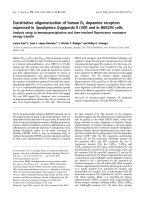
Steady-state unfolding of HSA was probed by tryptophan
fluorescence and bilirubin binding
There was a minimal (% 8%) increase in the tryptophan
fluorescence of HSA in the presence of low concentrations
of GdnHCl (0.6
M
)1.4
M
) (Fig. 2). However, tryptophan
fluorescence decreased sharply beyond 1.6
M
GdnHCl
indicating that the unfolding process is cooperative. The
limiting fluorescence intensity was reached at 4
M
GdnHCl.
The tryptophan fluorescence intensity changes were fitted
in a two state transition model that yielded a D
m
value of
2.0 ± 0.01
M
.
Bilirubin binds to HSA at drug binding site I of the
domain II [37,38]. As shown in Fig. 2, bilirubin binding
was minimally altered at low concentrations (< 2
M
)of
GdnHCl but the binding of bilirubin to HSA decreased
Fig. 1. The fluorescence spectrum of HSA-bound Nile red in the absence
and presence of GdnHCl. (A) Absence of GdnHCl (n), with 0.25
M
(,), 2
M
(m), 4
M
(h)and7
M
GdnHCl (d). Free Nile red (0.5 l
M
)
fluorescence spectrum in the absence of HSA was denoted by (s). The
fluorescence intensities of HSA-bound Nile red at 615 nm (s)and
emission maximum (d) are plotted against GdnHCl concentration in
(B). All spectra were corrected by subtracting the appropriate blank
(spectra containing 0.5 l
M
Nile red in the presence of different con-
centrations of GdnHCl in the absence of HSA) from the original
spectra.
1792 M. K. Santra et al. (Eur. J. Biochem. 271) Ó FEBS 2004
sharply beyond 2
M
GdnHCl. The nonlinear regression
analysis of the data in a two state transition model produced
a D
m
value of 2.5 ± 0.1
M
.
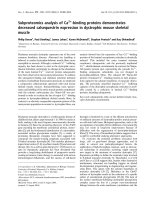
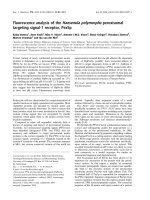
Secondary structural changes during equilibrium
unfolding and refolding of HSA monitored by far-UV CD
The far-UV CD spectra was not perturbed by % 1.5
M
GdnHCl indicating that the secondary structure of HSA
was not detectably changed (Fig. 3A). However, higher
concentrations of GdnHCl perturbed the far-UV CD
spectra of HSA in a concentration-dependent fashion
(Fig. 3A). The changes in CD at 220 nm with increasing
GdnHCl concentration are shown in Fig. 3B. The D
m
value
was calculated to be 2.8 ± 0.1
M
and the complete loss
of secondary structure occurred at 5
M
GdnHCl (Fig. 3B).
The refolding isotherm was found to be similar to the
unfolding isotherm and the D
m
was estimated to be
2.8 ± 0.2
M
(Fig. 3B). The data indicated that HSA
undergoes reversible folding process.
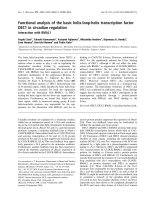
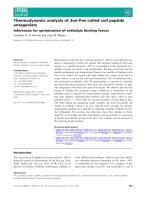
Kinetics of HSA refolding was probed by tryptophan
fluorescence, Nile red fluorescence and far-UV CD
spectroscopy
Tryptophan fluorescence has been used extensively to
monitor the recovery of tertiary structure during the
refolding processes of several proteins [39,40]. We also
examined the refolding kinetics of HSA by monitoring the
intrinsic tryptophan fluorescence spectra of HSA at differ-
ent time points (Fig. 4A). The kinetics of refolding appeared
to follow two phases, a burst phase and a slow phase
(Fig. 4B). During the burst phase, 50% recovery of the
tryptophan fluorescence occurred at 30 s of refolding.
However, the complete recovery of the tryptophan fluores-
cence took almost 2 h indicating that the remaining part of
the folding occurred through a slow phase. The rate
constant of the burst phase of the refolding step could not
be estimated due to the lack of sufficient data points. The
apparent rate of the slow phase was estimated to be
0.016 ± 0.002 min
)1
by fitting the data in Eqn (5). The
fluorescence intensity of the native HSA did not change
during the experimental duration.
The kinetics of refolding was also measured by the
recovery of the Nile red fluorescence as described in
Experimental procedures. The kinetics of refolding of
HSA appeared to be bi-phasic (Fig. 5). The burst phase of
refolding occurred rapidly with 71% of refolding happened
within the first 2 min of dilution in GdnHCl-free buffer. In
the slow phase of refolding almost 90% of folding was
observed by 10 min of refolding. The apparent rate constant
of the slow phase was estimated to be 0.12 ± 0.02 min
)1
by
fitting the data points of the slow phase in Eqn (5).
Fig. 2. GdnHCl-induced unfolding of HSA was probed by the intrinsic
tryptophan fluorescence (s) and bilirubin binding (d). Intrinsic trypto-
phan fluorescence intensities at 340 nm were recorded from the emis-
sion spectra and the fluorescence intensities were normalized against
the tryptophan fluorescence intensity of the native HSA. The inter-
action of bilirubin with HSA was monitored by the change in
absorbance at 475 nm.
Fig. 3. The effect of GdnHCl on the far-UV CD spectra of HSA. (A)
CD spectra of HSA in the absence (s) and presence of 1.5
M
(d),
2.5
M
(n)and6
M
(m)GdnHCl.(B)The220nmCDsignalsatdif-
ferent concentrations of GdnHCl were normalized with respect to the
control signal (in the absence of GdnHCl) and plotted against GdnHCl
concentrations (B) during unfolding (s) and refolding of HSA (d).
HSA (2 l
M
) in the absence of GdnHCl was used as the control.
Ó FEBS 2004 Mechanism of folding and unfolding of HSA (Eur. J. Biochem. 271) 1793
Finally, the refolding kinetics of HSA was examined by
monitoring the increase of far-UV CD signals with time
(Fig. 6). Almost complete (> 98%) recovery of the 220 nm
CD signal was observed within the first 30 s of refolding
(Fig. 6, inset). Thus, the formation of the secondary
structure of HSA occurred at much faster rate than the
formation of the tertiary structure as probed by the recovery
of tryptophan fluorescence and Nile red fluorescence.
Refolding of HSA in the presence of different
concentrations of GdnHCl probed by Nile red
fluorescence
Using Nile red fluorescence, we detected an intermediate
state in the unfolding pathway of HSA (Fig. 1A). To verify
that the intermediate state was indeed a part of the folding
pathway, and not an experimental artefact, refolding
kinetics of HSA in the presence of different concentrations
of GdnHCl were performed (Fig. 7). After unfolding HSA
in 6
M
GdnHCl, refolding was initiated by appropriate
dilution of the unfolded protein in phosphate buffer
containing varying concentrations of GdnHCl and the
recovery of the Nile red fluorescence was monitored. During
refolding process, the fluorescence intensity of Nile red
Fig. 4. Kinetics of HSA refolding monitored by tryptophan fluorescence.
(A) Tryptophan spectra of 2 l
M
HSA in the absence (s) and presence
of 6
M
(d) GdnHCl. The spectra defined by the symbols h, n, m and
(,) represent 30 s, 45 min, 90 min and 120 min of refolding,
respectively. (B) Fraction of tryptophan fluorescence recovery (s)at
different time points. The fluorescence (n)ofthenativeHSA(2l
M
)
did not change during the duration of the experiment. The extent of
refolding was calculated as described in Experimental procedures.
Fig. 5. Kinetics of HSA refolding measured by Nile red fluorescence.
The refolding kinetics (s) of HSA was measured by the fluorescence
intensity of the HSA–Nile red complex at 615 nm. The fluorescence
intensities of the native HSA–Nile red complex (n) and the completely
unfolded HSA–Nile red complex (h) did not change during the
experiment.
Fig. 6. Kinetics of secondary structure formation of HSA during
refolding. The recovery of secondary structure was monitored by
monitoring far UV-CD spectra at different time points. The figure
shows the spectra taken at 30 s (d)and20min(n) after dilution. The
far UV-CD spectra of 2 l
M
native HSA (s) in the absence of GdnHCl
and 2 l
M
unfolded HSA (m) in the presence of 6
M
GdnHCl are also
shown for comparison. The fractional recovery of the 220 nm CD
signal is shown (inset).
1794 M. K. Santra et al. (Eur. J. Biochem. 271) Ó FEBS 2004
changed in a manner that was observed during the
unfolding process of HSA indicating that an intermediate
was also formed in the folding pathway. The fluorescence
intensity of the intermediate state remained constant for a
narrow GdnHCl concentration range for the longer incu-
bation time. The estimated D
m
values were 2.2 ± 0.1
M
,
2±0.01
M
and 1.5 ± 0.1
M
for 1 h, 12 h and 24 h of
refolding, respectively. The results together indicated that
the stability of the intermediate state decreased with
increasing incubation time.
Ligand binding properties of the refolded HSA
HSA was completely unfolded by incubating with 6
M
GdnHCl for 1 h. After removal of GdnHCl, the ligand
binding ability of the refolded HSA was compared with that
of the native HSA. Bilirubin, dicumarol and ANS were
found to bind to the native and refolded HSA similarly
showing that the refolded HSA regained its ligand binding
ability completely (data not shown). In addition, trypto-
phan fluorescence spectra and far-UV CD spectra of the
native HSA and refolded HSA were found to be identical.
The results together showed that no misfolding occurred
during the refolding process and that the unfolding of HSA
was completely reversible. Previous studies also showed that
the GdnHCl-induced unfolding of HSA was reversible
[13,41].
Discussion
The highly cooperative changes in tryptophan fluorescence,
bilirubin absorbance and the far-UV CD spectra suggested
that the unfolding process of HSA involves only a native
and an unfolded state, i.e. the reaction follows a two-state
process (Figs 2 and 3). However, the initial increase and the
subsequent decrease of Nile red fluorescence at low and
high concentrations of GdnHCl indicated that at least
one relatively stable intermediate was formed during the
unfolding of HSA. Similar to unfolding, at least one
intermediate was detected in the folding profile of HSA
using Nile red fluorescence. The stability of the equilibrium
refolding intermediate was found to decrease in the presence
of moderate concentrations of GdnHCl with increasing
incubation time. The Nile red fluorescence of the inter-
mediate was found to increase with incubation time
suggesting that the nature of the intermediate changed after
prolonged incubation with GdnHCl (Fig. 7). The increase
in the Nile red fluorescence of the intermediate with
incubation time could be due to an increase in the
hydrophobic environment surrounding the probe. The
multidomain structure of HSA could be the structural basis
of the formation of the equilibrium intermediate, as the
domains may unfold and fold independently.
Despite overlap in the effective GdnHCl concentrations
needed to unfold HSA, the GdnHCl-induced unfolding of
HSA occurred in a stepwise fashion. The calculated D
m
values for GdnHCl-induced unfolding of HSA probed by
tryptophan fluorescence, Nile red fluorescence and far-UV
CD were 2.0 ± 0.01
M
, 2.0 ± 0.01
M
and 2.8 ± 0.2
M
,
respectively. Thus, the tertiary structure was lost at a lower
concentration of GdnHCl compared to the secondary
structure suggesting that the secondary structure of HSA is
more stable than its tertiary structure. The first unfolding
transition that occurred in the presence of 0.25
M
GdnHCl
was accompanied by a significant increase (% 45%) in the
fluorescence intensity of the HSA–Nile red complex
(Fig. 1B). The fluorescence intensity of free Nile red was
increased only 6% by the low concentration of GdnHCl
showing that the enhanced fluorescence of the HSA–Nile
red complex was not caused by an increase of the quantum
yield of the free Nile red. Interestingly, the dissociation
constant of HSA and Nile red interaction did not change in
the presence of low concentrations of GdnHCl. Further, the
fluorescence intensity of the fully bound Nile red (in the
presence of 100-fold excess HSA) also increased by % 45%
in the presence of 1
M
GdnHCl indicating that the increased
fluorescence intensity at low concentration of GdnHCl was
due mainly to an increase in the quantum yield of the Nile
red and not due to the generation of new Nile red binding
sites. It appears that low concentrations of GdnHCl induce
rearrangement of hydrophobic surfaces around Nile red
binding site on HSA in a way that the probe experiences
more hydrophobic environment than the native conforma-
tion of HSA, which results in an increase in the quantum
yield of the bound probe. The CD analysis showed that no
significant alteration in the secondary structure occurred
during the first unfolding transition, indicating that the first
transition involves local tertiary structure rearrangement,
with no detectable change in secondary structure. Low
concentration (<1.5
M
) of GdnHCl minimally altered the
intrinsic tryptophan fluorescence of HSA. Therefore, the
intermediate state that was detected by the Nile red
fluorescence has native-like secondary structure and tertiary
topology but it contained 45% more exposed hydrophobic
surface than the native HSA.
Upon removal of GdnHCl, HSA gained its tryptophan
fluorescence, secondary structure and ligand binding abil-
ities indicating that HSA undergoes reversible folding and
unfolding processes (Figs 4–6 [13]). However, the equilib-
rium refolding profile of HSA monitored by the Nile red
Fig. 7. Equilibrium refolding of HSA in the presence of different con-
centrations of GdnHCl. The recovery of the Nile red fluorescence at 1 h
(d), 12 h (m)and24h(n) was monitored as described in the
Experimental procedures.
Ó FEBS 2004 Mechanism of folding and unfolding of HSA (Eur. J. Biochem. 271) 1795
fluorescence did not match well with that of the unfolding
profile in the presence of GdnHCl (Fig. 1B and Fig. 7). The
disparity between the unfolding and refolding profiles of
HSA suggested that the intermediates formed during the
folding and unfolding processes in the presence of GdnHCl
were not identical. Some misfolded off-pathway intermedi-
ates could also be formed when the unfolded HSA was
incubated with moderate concentrations of GdnHCl for
longer durations (Fig. 7).
The refolding process was initiated by diluting the
unfolded HSA in GdnHCl-free buffer. The far-UV CD
spectrum of refolded HSA was indistinguishable from that
of the native protein within 30 s of dilution while the protein
recovered only 50% of its tryptophan fluorescence at 30 s
(Figs 4 and 6). The data suggested that the folding pathway
of HSA involved at least one intermediate (I), which
contained native-like secondary structures but only a partial
tertiary structure. The pattern of the recovery of the
tryptophan fluorescence intensity indicated that the folding
of HSA occurred in a biphasic manner, a burst phase
followed by a slow phase. The slow phase may be due to
some kinetically unfavourable structural rearrangements of
the protein. Like tryptophan fluorescence, the Nile red
fluorescence intensity also showed a similar kinetic pattern
of HSA refolding; 71% of the Nile red fluorescence was
recovered within 2 min of refolding while the recovery of
the remaining fluorescence was a relatively slow process
(Fig. 5). The initial burst phase was not detectable using
Nile red fluorescence because the kinetics of Nile red
binding to HSA was a much slower process than the burst
phase of the refolding. Although, the estimated values of the
apparent rate constants of the slow phase obtained from
tryptophan and Nile red fluorescence differed from each
other, both probes showed a similar overall pattern of
refolding kinetics of HSA, a burst phase followed by a slow
phase of refolding. The change in the fluorescence intensity
of a probe depends on the change in its surroundings. The
discrepancy in the rate constants of the slow phase may be
due to a difference in the rates of folding of the local
environment of the probes. Taken together, the results of
the kinetic studies suggested that an intermediate was
formed at the burst phase of refolding, which contained
most of the secondary structures of the native state but did
not have native-like rigid side chain packing and subse-
quently, the intermediate refolded to the native state (N)
through a slow phase. Therefore, the refolding scheme of
HSA can be described as:
U ÀÀÀÀ!
Burst
I ÀÀÀÀ!
Slow
N
The secondary structure of HSA was completely formed
within 30 s of refolding whereas only 50% of the trypto-
phan fluorescence was recovered within that time suggesting
that the secondary structure of HSA was completed prior
to the completion of tertiary structure. The data suggested
that the folding of HSA follows a framework model wherein
the formation of the tertiary structure occurs through a
hierarchical assembly of the local elements of the secondary
structures [29–31]. However, we cannot rule out the
possibility that a native-like tertiary topology started to
form at a very early stage of folding as 50% of the
tryptophan fluorescence and 71% of Nile red fluorescence
were recovered by 30 s and 2 min of refolding, respectively,
supporting a hierarchical framework-like model for the
folding of HSA. The hierarchical framework model is an
extended version of the framework model where some
extent of the tertiary structures is also formed along with the
secondary structure [31,32]. The subtle difference between
the framework model and the hierarchical framework-like
model makes it very difficult to distinguish between these
models because a native-like tertiary backbone was also
found to exist for several proteins at very early stages of
folding although the formation of the secondary structure
preceded the formation of the tertiary structure [30,42–44].
Acknowledgements
We thank I.N.N. Namboothiri, D. Dasgupta and P. Ghosh for critical
reading of the manuscript. This work was supported by a grant to D. P.
from the Department of Science and Technology, Government of India
and a Council of Scientific and Industrial Research fellowship to
M. K. S. from the Government of India.
References
1. Berde,C.B.,Hudson,B.S.,Simoni,R.D.&Sklar,L.A.(1979)
Human serum albumin. Spectroscopic studies of binding and
proximity relationships for fatty acids and bilirubin. J. Biol. Chem.
254, 391–400.
2. Peters, T. (1985) Serum albumin. Adv. Protein Chem. 37, 161–245.
3. Sjoholm, I., Ekman, B., Kober, A., Ljungstedt-Pahlman, I., Sei-
ving, B. & Sjodin, T. (1979) Binding of drugs to human serum
albumin. XI. The specificity of three binding sites as studied with
albumin immobilized in microparticles. Mol. Pharmacol. 16, 767–
777.
4. Kragh-Hansen, U. (1988) Evidence for a large and flexible region
of human serum albumin possessing high affinity binding sites
for salicylate, warfarin, and other ligands. Mol. Pharmacol. 34,
160–171.
5. Nerli, B., Romanini, D. & Pico
´
, G. (1997) Structural specificity
requirements in the binding of beta lactam antibiotics to human
serum albumin. Chem. Biol. Interacts 104, 179–202.
6. He,X.M.&Carter,D.C.(1992)Atomicstructureandchemistry
of human serum albumin. Nature 358, 209–215.
7. Carter, D.C. & Ho, J.X. (1994) Structure of serum albumin. Adv.
Protein Chem. 45, 152–203.
8. Das, B.K., Bhattacharyya, T. & Roy, S. (1995) Characterization
of a urea induced molten globule intermediate state of glutaminyl-
tRNA synthetase from Escherichia coli. Biochemistry 34, 5242–
5247.
9. Jansens, A., van Duijn, E. & Braakman, I. (2002) Coordinated
nonvectorial folding in a newly synthesized multidomain protein.
Science 298, 2401–2403.
10. Muzammil, S., Kumar, Y. & Tayyab, S. (1999) Molten globule-
like state of human serum albumin at low pH. Eur. J. Biochem.
266, 26–32.
11. Tayyab, S., Siddiqui, M.U. & Ahmad, N. (1995) Experimental
determination of the free energy of unfolding of proteins.
Biochemistry 23, 162–164.
12. Muzammil, S., Kumar, Y. & Tayyab, S. (2000) Anion-induced
stabilization of human serum albumin prevents the formation of
intermediate during urea denaturation. Proteins: Struct. Funct.
Genet. 40, 29–38.
13. Krishnakumar, S.S. & Panda, D. (2002) Spatial relationship
between the prodan site, Trp-214, and Cys-34 residues in human
serum albumin and loss of structure through incremental
unfolding. Biochemistry 41, 7443–7452.
1796 M. K. Santra et al. (Eur. J. Biochem. 271) Ó FEBS 2004
14. Flora,K.,Brennan,J.D.,Baker,G.A.,Doody,M.A.&Bright,
F.V. (1998) Unfolding of acrylodan-labeled human serum albu-
min probed by steady-state and time-resolved fluorescence meth-
ods. Biophys. J. 75, 1084–1096.
15. Baldwin, R.L. (1996) On-pathway versus off-pathway folding
intermediates. Fold. Des. 1, R1–R8.
16. Baldwin, R.L. (2001) Folding consensus? Nat. Struct. Biol. 8,
92–94.
17. Kim, P.S. & Baldwin, R.L. (1982) Specific intermediates in the
folding reactions of small proteins and the mechanism of protein
folding. Annu.Rev.Biochem.51, 459–489.
18. Roder, H. & Colon, W. (1997) Kinetic role of early intermediates
in protein folding. Curr. Opin. Struct. Biol. 7, 15–28.
19. Sosnick, T.R., Mayne, L., Hiller, R. & Englander, S.W. (1994)
The barriers in protein folding. Nat. Struct. Biol. 1, 149–156.
20. Weissman, J.S. & Kim, P.S. (1992) Kinetic role of nonnative
species in the folding of bovine pancreatic trypsin inhibitor. Proc.
NatlAcad.Sci.USA89, 9900–9904.
21. Ptitsyn, O.B. (1995) Structures of folding intermediates. Curr.
Opin. Struct. Biol. 5, 74–78.
22. Creighton, T.E., Darby, N.J. & Kemmink, J. (1996) The roles
of partly folded intermediates in protein folding. FASEB J. 10,
110–118.
23. Privalov, P.L. (1996) Intermediate states in protein folding. J. Mol.
Biol. 258, 707–725.
24. Ferguson, N. & Fersht, A.R. (2003) Early events in protein fold-
ing. Curr. Opin. Struct. Biol. 13, 75–81.
25. Daggett, V. & Fersht, A.R. (2003) Is there a unifying mechanism
for protein folding. Trends Biochem. Sci. 28, 18–25.
26.Levitt,M.,Gerstein,M.,Huang,E.,Subbiah,S.&Tsai,J.
(1997) Protein folding: the endgame. Annu. Rev. Biochem. 66,
549–579.
27. Nolting, B. & Andert, K. (2000) Mechanism of protein folding.
Proteins 41, 288–298.
28. Tsong, T.Y. & Baldwin, R.L. (1972) Kinetic evidence for inter-
mediate states in the unfolding of ribonuclease A. II. Kinetics of
exposure to solvent of a specific dinitrophenyl group. J. Mol. Biol.
63, 453–475.
29. Wetlaufer, D.B. (1973) Nucleation, rapid folding, and globular
intrachain regions in proteins. Proc. Natl Acad. Sci. USA 70,
697–701.
30. Chakraborty, S. & Peng, Z. (2000) Hierarchical unfolding of the
alpha-lactalbumin molten globule: presence of a compact inter-
mediate without a unique tertiary fold. J. Mol. Biol. 298, 1–6.
31. Baldwin, R.L. & Rose, G.D. (1999) Is protein folding hierarchic?
II. Folding intermediates and transition states. Trends Briochem.
Sci. 24, 77–83.
32. Baldwin, R.L. & Rose, G.D. (1999) Is protein folding hierarchic?
I. Local structure and peptide folding. Trends Briochem. Sci. 24,
26–33.
33. Kim, P.S. & Baldwin, R.L. (1990) Intermediates in the folding
reactions of small proteins. Annu. Rev. Biochem. 59, 631–660.
34. Santoro, M.M. & Bolen, D.W. (1988) Unfolding free energy
changes determined by the linear extrapolation method. 1.
Unfolding of phenylmethanesulfonyl alpha-chymotrypsin using
different denaturants. Biochemistry 27, 8063–8068.
35. Santra, M.K. & Panda, D. (2003) Detection of an intermediate
during unfolding of bacterial cell division protein FtsZ: loss of
functional properties precedes the global unfolding of FtsZ.
J. Biol. Chem. 278, 21336–21343.
36. Bhattacharyya, A., M. & Horowitz, P.M. (2001) The aggregation
state of rhodanese during folding influences the ability of GroEL
to assist reactivation. J. Biol. Chem. 276, 28739–28743.
37. Chen, R.F. (1974) Fluorescence stopped-flow study of relaxation
processes in the binding of bilirubin to serum albumins. Arch.
Biochem. Biophys. 160, 106–112.
38. Harmatz, D. & Blauer, G. (1975) Optical properties of bilirubin-
serum albumin complexes in aqueous solution. A comparison
among albumins from different species. Arch. Biochem. Biophys.
170, 375–383.
39. Ogasahara, K. & Yutani, K. (1994) Unfolding-refolding kinetics
of the tryptophan synthase alpha subunit by CD and fluorescence
measurements. J. Mol. Biol. 236, 1227–1240.
40. Sridevi, K., Juneja. J., Bhuyan, A.K., Krishnamoorthy, G. &
Udgaonkar, J.B. (2000) The slow folding reaction of barstar: the
core tryptophan region attains tight packing before substantial
secondary and tertiary structure formation and final compaction
of the polypeptide chain. J. Mol. Biol. 302, 479–495.
41. Wallevik, K. (1973) Reversible denaturation of human serum
albumin by pH, temperature, and guanidine hydrochloride fol-
lowed by optical rotation. J. Biol. Chem. 248, 2650–2655.
42. Wu, L.C., Peng, Z.Y. & Kim, P.S. (1995) Bipartite structure of the
alpha-lactalbumin molten globule. Nat. Struct. Biol. 2, 281–286.
43. Rischel, C., Thyberg, P., Rigler, F. & Poulsen, F.M. (1996) Time-
resolved fluorescence studies of the molten globule state of apo-
myoglobin. J. Mol. Biol. 257, 877–885.
44. Peng, Z.Y. & Kim, P.S. (1994) A protein dissection study of a
molten globule. Biochemistry 33, 2136–2141.
Ó FEBS 2004 Mechanism of folding and unfolding of HSA (Eur. J. Biochem. 271) 1797