Effect of Fund Size on the Performance of Mutual Funds Evidence from Iran pdf
Bạn đang xem bản rút gọn của tài liệu. Xem và tải ngay bản đầy đủ của tài liệu tại đây (464.96 KB, 14 trang )
J. Basic. Appl. Sci. Res., 2(7)6889-6902, 2012
© 2012, TextRoad Publication
ISSN 2090-4304
Journal of Basic and Applied
Scientific Research
www.textroad.com
*Corresponding Author: Majid Abbasi, Department of Accounting, Payam-e-Noor University, Behshahr, Mazandaran
province, Iran
Effect of Fund Size on the Performance of Mutual Funds
Evidence from Iran
Majid Abbasi
1
, Elham Kalantari
2
, Hamideh Abbasi
3
1
Department of Accounting, Payam-e-Noor University, Behshahr, Mazandaran province,
2
Department of Business Management, Payam-e-Noor University, Karaj, alborz province, Iran
3
Department of Business Management, Abhar Branch, Islamic Azad University, Abhar, Zanjan province, Iran
ABSTRACT
Mutual Fund is one of the most important mechanisms for indirect investment in financial markets, which
provides better conditions in terms of risk and return, especially for amateur investors.
This research examined the effect of fund size on the performance of Iranian mutual funds. The research was
carried out on all Iranian mutual funds during 2007 to 2011.There are several aspects and dimensions in
evaluating the performance of mutual funds, but this study focused on five aspects: namely Sharpe measure;
Jensen differential measure; Treynor measure; Sortino measure and Information measure. Correlation
coefficients between all the parameters were computed to assess the degree of relationship between fund size
and performance of mutual funds. The findings highlighted no significant relationship between fund size and
performance, whether Fixed Income Instruments or Big and Small Cap Stock mutual funds.
KEYWORDS: Mutual funds, Fund Performance, Fund Size, Iran
1- INTRODUCTION
Mutual fund is basically a company that pools the money from a group of investors (its shareholders) to
buy financial securities, building a less risky portfolio than an individual investor would do. In other words,
a mutual fund is a company that invests in a diversified portfolio of securities. People who buy shares of a
mutual fund are its owners or shareholders. Their investments provide the money for the mutual fund to buy
securities such as stocks and bonds. A mutual fund can make money from its securities in two ways: a
security can pay dividends or interest to the fund or a security can rise in value. A fund can also lose money
and drop in value. The reduced risk of portfolio comes from the benefits of diversification provided by
mutual fund managers for investors. Managers charge small amount of fees for their services and for
covering the costs associated with trading securities. However, these charges are smaller than those that
individual investors would pay if they tried to build on their own similar portfolio of securities. This is
because of the economies of scales in transaction costs (Howells & Bain, 2005, p. 63). Mutual funds today
are one of the most studied areas in developed countries due to their efficient and effective role in reducing
risk and enhancing return through professional management of funds. These funds boost the incomes of
small investors as well as reduce their exposure to unsystematic risks which needs to be taken into
consideration for accurate results (Gohar et al., 2011, p. 5583). Rouwenhorst (2004) tracked origins of the
mutual funds and found that the first fund was created in Holland in 1774 (Kolosov & Soltanmammedov,
2011). The Massachusetts Investors Trust, offered in the United States in 1924, was the first mutual fund.
The first British mutual fund structure was the Foreign Government Bond Trust which was offered in 1934
1
.
Depending on the regulation of a country, funds are grouped in different types to enable investors to
compare funds and make sound investment decisions. European Fund Classification (EFC) system
categorizes funds in four general types; equity, bond, money market and mixed funds
2
. Accordingly, the
EFC (2008) classifies the equity funds, possibly most popular type of funds, which invest at least 85 percent
of their total assets in equities/stocks. There are equity funds with different investment strategies and risks
that invest in particular country, region or an industry.
Mutual funds are also defined as managed investment companies which are classified in two general
types: closed-end and open-ended funds. Closed-end funds issue a fixed number of shares that are traded on
stock exchanges. Investors in closed-end funds cannot purchase or redeem shares directly from the fund;
instead, they can sell shares to other investors on the organized market. Thus, the market price of closed-end
fund shares is generally determined by supply and demand forces; therefore, it differs from NAV of the
funds. In contrast, open-ended funds are not traded on exchanges rather they can be bought from and sold to
1
. For enlightening histories of the early global fund industry, see Merriman (1965), Day and Harris (1974), and Rouwenhorst (2003).
2
. European Fund and Asset Management Association (2008) The European Fund Classification. June 2008
68
89
Abbasi et al., 2012
the fund at the price based on the current NAV. Investors in open-ended funds can redeem shares at any
time. Also, open-ended funds can issue new shares on demand (Kolosov & Soltanmammedov, 2011, p.14).
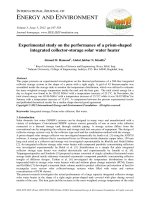
1-1- Attributes and Benefits of Mutual Funds
It was already mentioned that mutual funds provide some benefits which would be hard to achieve for
individual investors on their own. These main benefits are professional management of portfolios, low
expenses, liquidity, diversification, etc. In Figure (1), the advantages of investing in mutual funds are shown.
Figure (1): Benefits of mutual funds
The mutual fund industry has become a significant player in the capital markets. The size of the industry
has increased from about $50 billion in 1970 to about $12 trillion in 2010
1
.The U.S. mutual fund market
with $11.8 trillion in assets under management at year-end 2010 remained the largest in the world,
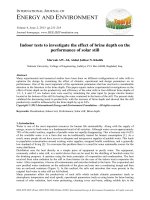
accounting for 48 percent of the $24.7 trillion in mutual fund assets worldwide (Figure 2). Equity funds
made up 48 percent of the U.S. mutual fund assets at year-end 2010. Domestic equity funds (those that
invest primarily in shares of the U.S. corporations) held 35 percent of total industry assets. World equity
funds (those that invest primarily in foreign corporations) accounted for another 13 percent. Money market
funds accounted for 24 percent of the U.S. mutual fund assets. Bond funds (22 percent) and hybrid funds (6
percent) held the remainder of total U.S. mutual fund assets.
Figure (2): Percentage of total net assets, year-end 2010
Source: ICI (Investment Company Institute's 2011 fact book)
1-2-Iranian Mutual Funds
Mutual funds in Iran, acting as financial intermediaries, have the potential to convert the investments made
by nonprofessional investors from a direct state to an indirect one and, in the wake of such conversion; they
will bring about a wide range of benefits and privileges both for capital markets and investors, which include:
1) Promoting indirect investment by individuals in the capital market;
2) Paving the way for quantitative and qualitative growth and sustainable development in the capital
market.
Mutual funds in Iran are among those financial institutions which have been established in the recent
years and are therefore not mentioned in most principal rules and regulations of national economic activities,
including the commercial code, companies registration law, civil code and taxation law. They were first
presented in the Securities Market Act of Iran, ratified by the Parliament (Pireh, 2011). So, in the new
Securities Market Act of I.R.I, the activity of financial intermediaries, including mutual funds, is foreseen
1
. Data is taken from the Investment Company Institute's 2011 fact book available at www.ici.org.
Professional
management
Low expenses and
fees: economies of
scale
Liquidity
Professional
Website
Information
Dissemination
On Line
Supervision
Diversification
Characteristics of
Mutual funds
68
90
J. Basic. Appl. Sci. Res., 2(7)6889-6902, 2012
and proper conditions are provided to assure the securities market investors about making better use of the
existing opportunities. In the article “The Law for Development of New Financial Instruments and
Institutions Based on the Overall Policies of the Principle 44 of the Constitution”, which was ratified in
2009, mutual funds were defined as follows:
“A financial institution which invests in the financial resources derived from issuance of units, in its
designated area of activity.”
Therefore, mutual fund is a kind of financial institution which pools the people’s funds by frequently
selling its units and invests the funds in a combination of different types of securities, including stocks,
Musharakah Sukuk
1
, short-term instruments of the money market, etc.
The combinations of the fund’s assets are known as the fund’s portfolio and purchasers of the fund’s
units, in proportion to their investments, would be the owner of a part of the fund. In other words, each unit
represents the investors’ ownership of the fund’s assets and the revenue of such assets.
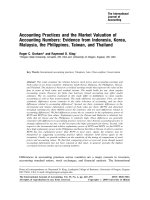
1-3- Operational Structure of Mutual Funds in Iran
The funds which are established in Iran’s Capital Market, albeit a number of similarities in operational
structure, are a little bit different from the funds around the world . The whole structures of the Iranian
mutual funds are shown in Figure (3).
Figure (3): Iranian mutual funds structure
Source: (Islamic Consultative Assembly) in 2005
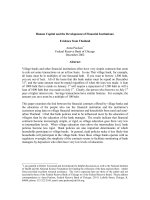
1-4- Iranian Mutual Fund NAV Index (IMNEX):
IMNEX is an index that follows common methodology and calculation of “price indices”. It composes
all Iranian equity mutual funds and computes their NAV levels. Changes in IMNEX actually shows
weighted average returns of Iranian equity mutual funds just derived from NAV fluctuations. Iranian Mutual
Fund NAV Index (June 30, 2010) is demonstrated in Figure (4).
Figure (4): Iranian Mutual Fund NAV Index
Source: www.seo.ir
1
. Musharakah Sukuk is securities in which its holders are owners of a specified property in common. Sukukholders will gain
(lose) from any increase (decrease) in the underlying asset prices. Musharakah Sukuk has a specified maturity date, and is negotiable in
the secondary market.
68
91
Abbasi et al., 2012
IMNEX is daily computed by the following formula:
BaseValue
D
UNNAV
IMNEX
t
itit
WT
(1)
where NAV
it
= NAV of i fund at time t; UN
it
= Number of Units of i fund at time t; D
t
= Divider at time t
and Base Value = 1,000
It is noteworthy that, since trading non-Shariah compatible instruments is not permitted in Iran’s capital
market, mutual funds can invest only in Shariah compatible instruments. Therefore, in Iran, the structure of
mutual funds does not yet include any separate Shariah board (Pireh, 2011).
Mutual fund, as a financial intermediary, transforms the amateurs’ investments from direct to indirect
investment. Consequently, a proper approach is set to provide sustainable development of capital markets,
encourage indirect investment and pave the road for people to enter the market through mutual funds.
However, institutions like mutual funds can be favorable investment vehicles for most investors since they
make various portfolios of securities try to make investment more attractive and provide more opportunities,
lower risks and higher return for the investors.
Figure (5): Iranian Mutual Fund assets (by Mutual Fund Category, March 31, 2012)
Fixed Income
Mutual Fund
13.816.772
Milion Rials
76%
Medium and
Small Cap
(Stock)
3.546.077
Milion …
Big Cap (stock)
742.928 Milion
Rials
4%
Source: Financial Information Processing of Iran (FIP Iran) website:
1
All the Iranian mutual funds during 2007 to 2011 were selected for this study due to their size and
importance for Iran’s economy. Mutual funds are one of the most important parts of financial institutions
and the total fund size (assets) managed by them is 18.105.777 million Rials (in March 31, 2012) (as shown
in Figure (5)).
According to a report issued by the Securities and Exchange High Council, if investors invest in capital
market products indirectly through mutual funds, they will behave more rationally and react less to
emotional behaviors. The report states: “Now many commercial banks are launching mutual funds and
participating in the market directly or indirectly. By this, a huge amount of money is directed towards the
capital market.” Furthermore, the report stated that around 70,000 real investors and 600 legal entities were
investing in mutual fund units in Iran, as indicated in Table (1). This shows that mutual funds are becoming
attractive institutions for those who previously have not entered the market, perhaps due to its risk or lack of
information.
Table (1): Iranian Mutual Funds in Action (up to the October 01, 2011)
Entity Investors Individual
Investors
One year Return
(Average)
Value (million
Dollar)
Quantity Description Raw
267 21757 18% 1169 8 Big Cap
(Fixed Income
Instruments)
1
166 42423 32% 525 11 Big Cap
(Stock)
2
251 5978 40% 157 49 Small Cap (Stock) 3
5
119
.5%
6
1
Index Funds
4
689 70277 1857 69 Total
Source: www.seo.ir
2- The Theoretical Framework
This research aimed at examining the relationship between fund size and performance in the Iranian
mutual funds. There are many theories with regard to the evaluation of portfolio performance (Tehrani et al.,
2011). Figure 6 shows the relationship of variables with each other. Rahdari (2009) identified that using
1
. FIPIran’s website contains extensive information related to the Iranian financial market particularly the Iranian Capital Market.
68
92
J. Basic. Appl. Sci. Res., 2(7)6889-6902, 2012
several ratios in evaluating the portfolio performance is more appropriate than evaluating the portfolio
management only by one ratio. Earlier studies identified five recommended ratios that could be used more
than other ratios in evaluating the performance of portfolios. It involved Sharpe, Jensen, Treynor, Sortino
and Information ratios, which were used in this study for evaluating the performance of mutual funds.
Figure (6) – Conceptual framewok of the research
2- LITERATURE REVIEW
The first scholars who found an effect related to the size of mutual funds were Grinblatt and Titman
(1989). Grinblatt and Titman (1989) in the US found that the smaller funds achieved significantly better risk-
adjusted performance (2.5%) than larger funds. They believed that the concentration of aggressive growth
funds among the small fund category might have helped to explain the inverse relationship between size and
gross returns. Controlling for this factor, small funds however still generated higher returns than larger
funds. Consequently, the authors concluded that both fund size and investment objective cuuld determin
abnormal performance. Five years later, Grinblatt and Titman (1994) again investigated the same sample of
domestically investing mutual funds as in their 1989 study. They used net asset value as one of five
independent variables in a cross-sectional regression. Using two different benchmarks, the coefficient on the
net asset value variable was negative but insignificant regardless of the benchmark in use. According to their
second study, fund size had no effect on performance. Dermine and Roller (1992) studied French mutual
funds for the presence of economies of scale and scope and found an optimal size for a diversified company
in the range of 2.9 billion French Francs at that time, suggesting that total asset exceeded this amount leading
to the diseconomies of scale and scope. Dellva and Olson (1998) found the funds that were large in size
(measured by total assets under management) were able to achieve economies of scale and, thus, their
expense ratios were lower. Moreover, they found a negative relationship between expense ratio and
performance of funds. Some studies have reported positive results for the size-performance relationship.
Otten and Bams’s (2002) monthly survey returned for the European mutual fund industry over the years
1991-1998. Following 506 domestic equity funds from France, Germany, Italy, Netherlands and U.K., they
reported significant positive relationships between performance and fund size in all countries and attributed
the significant size-performance findings to the indication of economies of scale in European mutual funds.
In line with Indro et al. (1999), Christopherson et al. (2002) conjectured that there might exist an inverse
relationship between net asset value and performance for small-cap investment managers. Their study
contained data on small-cap managers, most of which offering a variety of products in addition to mutual
funds. The general problems connected with trading stock were, according to the authors, augmented when it
came to moving in and out of small-cap stocks. In the vein of previous studies, they sorted managers into
size quintiles. A study by Chen, Hong, Huang and Kubik (2004) was another investigation which indicated a
relationship between fund size and mutual fund performance. In their study, the data were taken from 1962
to 1999 and they used a cross-sectional variation in the investigation in order to check weather performance
depended on the fund size or not. Consistent with their hypotheses, they found that the fund size was much
more important for the return among “small cap” funds than other funds. Indeed, for other types of funds,
size did not significantly affect the performance. Chan et al (2005) presented a study on the relationship
between fund size and performance of Australian equity managers. Along the lines of the previous
researches, they reported the negative influence of fund size on manager performance. While digging deeper
towards the origin of these diseconomies of scale, the authors received results which suggested that high
fund inflows exerted purchasing pressure on the manager and resulted in picking inferior investments by the
manager and, ultimately, eroded performance. Manuel and Moerth (2005) investigated the relationship
between hedge fund size and performance and found a negative relationship between fund size and return,
except in the case of smaller funds. Larger funds, however, tended to have lower volatilities than smaller
Mutual Fund Size
Performance of
Mutual Fund
Sharpe Ratio
Treynor Ratio
Information
R
atio
Jensen Alpha
Sortino Ratio
68
93
Abbasi et al., 2012
funds and similar Sharpe ratios. Ferreira et al. (2006) checked the determinants of mutual fund performance
using four factor models for the funds from 19 countries. The major finding of the study explained that size
of the funds did matter and the performance of large funds was better. Furthermore, young funds investing
abroad performed better than other funds. The performance of funds charging higher fees and being
managed by more experienced individuals was better than others.
Many studies about the impact of firm size on portfolio performance have been done and significant
results have been expressed. For example, (Hishamuddin, 2006) in a study conducted in the Malaysian Stock
Exchange expressed that large companies had higher return and lower risk in comparison with small
companies with fewer volume of investment. He concluded that there was a negative relationship between
size and unsystematic risk in which, the larger the firm size, the unsystematic risk would be lower. In a
similar paper (Hernandez et al., 2006), distribution of company size in firms in developing and developed
countries was studied. The results showed the size of companies in developing countries was significantly
different from that in developed countries. Elton et al. (2007) found no relationship between fund size and
performance whereas Dahlquist et al. (2000) found that smaller equity funds did perform better than larger
equity funds. In his master's thesis, Lu (2007) investigated the relationshhip between firm size and
performance. He believed that increase in the size would lead to higher company turnover. Therefore, the
cost would be divided to more units and would have a positive effect on the performance of company. Even
so, positive and clear evidence in this case was not found. The main reason in this matter was the positive
perspective about increasing size of a company and its effect on performance, and its relationship with the
economic sphere and reducing transaction costs in a large volume.
Lindeen and Gros (2009) analyzed the effect of mutual fund size on performance by studying 59 Swedish
equity mutual funds over the period from July 1998 to June 2008. They argue that size can be seen as a “proxy”
for capturing the effects of various factors affecting performance and driven by size. The tested size-driven
factors include liquidity costs, economies of scale in mutual fund families, extreme net flows and persistence in
performance. Using regressions and analyzing these factors by dividing funds into groups based on fund size,
they found that no significant relationship between size and performance among the groups over the ten year
period even though small funds appeared to earn higher excess returns. Their results indicated that liquidity
costs were present in the Swedish equity market, which significantly increased with fund size. The results also
showed that there were diseconomies to scale from being part of the largest fund complexes in the Swedish
market. Ferruz et al. (2009) studied the influence of fund size on the investment strategy in Spanish mutual
fund market. As a result, large management companies followed a market timing strategy while small
management companies were better at stock picking strategies. In examining a sample of Twenty one Balanced
Mutual Funds in India between 2007 and 2010, Keswani (2010) obtained no significant relationship between
fund size and performance variables. There was no conclusive evidence that the fund size affected performance
of Balanced Mutual Funds, whether micro, small, medium or large sized funds.
Nevertheless, Lin et al., (2011) investigated how the characteristics of mutual fund managers influenced
their funds’ performance. The majority of mutual funds available to Taiwanese investors were actively
managed. Apparently, investors would expect the active equity fund managers to provide better performance
than passive managers do. They applied logistic regression, which adopted the performance of Polaris
Taiwan Top 50 Tracker Fund (TTT) as the benchmark, in order to examine the relationship between the
characteristics of fund managers and fund performance. The results indicated that fund size and the fund
manager’s gender, seniority and educational background significantly influenced the fund performance.
While all other factors are equal, investors can expect higher odds for their fund performance beating TTT if
their funds are managed by a female or a senior fund manager or by a manager graduated from domestic
public colleges or from overseas colleges.
Recently, Gohar et al. (2011) compared the performance of different types of mutual funds in Pakistan
and concluded that equity funds outperformed income funds. These funds were further classified into broker
backed and institutional backed funds for detailed analysis. The findings showed that, within equity funds,
broker backed category had better performance than institutional funds. On the other hand, among income
funds, institutional funds outperformed broker backed funds. Furthermore, it was found empirically that fund
managers were able to time their investments with the conditions in the market and possessed significant
timing ability. Their study further concluded that equity fund managers possessed significant market timing
ability and the managers of institutional funds were able to time their investments; however, broker operated
funds did not show market timing ability. Finally, Tehrani et al. (2011) tried to analyze the performance of
the investment companies listed in Tehran Stock Exchange (TSE) that had active portfolio management from
2006 to 2010 by Sharp, Treynor and Sortino ratios. For more profound study of their performances, this
research used some of the measures including turnover, liquidity, size and diversification of portfolios. The
results of the first hypothesis showed that the companies had better control on systematic risk than other
components. The result of the second hypothesis by combined ANOVA and Multiple ANOVA demonstrated
that portfolio turnover in the companies had positive and significant effect on the company's performances
68
94
J. Basic. Appl. Sci. Res., 2(7)6889-6902, 2012
than other measures. It is possible for anyone to be able to find a company that has a high level of portfolio
turnover and a high level of performance than other companies while it has a lower level of other measures.
3-1- Defining Mutual Fund Size
When performing a study on fund size, it becomes imperative how to define “fund size”. Several metrics
such as total net assets (TNA) and percentile ranking and percentage of market capitalization have been
proposed. Bird et al. (1983) and Gorman (1991) used TNA in their studies of mutual fund size. However,
Chan et al. (2005) argued that there were some obvious disadvantages in using TNA as a measure of size;
i.e., fund size may double over a number of years, but if the capitalization of the market also doubles over
that same period, then, compared with the value of shares outstanding, the relative value of the fund is not
changed and thus the fund’s investment opportunities should not be influenced by its increase in dollar value
size. A measure of fund size that scales for changes in the value of the market over time is therefore
preferable over the absolute value of the fund (Lindeen and Gros, 2009). Grinblatt and Titman (1989)
divided funds into size classes based on percentage rank of the fund size. The advantage of measuring fund
size as a percentage rank is that any changes in fund size over time due to changes in market capitalization
are controlled for.
Chan et al. (2005) proposed a third measure for defining size and calculated total net assets at the end of
the month as a proportion of total market capitalization. In this paper, a similar definition was used in which
total net assets were calculated at the end of the month as a fraction of total wealth of all active funds of that
period (total capitalization of the Iranian mutual funds segment). In practice, this meant measuring fund
market share (MS). The benefit of this definition is that it scales for dollar value increases over time due to
market growth and is fairly insensitive to the addition of new managers, altering the size position of earlier
funds in a sample (Lindeen and Gros, 2009).To define TNA, similar to Grinblatt and Titman (1989), Gorman
(1991) and Lindeen and Gros (2009), the beginning of the period portfolio TNA was also used.
3-2- ANALYSIS OF MUTUAL FUND PERFORMANCE
The main idea behind many of the performance evaluation ratios is very simple. These ratios generally
compare the return of a managed portfolio in a given time period with the return of a based selected portfolio
(George & Wayne, 2006). In other words, mutual fund performance can be analyzed through performance
measurement ratios which are use in portfolio analysis. There are several models which are used for the
performance evaluation of mutual funds. In the study, five measures were used for the performance
evaluation of mutual funds: Sharpe measure; Jensen differential measure; Treynor measure; Sortino measure
and Information measure. While Treynor measures only the systematic risk summarized by beta, Sharpe
concentrates on total risk of the mutual fund:
3-2-1 Sharpe Ratio
The Sharpe ratio or Sharpe index or Sharpe measure or reward-to-variability ratio is a measure of
the excess return (or Risk Premium) per unit of risk in an investment asset or a trading strategy, named after
William Forsyth Sharpe. Approximately 45 years ago, William Sharpe created a calculation for measuring
the return that investors should expect for the level of volatility they accept. In other words, how much
money they will earn compared with the size of the risk. This measurement is called the Sharpe ratio which
is often used as a risk-adjusted performance measurement. It measures a fund's excess return per unit of its
risk (Sharpe, 1966). It is the simplest ratio of performance evaluation based on risk adjusted measures
(Sharpe, 1964).
The higher the Sharpe Ratio is, the better a fund is expected to perform over a longer period of time. A ratio
of more than 1 is considered quite well because that means the portfolio is producing relatively high returns
with relatively low volatility (Ianthe, 2005). The Sharpe ratio can be expressed as follows:
P
RF
P
R
Sharpe
(2)
where R
P
= average return of portfolio; RF = average risk free and σ
P
= standard deviation of portfolio
returns.
3-2-2 Treynor Ratio
Treynor measure was developed by Jack Treynor. The Treynor measure is similar to the Sharpe ratio
measures risk adjusted performance of fund over per unit of systematic risk. The formula of Treynor
measure is as follows:
p
RF
P
R
TR
(3)
68
95
Abbasi et al., 2012
where R
P
= average return of portfolio; RF = average risk free ratio and β
P
= Systematic Risk of Portfolio.
Treynor ratio measures the excess expected return of a portfolio in proportion to systematic risk (George and
Ferson, 2006). The results of studies have shown that Sharpe and Treynor ratios can present the ability of
managers in the diversification of investment portfolio (Lalith, S. and Tanweer H., 2005).
3-2-3 Jensen differential measure
Jensen’s measure, called Jensen’s alpha, is the difference of the portfolio return from the return predicted by
the CAPM (Capital Asset Pricing Model). Jensen measure was developed by Michael Jensen in 1967. The
Jensen ratio measures the performance of portfolio management based on regression analysis. In fact, this
ratio compares and evaluates differences between the average expected return of a managed portfolio and the
average expected return of a benchmark portfolio (Shahid, 2007). The formula of Jensen measure is in the
following way:
f
R
M
R
Pf
R
P
R
P
Jensen
(4)
where R
P
= average return of portfolio; R
f
= average risk free ratio; R
M
= average market return and β
P
=
Systematic Risk of Portfolio
3-2-4 Sortino Ratio
Sortino measure was introduced by Frank Sortino in 1944. Sortino measure also measures risk adjusted
performance of funds. It is the modified form of Sharpe measure. Down side risk is taken for the calculation
of Sortino measure in order to divide excess returns of portfolio instead of standard deviation, which is the
major difference between Sortino and Sharpe measures. The Sortino measure ensures that risk, more
realistically, is taken into account for the performance evaluation because negative values of the excess
returns are used to calculate downside risk whereas, in Sharpe measure calculation, both down side and
upside risks are used to calculate standard deviation (Nafees et al., 2011). The formula of Sortino measure is
as follows:
DR
f
R
P
R
SOR
(5)
where R
P
= average return of portfolio; R
f
= average risk free ratio; DR= Downside Risk of Portfolio
3-2-5 Information Ratio
In addition to the above mentioned ratios, there is another ratio that it is called Appraisal ratio or Information
ratio. This ratio uses Jensen' alpha and unsystematic risk of a managed portfolio for evaluation (George and
Ferson, 2006). Information measure was introduced by Thomas Goodwin in 1998. Information ratio
measures a portfolio’s average return in excess of benchmark portfolio divided by the standard deviation of
this excess return. Formally, the information ratio (IR) is calculated as:
ER
j
ER
j
ER
b
R
j
R
IR
(6)
where R
j
= average return for portfolio j during the specified time period; R
b
= the average return for the
benchmark portfolio during the period and σ
ER
= standard deviation of the excess return during the period
3-3- Research Hypotheses
In order to evaluate the effects of fund size on the performance of mutual funds, these hypotheses
were tested:
1) All Iranian Mutual Funds:
H0: There is no significant relationship between fund size and performance of Iranian mutual funds (r=0).
H1: There is a significant relationship between fund size and performance of Iranian mutual funds (r≠0).
2) Fixed Income Instruments Mutual Funds:
H0: There is no significant relationship between fund size and performance of Fixed Income Instruments
mutual funds (r=0).
H1: There is a significant relationship between fund size and performance of Fixed Income Instruments
mutual funds (r
≠0).
3) Big Cap Stock Mutual Funds:
H0: There is no significant relationship between fund size and performance of Big Cap Stock mutual funds
(r=0).
H1: There is a significant relationship between fund size and performance of Big Cap Stock mutual funds
(r
≠0).
4) Small Cap Stock Mutual Funds:
68
96
J. Basic. Appl. Sci. Res., 2(7)6889-6902, 2012
H0: There is no significant relationship between fund size and performance of Small Cap Stock mutual funds
(r=0).
H1: There is a significant relationship between fund size and performance of Small Cap Stock mutual funds
(r≠0).
4- RESEARCH METHODOLOGY
4-1- Data Collection Method
This research aimed at examining the relationship between mutual fund size and performance in the
Iranian mutual funds. Therefore, this study included all the Iranian mutual funds during 2007 to 2011(1st
April 2007 to 31st March 2011). In doing so, the main part of data was collected from the respective
websites of mutual funds and the remaining data were gathered from financial statements, websites of
Securities and Exchange Organization of Iran
1
(SEO), relevant auditing statements and other creditable
sources and analysis of stock software’s as Dena Sahm and Pars Portfolio (two Iranian software programs).
4-2- Statistical Analyses and Techniques
Correlation coefficients between fund size and performance were computed to assess the degree of
relationship between fund size and performance of mutual funds. The most commonly used correlation statistic
is the Pearson correlation coefficient, which measures both the strength and direction of the linear relationship
between two variables (Bryman and Bell, 2007, p.362). Analysis of Variance (ANOVA) was conducted to
ascertain whether the variance of performance variables among Fixed Income Instruments and Big and Small
Cap Stock mutual funds was significant at 5% significance level. A significant level of 5% was applied; which
is the most common one in statistical analyses. And, the null hypothesis was rejected if their significant level
became below the 5 % limits; otherwise, it was accepted (Bryman and Bell, 2007, p.370). The SPSS software
and Microsoft Excel were used for calculating various models to get to proper results.
4-3- Hypotheses Testing
In order to check the significance relationship between fund size and performance, Table (2) provides
correlation coefficients between fund size and performance in the study over the period 2007 to 2011.
Table (2): The Correlation result of fund size and performance
Information
Ratio
Sortino Ratio Jensen
differential
measure
Treynor
Ratio
Sharpe ratio Fund Size
1
Pearson Correlation
Sig. (2-tailed)
Fund Size
1 0.421
(0.433)
Pearson Correlation
Sig. (2-tailed)
Sharpe ratio
1 0.125*
(0.
000
)
0.227
(0.
7
41
)
Pearson Correlation
Sig. (2
-
tailed)
Treynor Ratio
1 0.374*
(0.086)
0.475*
(0.006)
0.391
(0.736)
Pearson Correlation
Sig. (2-tailed)
Jensen differential
measure
1
0.145*
(0.016)
0.145
(0.024)
0.624
(0.639)
0.249
(0.184)
Pearson Correlation
Sig. (2-tailed)
Sortino Ratio
1
0.408
(0.785)
0.021*
(0.036)
0.295*
(0.000)
0.318
(0.427)
0.145
(0.352)
Pearson Correlation
Sig. (2-tailed)
Information Ratio
Note: The asterisks * denotes significant at 1 per cent (p<0.01) confidence levels.
The following hypothesis testing was done:
H0: There is no significant relationship between fund size and performance of Iranian mutual funds (r=0).
H1: There is a significant relationship between fund size and performance of Iranian mutual funds (r≠0).
At 95 % level of confidence, the null hypothesis cannot be rejected because the result suggested (p >0.05) no
significance relationship between fund size and performance of Iranian mutual funds. Then, when the
significance of the relationship was tested to accept the error limit, the obtained amount was far from the
minimum limit of 5%; so, the null hypothesis could not be rejected.
4-4- Analysis of Fixed Income Instruments Mutual Funds
Eighteen out of seventy-eight Iranian mutual funds were classified as Fixed Income Instruments mutual
funds
2
. The total fund size (assets) managed by them was 13.816.772 million Rials (in March 31, 2012) and
they constituted 0.76 percent of the total fund size (assets) of all Iranian mutual funds. Table (3) provides
correlation coefficients between fund size and the performance of Fixed Income Instruments mutual funds.
1
. see this websites: ; and
2
. This Classification done by Securities and Exchange Organization (SEO)
68
97
Abbasi et al., 2012
Table (3): The Correlation result of fund size and performance (Fixed Income Instruments mutual funds)
Information
Ratio
Sortino Ratio Jensen
differential
measure
Treynor
Ratio
Sharpe ratio Fund Size
1
Pearson Correlation
Sig. (2-tailed)
Fund Size
1 0.584 -
(0.703)
Pearson Correlation
Sig. (2-tailed)
Sharpe ratio
1 0.748*
(0.097)
0.554 -
(0.165)
Pearson Correlation
Sig. (2-tailed)
Treynor Ratio
1 0.172
(0.086)
0.315
(0.009)
0.148 -
(0.736)
Pearson Correlation
Sig. (2-tailed)
Jensen differential
measure
1
0.249*
(0.146)
0.145 -
(0.024)
0.367
(0.294)
0.065 -
(0.084)
Pearson Correlation
Sig. (2-tailed)
Sortino Ratio
1
0.157*
(0.072)
0. 214*
(0.084)
0.795*
(0.062)
0.185
(0.781)
0.357 -
(0.352)
Pearson Correlation
Sig. (2-tailed)
Information Ratio
Note: The asterisks * denotes significant at 1 per cent (p<0.01) confidence levels.
The following hypothesis testing was done:
H0: There is no significant relationship between fund size and performance of Fixed Income Instruments
mutual funds (r=0).
H1: There is a significant relationship between fund size and performance of Fixed Income Instruments
mutual funds (r
≠0).
The null hypothesis cannot be rejected because the result suggested (p> 0.05) no significance relationship
between fund size and performance of Fixed Income Instruments mutual funds; meaning that the correlation
for these eighteen cases found almost no relationship between fund size and performance. Then, when the
significance of the relationship or the error limit was tested to accept or reject the hypothesis, the value was
far higher than the minimum limit of 5% .Thus; the null hypothesis could not be rejected.
4-5- Analysis of Big Cap (Stock) Mutual Funds
Seven out of seventy-eight Iranian mutual funds were classified as Big Cap (Stock) mutual funds. The
total fund size (assets) managed by them was 742.928 million Rials (in March 31, 2012) and they constituted
0.04 percent of the total fund size (assets) of all Iranian mutual funds. Table (4) provides correlation
coefficients between fund size and the performance of Big Cap (Stock) mutual funds.
Table (4): The Correlation result of fund size and performance (Big Cap Stock mutual funds)
Information
Ratio
Sortino
Ratio
Jensen
differential
measure
Treynor
Ratio
Sharpe ratio Fund Size
1
Pearson
Correlation Sig.
(2-tailed)
Fund Size
1 0.134
(0.295)
Pearson
Correlation Sig.
(2
-
tailed)
Sharpe ratio
1 0.158*
(0.471)
0.487 -
(0.284)
Pearson
Correlation Sig.
(2-tailed)
Treynor Ratio
1 -0.774*
(0.066)
0.524 -
(0.107)
0.214
(0.630)
Pearson
Correlation Sig.
(2-tailed)
Jensen differential
measure
1
0.143*
(0.007)
0.204
(0.128)
0.464
(0.099)
0.574 -
(0.208)
Pearson
Correlation Sig.
(2-tailed)
Sortino Ratio
1
0.528
(0.289)
0.115 -
(0.604)
0.237*
(0.095)
0.039
(0.001)
0.792
(0.687)
Pearson
Correlation Sig.
(2-tailed)
Information Ratio
Note: The asterisks * denotes significant at 1 per cent (p<0.01) confidence levels.
The following hypothesis testing was done:
H0: There is no significant relationship between fund size and performance of Big Cap Stock mutual funds
(r=0).
H1: There is a significant relationship between fund size and performance of Big Cap Stock mutual funds
(r
≠0).
The results from Table (4) indicate that H0 cannot be rejected at 95% level of confidence since the
correlation of the variables was not statistically significant.
68
98
J. Basic. Appl. Sci. Res., 2(7)6889-6902, 2012
4-6- Analysis of Small Cap (Stock) Mutual Funds
Fifty-three out of seventy-eight Iranian mutual funds were classified as Small Cap (Stock) mutual funds.
The total fund size (assets) managed by them was 3.546.077 million Rials (in March 31, 2012) and they
constituted 0.20 percent of the total fund size (assets) of all Iranian mutual funds. Table (5) provides
correlation coefficients between fund size and the performance of Small Cap (Stock) mutual funds.
Table (5): The Correlation result of fund size and performance (Small Cap Stock mutual funds)
Information
Ratio
Sortino
Ratio
Jensen
differential
measure
Treynor
Ratio
Sharpe ratio Fund Size
1
Pearson
Correlation Sig.
(2
-
tailed)
Fund Size
1 0.164
(0.633)
Pearson
Correlation Sig.
(2
-
tailed)
Sharpe ratio
1 0.441
(0.197)
0.159
(0.282)
Pearson
Correlation Sig.
(2-tailed)
Treynor Ratio
1 0.272
(0.000)
0.315
(0.209)
0.248
(0.026)
Pearson
Correlation Sig.
(2-tailed)
Jensen differential
measure
1
0.240*
(0.676)
0.742 -
(0.024)
0.367
(0.294)
0.245
(0.147)
Pearson
Correlation Sig.
(2-tailed)
Sortino Ratio
1
0.456
(0.544)
0.524
(0.004)
0.795*
(0.057)
0.254
(0.604)
0.752 -
(0.622)
Pearson
Correlation Sig.
(2-tailed)
Information Ratio
Note: The asterisks * denotes significant at 1 per cent (p<0.01) confidence levels.
The following hypothesis testing was done:
H0: There is no significant relationship between fund size and performance of Small Cap Stock mutual funds
(r=0).
H1: There is a significant relationship between fund size and performance of Small Cap Stock mutual funds
(r≠0).
According to Table (5), there was no significant relationship between fund size and Sharpe measure, Treynor
measure, Sortino measure and Information measure, and the performance of Small Cap Stock mutual funds.
But, there was a significant relationship between fund size and Jensen differential measure, and the
performance of Small Cap Stock Mutual Funds; i.e., at 5 % significance level, the null hypothesis was
rejected because it was .026. That meant the correlation for these fifty three cases was 0.248, which
indicated a significant relationship between the variables: Fund Size and Jensen differential measure. When
the significance of the relationship for accepting the error was tested, the value which was below the
minimum limit of 5% was found; so, the null hypothesis was rejected.
4-7- Hypotheses Testing for Analyzing Variance of the Three Groups of Funds
The Analysis of Variance (ANOVA) of Sharpe ratio, Treynor Ratio, Jensen differential measure, Sortino
Ratio and Information Ratio of the three categories (Fixed Income Instruments, Big and Small Cap Stock) of
mutual funds is given in Table(6) and reveals the following findings:
Because the F. probability of the ANOVA test was more than.05, it was not statistically significant.
Therefore, it can be seen that the Sharpe ratio, Treynor Ratio, Jensen differential measure, Sortino Ratio and
Information Ratio of Fixed Income Instruments, Big and Small Cap Stock mutual Funds were not
significantly different from each other.
Table (6a): ANOVA of Sharpe ratio of Fixed Income Instruments, Big and Small Cap Stock mutual Funds
Sum of Squares df Mean Square F Sig.
Between Groups .052 2 .624 3.287 .779
Within Groups .268 75 .106
Total .394 77
Table (6b): ANOVA of Treynor ratio of Fixed Income Instruments, Big and Small Cap Stock mutual Funds
Sum of Squares df Mean Square F Sig.
Between Groups .006 2 .017 1.941 .121
Within Groups .108 75 .005
Total .198 77
68
99
Abbasi et al., 2012
Table (6c): ANOVA of Jensen differential measure of Fixed Income Instruments, Big and Small Cap Stock
mutual Funds
Sum of Squares df Mean Square F Sig.
Between Groups .123 5 .732 3.275 .438
Within Groups .286 75 .106
Total .392 77
Table (6d): ANOVA of Sortino ratio of Fixed Income Instruments, Big and Small Cap Stock mutual Funds
Sum of Squares df Mean Square F Sig.
Between Groups
.
012
2
.
0
9
7
2
.
49
1
.
752
Within Groups .083 75 .021
Total
.
1
27
77
Table (6e): ANOVA of Information ratio of Fixed Income Instruments, Big and Small Cap Stock mutual
Funds
Sum of Squares df Mean Square F Sig.
Between Groups
.
089
2
.
1
32
3.
1
0
7
.
145
Within Groups .123 75 .106
Total
.
292
77
5-Conclusion & Discussion
The purpose of this study was to analyze the level of correlation between fund size and performance of
Iranian mutual funds. To meet this purpose, the conclusion is drawn and the research questions are answered
in the following way. What is the relationship between fund size and performance of mutual funds?
Pearson’s correlation coefficient (r) was used to examine the relationship between fund size and performance
and the following results were found.
As far as the relationship between fund size and performance of Fixed Income Instruments mutual funds
were concerned, no significant relationship was found between them. This meant that the results showed the
change in the size of fund did not have any significant contribution to the performance of Iranian mutual
funds. Regarding the correlation between fund size and performance of Big Cap Stock mutual funds, the
result similar to Fixed Income Instruments was found whereas, in the case of the Small Cap Stock Mutual
Funds, a significant correlation was found between Fund Size and Jensen differential measure. In other
words, there was no significant relationship between Fund Size and Sharpe measure, Treynor measure,
Sortino measure and Information measure and the performance of Small Cap Stock mutual funds. But, there
was a significant relationship between Fund Size and Jensen differential measure. The ANOVA of
performance variables of Fixed Income Instruments and Big and Small Cap Stock mutual Funds indicated
that these variables were not significantly different from each other. Finally, there was no statistically
conclusive and significant evidence to suggest that the fund size affected the performance of mutual funds in
the Iran context. This result was in line with the research findings by Grinblatt and Titman (1994), Otten and
Bams (2002), Lu (2007) and Elton et al. (2007).
The time period of this study was five years which may not truly represent the performance of funds. The
performance of newly started funds may be over or under estimated due to short time span. Most of the
mutual funds in Iran do not have a long history, so there were scarce available data. And in certain cases,
these data were not given, which was a barrier. There has not been much work done on mutual fund industry
of Iran so no tangible research material and findings are present to help in literature survey with reference to
Iran. In other words, in this study, there were some research limitations; if solved, they could give a more
accurate picture of mutual fund industry of Iran. These limitations can be summarized as follows:
1. Changes in macroeconomic conditions, political and social changes over the studied years were not
considered.
2. Due to limited statistical community of Iranian mutual funds, distributions of results to other economic
units should be done with caution.
5-1-Further Research
A further study may be carried out which can include more factors on the relationship between mutual
fund size and performance and expand its scope to other mechanisms in Iran in order to gain better
understanding and generalize the findings. However, the greatest drawback of this study was that it was
based on Fixed Income Instruments, Big and Small Cap Stock mutual funds and thereby prohibited the
results to be generalized. Hence, further studies could include more funds in order to generalize the result of
6
900
J. Basic. Appl. Sci. Res., 2(7)6889-6902, 2012
the study. Another suggestion would be to utilize Index funds in order to see if diversification influences the
overall fund performance. Furthermore, further studies could examine the fund performance by emphasizing
other measurements that entail different properties.
6- REFERENCES
Bird, R., Chin, H., & McCrae, M. (1983). The Performance of Australian Superannuation Funds Vol. 8, No.
1. Australian Journal of Management , 49-69.
Bryman, A., & Bell, E. (2007). Business research methods. 2nd edition. New York: Oxford University Press
Inc.
Chan, H. W. H., Faff, R., Gallagher, D. R., & Looi, A. (2005). Fund Size, Fund Flow, Transaction Costs and
Performance: Size Matters! Working paper. The University of new South Wales, Sydney.
Chen, J., Hong, H., Huang, M., Kubik, J. (2004). Does Fund Size Erode Mutual Fund Performance? The
Role of Liquidity and Organization. The American Economic Review. 94(5), 1276-1302
Christopherson, J., Ding, Z. & Greenwood, P. (2002). The Perils of Success. Journal of Portfolio
Management, 28, 41-45.
Dahlquist, M., Engström, S. and Söderlind, P. (2000). Performance and Characteristics of Swedish Mutual
Funds. Journal of Financial and Quantitative Analysis, Vol. 35(3), pp. 409-423.
Dellva, W. L., & Olson, G. T. (1998). The relationship between mutual fund fees and expenses and their
effects on performance. Financial Review, 33(1), 85-104.
Dermine, J., & Roller, L. H. (1992). Economies of scale and scope in French mutual funds. Journal of
Financial Intermediation, 2(1), 83-93.
Elton, E. J., Gruber, M. J., Brown, S. J. and Goetzmann, W. N. (2007). Modern Portfolio Theory and
Investment Analysis (7th Ed.). John Wiley & Sons: New York.
European Fund and Asset Management Association (2008). The European Fund Classification. June 2008.
[Brochure]. EU: EFAMA
Ferreira, M., Miguel, A., & Romas, S. (2006). The Determinants of Mutual Fund Performance: A Cross-
Country Study. Spectrum, Vol 28, pp 47-68.
Ferruz, L., Munoz, F., and Vargas, M., 2009, “Does the size of a fund family matter when choosing an
investment strategy? Evidence from Spain “, Review of Quantitative Finance and Accounting,
Published online – 4th February, 2009
George A. and E. Ferson, Wayne, 2006. Portfolio Performance Evaluation, Foundations and Trends in
Finance, 2(2): 83-190.
Gohar, R., Ahmed, S., & Niazi, U. (2011). Performance comparison of mutual funds in Pakistan. African
Journal of Business Management Vol. 5(14) , 5583-5593.
Gorman, L, (1991), A Study of the Relationship between Mutual Fund Return and Asset Size, 1974-1987,
Akron Business and Economic Review, Vol. 22, No. 4, 53-61
Grinblatt, M., & Titman, S. (1989). Mutual Fund Performance: An Analysis of Quarterly Portfolio Holdings.
The Journal of Business, Vol. 62, No3. , 393-416.
Hernandez, PR, Angulo, BF, Tun, D. (2006). Company size distribution for developing countries.Physical.,
359:607–618
Hishamuddin, M, A (2006). Size Effect on the Performance of Listed Real Estate Companies, International
Real Estate Research Symposium (IRERS) 2006 11 – 13
th
April 2006, PWTC, Kuala Lumpur,
Malaysia.
Howells, P., & Bain, K. (2005). The economics of money, banking and finance: a European text. 3rd ed.
Harlow: Pearson Education.
Ianthe, J. D. (2005). Sharpe Point: Risk Gauge Is Misused. New York. Wall Street Journal.
Indro, D., Jiang, C., Hu, M. & Lee, W. (1999). Mutual Fund Performance: Does Fund Size Matter? Financial
Analysts Journal, 55, 74-87
6
901
Abbasi et al., 2012
Keswani, s. (2011). Effect of Fund Size on the Performance of Balanced Mutual Funds an Empirical Study
in Indian Context. International Journal of Multidisciplinary Research Vol.1 Issue 4.
Kolosov, P., & Soltanmammedov, S. (2011). Board Structure in Swedish Mutual Funds Industry. Master
thesis Umeå School of Business, 21.
Lalith, S. and Tanweer H., (2005).Portfolio Performance Evaluation, Springer, pp: 617-622.
Lin, C Y., Hsu, Y C., & Kao, M C. (2011). An application of logistic regression to find outstanding fund
managers. African Journal of Business Management Vol.5 (8), pp. 3076-3081.
Lindeen, E., & Gros, J. (2009). Does Size Affect Performance? Study of Size-Driven Effects on
Performance in Swedish Equity Mutual Funds. Master Thesis in Finance Stockholm School of
Economics.
Lu D (2007). An Empirical Study of Mutual Fund Performance and its Relation with Fund Size, Master
Thesis on MBA Finance and Investment, University of Nottingham.
Manuel, A., & Moerth, P. (2005). Impact of Fund Size on Hedge Fund Performance. Journal of Asset
Management 6.3, 219‐238.
Nafees, B., Amir Shah, S. M., & Khan, S. (2011). Performance evaluation of open end and close end mutual
funds in Pakistan. African Journal of Business Management, pp. 11425-11434.
Otten, R., & Bams, D. (2002). European Mutual Fund Performance. European Financial Management, Vol.
8, No. 1 , 75-101.
Pireh, M. (2011). Mutual funds in Iran: A positive outcome. Islamic Finance News Reports, 14.
Rahdari, M, (2009). Evaluation of Long Term Portfolio's' Performance, Bimaquest - Vol. IX (I): 41-69.
Rouwenhorst, K. (2004). The origins of mutual funds. Yale School of Management Working Papers.
Shahid, M., 2007. Measuring portfolio performance U.U.D.M., Department of Mathematics Uppsala
University, Project Report.
Sharpe, W., (1966), Mutual Fund Performance. Journal of Business. Vol. 39.
Sharpe, W.F, (1964). Capital asset prices: A theory of market equilibrium under conditions of risk.J. Finance
19: 425-442.
Tehrani, R., Ahmadinia, H., & Hasbaei, A. (2011). Analyzing performance of investment companies listed
the Tehran stock exchange by selected ratios and measures. African Journal of Business Management
Vol. 5(17) , pp. 7428-7439
6
902