Báo cáo khoa học: The optimization of protein secondary structure determination with infrared and circular dichroism spectra docx
Bạn đang xem bản rút gọn của tài liệu. Xem và tải ngay bản đầy đủ của tài liệu tại đây (811.42 KB, 12 trang )
The optimization of protein secondary structure determination
with infrared and circular dichroism spectra
Keith A. Oberg, Jean-Marie Ruysschaert and Erik Goormaghtigh
Center for Structural Biology and Bioinformatics, Laboratory for the Structure and Function of Biological Membranes,
Free University of Brussels (ULB), Belgium
We have used the circular dichroism and infrared spectra of
a specially designed 50 protein database [Oberg, K.A.,
Ruysschaert, J.M. & Goormaghtigh, E. (2003) Protein Sci.
12, 2015–2031] in order to optimize the accuracy of
spectroscopic protein secondary structure determination
using multivariate statistical analysis methods. The results
demonstrate t hat w hen the proteins are c arefully selected for
the diversity in their structure, no smaller subse t of the
database contains th e necessary information to describe the
entire set. One conclusion of the paper is therefore that large
protein databases, observing stringent selection criteria, are
necessary for the prediction of unknown proteins. A second
important conclusion is that only the comparison of analyses
run on circular dichroism and i nfrared spectra indep endently
is able to identify failed solutions in the absence of known
structure. Interestingly, it was also found in the c ourse of this
study that the amide II band has h igh information content
and could be used alone for secondary structure p rediction
in place of a mide I.
Keywords: circular dichroism; FTIR; PLS; protein secon-
dary structure.
Multivariate statistical analysis methods have proved to be
powerful t ools f or the analysis of component concentrations
in chemical mixtu res. Because o f their effectiveness i n
systems where there are strongly overlapping bands, t hese
chemometric m ethods have also proved effective in the
analysis o f protein spectra [1–12]. In contrast to most typical
applications of statistical a nalysis methods, the r eported
accuracy in protein s tudies, especially those that t reat
infrared (IR) spectra, varies widely. It is often assumed that
differences result primarily from the analytical m ethods
applied, and so new analytical methods have appeared
continuously over the l ast two decades ( see references
above, and [5,6,13–18]). In addition to the reported margins
of error, there are a number of discrepancies to be found in
IR studies, including the optimal data regions [8,19,20] a nd
spectral p reprocessing methods [20]. It h as not been resolved
whether these differences arise primarily from the analysis
methods or t he protein b asis sets that have been used.
Thus there is a need for a systematic evaluation of the steps
involved in protein secondary structure analysis where
the d ependence of the results on the protein basis set is
minimized.
The key to the effectiveness of s tatistical methods is
concentration-dependent changes in s pectra that are directly
related t o the concentrations of the chemical species being
determined. In simple chemical quantification systems, this
is typically an increase in signal intensity at certain positions
in a spectrum t hat depends linearly on the analyte concen-
tration. In some cases, interactions between the components
of a m ixture may result in additional bands o r changes in
the s ignal. In these c ases the concentration dependence
becomes more complex. However, statistical analysis algo-
rithms can usually model t he se complexities with linear
systems, and thus provide accurate analysis results.
The situation encountered in the analysis of protein
spectra is less straightforward. This comes from a certain
amount of independence i n the variation of protein spectra
on the structure content. Such behavior arises in part from
the way secondary structure is assigned from crystal
structures. Assignment algorithms necessarily involve the
simplification of c rystal structure d ata in the form of
combining residues with somewhat different conformations
into a single structure assignment.
There are se veral possible w ays to handle structure
content-independent variations in protein spectra. The
primary example of such an analysis is that given in [21]
in which protein amide I bands were analyzed by fitting with
a s eries o f Gaussian curves. T he suc cess reported in the
original paper was spectacular: the rms errors for a-helix
Correspondence to E. Goormaghtigh, Structural Biology and Bioin-
formatics Center, Structure and Function of Biological Membranes
Laboratory, CP 206/2, Free University of Brussels (ULB), Bld du
triomphe, Acce
`
s 2 B-1050 Brussels, Belgium. Fax: + 32 2650 53 82,
Tel.: + 32 2650 53 86, E-mail:
Abbreviations: FC, fractional composition (percentage) of a secondary
structure type in a protein; FTIR, Fourier transform infrared
spectroscopy; PCA-MR, principal component analysis with multiple-
regression algorithm; PLS, partial least-squares algorithm; PLS-1,
weighted partial least-squares algorithm; R , correlation coefficient for
a regression; RaSP, rationally selected proteins; RMSE, root-mean
squared error r
cs
, rms deviation of FC values from a set o f crystal
structures; H, a-helix; E, b-sheet; T, turn; G, 3
10
helix; I, p-helix;
S, bend; B, an isolate residue with extended u/ angles; C, residues
that have no secondary structure assignment (irregular structure).
(Received 1 6 March 2004, revised 10 May 2004,
accepted 19 May 2004)
Eur. J. Biochem. 271, 2937–2948 (2004) Ó FEBS 2004 doi:10.1111/j.1432-1033.2004.04220.x
and b-sheet were in the order of ± 2 .5%. The curve-fitting
method compensates for band position variation by
assigning all component bands found in given regions of
the spectrum to a particular structure. This method can be
highly effective when applied by one experienced in its use;
however, curve-fitting requires a series of subjective deci-
sions that can dramatically affect both t he results and the
interpretation [22–25]. F urthermore, curve-fitting ha s a
tendency to overestimate the b-sheet content of primarily
helical proteins, and routinely finds 15–20% b-sheet for
proteins that actually have none [21,26–30].
Statistical analyses are generally accepted a s being the
best way to analyze protein CD spectra, but curve-fitting is
still widely used for determining protein structure from
infrared spectra. From reviewing the literature and consid-
ering just the results f or a-helix determinations with IR data,
it can b e seen that the reported a ccuracy (rms determination
error) ranges from 3.9 to 10.3%, but the 3.9% value was
obtained from a 17 protein s et, and two sets with nine a nd
21 proteins obtained rms errors of around 10%. The
different algorithms used in these studies may indeed be
responsible for the differences, but as statistical analyses
depend both on the algorithm and reference spectra used,
the source of the discrepancies cannot be unambiguously
identified. It remains possible that these differences reflect
the i nternal consistency of the spectra in each respective
basis set rather than the expected general accuracy of the
methods. In a recent paper, Sreerama & Woody [6]
investigated the effect of the number of reference proteins
(29–48) on the a ccuracy of the prediction obtained by three
publicly available CD analysis software programs.
In this paper we propose to extend this analysis to IR
and combined CD/IR spectra. We took great care to use
a p rotein database that presents the largest possible
structure variety. We constructed a protein database that
covers, as far as possible, the a/b space, the fold space as
described b y CATH (class, architecture, topology and
homology classification of proteins [31]) as well as other
structural features such as helix length, and the number of
chains in a sheet. We identified 50 commercially available
proteins that can b e obtained with s ufficient purity and for
which we assessed the quality of the crystal-derived
structure. We call this set of 50 rationally selected
reference proteins RaSP50 and details of this database
have been published recently [32].
We report in this study the application of the RaSP50
set to spectroscopic protein structure determination. We
have attempted here to establish an optimal approach to
using existing methods. This was achieved by focusing on
the input for statistical analysis algorithms, s uch as data
types, spectral preprocessing, and secondary stru cture
assignments. Because IR and CD are the most widely
used spectroscopic tools for the determination of protein
secondary structure, both were applied in this study. They
were tested alone and in combination in an effort to
evaluate their respective strengths, weaknesses and com-
plementarities.
It was found that the quality of the reference protein
database rather than the algorithms used determines the
efficiency of the secondary structure prediction. Clear
complementarities between IR and CD spectra allow a
further enhancement of the secondary structure accuracy.
Experimental procedures
Input data for analysis
The s et of reference proteins used for th is study is an
ÔoptimalÕ basis set, and has been described e lsewhere [32]. It
represents a wide range of helix and sheet FC values as well
as 60 different protein domain folds. The fin al set of 50
proteins fully spans several different Ôconformational
spacesÕ, and has distributions of structures that reflect the
natural abundances found in the PDB. The spectra of the
50 proteins are available on request from the authors.
Protein secondary structure tabulation from
DSSP
output
The secondary structures of the RaSP proteins were
determined with the
DSSP
program [33]. There are eight
assignments made by
DSSP
. Six are familiar to protein
chemists: a-helix (denoted by H), 3
10
-helix (G), p-helix (I),
b-sheet (E), turn (T), and unassigned structure (indicated b y
a blank space in the
DSSP
program output, but which we
denote with C). Unassigned structure has been referred to
by many names, such as irregular, other, disordered or coil.
The fractional composition of their secondary structures
(FCs) were tabulated from the
DSSP
output. The a-helix
assignment can be tabulated as a simple count of the
residues assigned H by the
DSSP
program, or it can be
divided into ÔorderedÕ (denoted by O) and ÔdisorderedÕ (do)
helix by giving the disordered helix assignment to the two
residues at each helix end (ends) [10] or to helical residues
with less than one or two hydrogen bonds within the helix
(denoted by < 1 or < 2), and giving all other a-helical
residues the ordered assignment. W e also separated parallel
and antiparallel b-sheet.
Spectroscopic data collection and processing
All protein preparations were desalted by dialysis or size-
exclusion chromatography. CD spectra were collected on a
JASCO J-710 CD spectrometer using filtered protein solu-
tions in 2 m
M
Hepes pH 7.2 with an absorbance of % 0.5–
0.8 at 192 nm (% 0.1 mgÆmL
À1
) in a 0.1 cm cell. Each CD
spectrum was the accumulation of eight scans at 50 nmÆ
min
À1
with a 1 nm slit width and a time c onstant of 0.5 s for
a nominal resolution of 1.7 nm. Data was collected from
185 to 260 nm. CD spectra were background corrected and
scaled to mean residue ellipticity based on the absorbance at
205 n m. The extinction c oefficient u sed was e
205
¼ 5167 per
peptide bond; this was determined using a combination of
data from Scopes [34] and Hennessey and Johnson [35].
Infrared measurements were made on a dry-air purged
Bruker IFS-55 FTIR spectrometer with an MCT detector.
Data were collected at 2 cm
À1
resolution; 512 scans were
accumulated for each spectrum. Transmission IR spectra
were collected from % 3% (w/v) solutions sandwiched
between CaF
2
windows with a 5 lm Teflon spacer in a
demountable cell. The protein signal was extracted from IR
spectra by subtracting a buffer spectrum with a scaling
factor determined by the method of Powell et al. [36]. The
contribution of water vapor from infrared spectra was
subtracted using a s caling factor determined from t he
integrated absorbance of the 1717 or 1772 cm
À1
bands.
2938 K. A. Oberg et al.(Eur. J. Biochem. 271) Ó FEBS 2004
Preprocessing of spectra for analysis
When indicated, the contributions from amino acid s ide
chains were subtracted for some analyses using data from
Venyaminov [37]. For these subtractions, a synthetic side
chain spectrum was generated using the amino acid
composition of the protein listed in the SWISS-PROT
database [38,39]. The side chain spectrum was then
subtracted from the protein spectrum u sing a scaling factor
determined by Fourier self-deconvolving the spectra, deter-
mining the tyrosine band a rea ratios at 1518 cm
À1
,andthen
using this as the scaling factor for subtracting the original
spectra [40]. Due to low tyrosine s ignal, the proteins BTE,
FTN, MTH, PAB, SOD and T RO could not be processed
in this manner, so the relative extinction coefficients were
used to estimate the subtraction scaling factor [40].
Spectral scaling, baseline corrections and normalizations
were carried out by custom routines added t o the
PLSPLUS
analysis software (discussed below). In the following
discussion, intensity or point normalization refers to the
scaling o f spectral regions to a constant maximum intensity
of 1, area normalization refers to adjusting the intensity so
that all spectra had the same integrated area in a chosen
region (0.1 absorbance unitsÆcm
À1
). Before normalization,
IR spectral regions were either baseline-corrected to bring
both endpoints to zero, or if baseline-correction was not
used, the first value in the band was subtracted from all
other data points in order to bring the minimum to zero.
Combination of CD and IR spectra
To analyze combined C D and IR data, h ybrid spectra were
made by placing CD and IR data in a single array. In these
spectra, one unit on the x axis corresponds to one of the
native units for each data type (nm for CD and cm
À1
for
IR), and the data point spacing is 1 per x unit. It w as
necessary to scale the CD spectra to be consistent with the
intensities of t he IR spe ctra (each spectrum was multiplied
by 0.0015), but the exact type of unit in each region is less
important than the fact that both d ata types were of similar
intensity in the hybrid spectrum. This ensured that they had
similar contributions in the m odel buildin g process. The
limits of the data regions used were 1720–1600 cm
À1
for the
IR amide I band, 1590–1500 cm
À1
for the amide II band,
and 185–260 nm for far-UV CD data.
Analysis methods
The bulk of the analyses performed in this report w ere m ade
with
PLSPLUS
version 2.1 (Galactic Industries, Salem, NH).
PLSPLUS
is integrated into
GRAMS
(Galactic Industries
Corporation, Woburn, MA, USA), which uses the Array
Basic
TM
programming language. It was therefore possible
to create all other necessary software in a s ingle environment
withacommondataformat.
Although the PLS-1 algorithm used here extracts facto rs
in order of t heir relevance to the structure being quantified,
the problem o f selecting the total number of factors to use
for each structure type remains. It was found that the first
two-to-five fa ctors for a-helix or b-sheet typically accounted
for 95% o f the variation in the R aSP50 s pectra. For turn
and other structu res, up to 10 f actors were required to reach
the 95% level, but the fi rst six usually accounted for 90%
or more of the total variation. The factors themselves
typically began to s how significant contributions from noise
at the 6th or 7th factor. For automatic selection of the
optimal number of factors for each model, the maximum
was set at 10. However, if there was a smaller set of factors
that provided similar accuracy (< 1.05 times the minimum
rms), the algorithm would select this as the optimum. For
each analysis, cross validation was performed and the rms
deviation b etween the experimental and calculated set was
determined for all possible numbers of factors.
Unless otherwise indicated, all analysis results reported
here are from c ross validations of the full RaSP50 s et. Cross
validation is performed by removing each spectrum, in turn,
from the reference set. The remaining spectra (49 in this case)
are then used to ge nerate a statistical model, w hich is used to
determine t he structure of the eliminated protein. Finally the
calculated FC for each p rotein is compared with its actual
structure, and the determination error is evaluated and
stored. After the c ross validation i s complete, the r ms error o f
all a nalyses a re determined with Ôn À 1Õ degrees of freedom
in PLS-1, and Ôn À (s À 1)Õ degrees of freedom for simulta-
neous methods, where n is the number of s pectra and s is the
number of structures b eing determined simultaneously.
Results and Discussion
Methods for evaluating analysis performance
Cross validation, as explained i n the M aterials and methods,
treats each protein a s a n unknown and evaluates its
structure using the remaining proteins as a training set.
For t he RaSP50 proteins, great care was taken to eliminate
protein p reparations with impurities and to use only high-
quality s pectra. Because of this i t can be assumed t hat a high
cross validation error for any o f the RaSP50 proteins ar ises
not from a problem with the sample, but from an
inconsistency between its secondary structure assignment
and the actual variations of structure that give rise to the
protein spectrum.
Because every sample in the basis set is analyzed as an
unknown during cross validation, this procedure provides
data that can be used t o estimate the expected accurac y
for analyses of true unknowns by calculating the cross
validation errors (determined FC – actual FC) for all basis
samples and then taking the r msd o f t hese errors is
obtained. The rms is potentially a good estimate of the
overall performance of an analysis method because it is a
summary of many unknown analyses (50 in this case). The
rms represents the error bounds for % 2/3 of the training
samples in cross validation. Thus, it can be expected that
there is a 67% chance that FC determination results for
an unknown protein will be within ± rms of the ÔtrueÕ
value.
The rms, if presented alo ne, is also uninformative.
Assume that a hypo thetical cross validation of the
RaSP50 basis set was performed and an rms for FC
T
of
± 5.0% T was reported. It would be natural to conclude
that the turn determination accuracy for this method was
quite good, but this is not the case. If we look at the
crystal structures of the RaSP50 proteins and examine the
distribution of t heir actual FC
TS
, we find a mean of
Ó FEBS 2004 FTIR-CD spectroscopy of proteins (Eur. J. Biochem. 271) 2939
12.5% T and a standard deviation (r
CS
)of4.3%T.An
inelegant way of estimating the turn content for an
unknown could be just to guess that its FC
T
was 12.5%
(the mean for the RaSP50 set). In fact, this value would
probably be a more accurate estimate (± 4.3% T) than
that provided by the hypothetical statistical analysis
(± 5.0% T). This problem has been recognized previously
[41]. To evaluate the information content present in the
spectra, the rms f or each analysis will be reported together
a Ôdetermination enhancemen tÕ score, f, which we define
as r
CS
divided by rms. These scores compare the relative
widths of the distributions for the protein crystal structure
FCs (r
CS
) and the cross validation errors. They can also
be used to compare the analysis accuracy for different
structures because they are corrected for the actual
distribution of each structure type in the RaSP50 protein
set. A f score o f one indicates that these distributions have
the same width, i.e. t hat t he analysis of the spectrum is
just as accurate as guess for the average value.
Preprocessing of protein spectra for statistical analysis
CD spectra of proteins were scaled based on the protein
(amino acid residue) concentration of the sample used to
collect a spectrum a s e xplained in the E xperimental
procedures. For IR spectra the possible p rocessing steps
include normalization, baseline correction, the subtraction
of side chain contributions and artificial band narrowing
(using Fourier self-deconvolution or differentiation). There
is consensus in t he literature that b and narrowing does not
improve statistical analysis results [20] therefore such
procedures were not re-evaluated here. The subtraction of
side-chain spectra before analysis has b een used in only one
study [10]. Normalization of I R spectra is required before
analysis. Typical normalization methods that have been
used for IR spectra include scaling to t he same maximum
intensity [19,20] or area [8,19,20]. In essence, these norm-
alizations are intended to increase the correlation of IR
band shape with protein secondary structure, and thus
improve analysis accuracy.
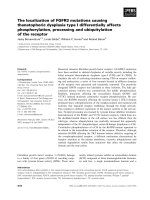
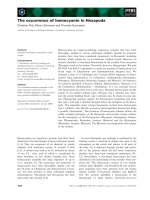
The effect of spectral normalization on analysis results. For
the infrared spectra (Fig. 1), various normalization proce-
dures were followed: normalization o f the band maximum
to a constant intensity; normalization to a constant area;
normalization of the combined amide I and II bands, with
separate analyses of each band afterwards; and separate
normalization of the amide I and II bands. All these
normalizations were tested with and without baseline
correction. For the CD spectra (Fig. 1), the mean residue
ellipticity was used. The errors of cross validation (rms) of
each spectroscopic Ôdata regionÕ used in this study (IR amide
I, IR amide II, and CD) were obtained (not shown). It was
immediately apparent that most of the normalizations do
not radically change the analysis accuracy. Subtracting a
baseline and normalizing separately on amide I and II was
close to the best solution for every structure.
Side chain signal subtraction. IR and CD protein spectra
can contain significant contributions from amino acid side
chain bands. In CD spectra, these contributions arise from
aromatic groups or disulfides and are dictated by the local
environment of each side chain [42,43]. It is therefore
impossible to determine the exact nature of their contribu-
tion to a given protein spectrum a priori. For IR spectra,
side chain contributions are consistent enough for the
generation of synthetic spectra based on data from m odel
compound stu dies [ 23,37,44,45]. There is much debate over
the usefulness of subtracting side chain spectra, as t hey are
typically broad, relatively featureless a nd may b e affected t o
a small extent by the local environment of each residue. In
fact, simple baseline correction often has an effect similar to
subtraction [23]. Our data (not shown) indicate that side
chain subtractions only moderately improved the rms values
for some, but not all, secondary structures. It was not used
further in this study.
The sensitivity of different spectroscopic methods
to protein secondary structure
The relative sensitivities of different spectroscopic meth-
ods to protein secondary structure. It is usually accepted
that CD measurements provide more accurate estimations
of protein a-helix content whereas IR is thought to be more
sensitive to b-sheets. The data in Table 1 support this, and
provide some quantitative information about the extent to
which it is true. In comparing the optimal rms values for
the IR amide I and CD data types it was found that
determinations of the a-helix content are (relatively) 18%
better for CD than IR, and IR i s (relatively) 30% more
accurate than CD in b-sheet determination. There is also a
difference in sensitivity to the other structural classifications
listed in the table. CD determination of the C + B + G
+ S assignment proved to be about (relatively) 10% more
accurate than IR, but the I R rms for FC
T
analysis is lowe r
than the rms for CD.
Also noteworthy are the results from the amide II band
normalization r esults. It has long been recognized that the
amide II b and is conformationally sensitive. However, the
dependence of amide II band shape o n s econdary structure
is complex, so it has not been considered systematically for
qualitative analyses. The results in Table 1 indicate that the
PLS-1 a lgorithm was able to extract information from the
isolated amide II band. In fact, amide II cross validation
results for a-helix an d turn were more accurate than analysis
using o nly the amide I region. This finding suggests, for the
first time, that the amide II band could be used alone fo r
protein FC
H
determination.
Combining data regions for analysis. While the spectro-
scopic signals in the amide I and II regions arise from
m(C ¼ O), d(N À H) and m(C À N), the CD data arise from
electronic transitions. It is t herefore probable that they
contain different independent structural information.
Consequently, if they are combined into a single hybrid
spectrum (Fig. 1), an analysis a lgorithm should be able to
extract complementary information from each region and
thus provide more accurate results. Such a combination has
been tested before [8,19,20], including for vibrational and
electronic CD spectra [41] or vibrational CD and IR [1] but
the conclusions reached i n these studies are contradictory.
This is presumably because different basis sets a nd/or
different m athematical methods were used. To resolve
this conflict, cross validations with different data region
2940 K. A. Oberg et al.(Eur. J. Biochem. 271) Ó FEBS 2004
combinations were performed with the RaSP50 protein
spectra. The results presented in Table 1 are given with the
optimal normalization strategy for each structure type. It
was found that for the IR data, combining the amide I
and II bands substantially improved determinations of
the a-helix and C + B + G + S structure assignments.
Combined IR and CD data was more accurate than either
of these methods alone. The relative improvements in
determination accuracy using all three data regions com-
pared to IR amide I band alone (Table 1) are 48% for
a-he lix, 5% for b-sheet (39% compared to CD alone), 12%
for turn and 9% for the sum of the remaining assignment.
Fig. 1. Concatenated CD (186–260 nm) a nd IR (1720–1500 cm
À1
) spe ctra o f the 50 pro teins described in the Exp erimental procedures. Spectra have
been rescaled and offset along the y-axis for a better readability. Proteins are sorted according to th eir a-helix content.
Ó FEBS 2004 FTIR-CD spectroscopy of proteins (Eur. J. Biochem. 271) 2941
The correspondence between secondary structure
definitions and spectral features
Now that optimum spectral processing m ethods have been
established, the other major input for statistical analysis,
structure assignments, can be explored. Bond angles ,
H-bonds, tertiary structure, resonance, exciton coupling
and side chain signals are all factors that contribute to
protein spectral band shapes. Reducing this natural com-
plexity to a small s et of secondary structure assignments
involves a simplification that obviously cannot accurately
describe all aspects of IR or CD spectra.
The
DSSP
program [33] is currently the most widely
used method for assigning secondary structure types to
individual r esidues.
DSSP
makes e ight structure assign-
ments, each identified b y a single letter code, including
three t ypes of helix (a-helix, H ; 3
10
-helix, G ; p-helix, I),
b-shee t (E) , t urns ( T), a nd wha t we will re fer t o a s
irregular structures (C). While the first four structures are
periodic, the
DSSP
program assigns two aperiodic struc-
tures in addition to T and C; these are typically found
within stretches of C. They are isolated–extended (B), a
residue with u/ angles in the b-sheet range that does not
participate in a b-sheet, and bend (S), a sharp turn in the
protein chain that does not meet all the criteria for a
T assignment. From the descriptions of these a ssign-
ments, the question naturally arises: where would the
signals from these structures be expected to appear? For
example, should t he B s tructure give rise to a band
characteristic of b-sheet, irregular structure, or will it have
a unique signal? Similar questions apply t o o ther
assignments as well. Optimal determination accuracy
can only be a chieve d b y placing such residues i n an
appropriate assignment group. A few structure assign-
ment combinations have appeared in the literature [9,35].
To tackle these questions in a systematic manner, the
performance of P LS-1 analysis for various
DSSP
assign-
ment combinations and subclassifications was evaluated.
Note that, due to their natural abundances, the FC
variation (r
CS
) of some structure types (G, S, B and I) in the
RaSP50 set is s mall. Accordingly, statistical a nalysis cannot
be accurate for t hese structures unless t heir FC/signal
correlation is strong. Most proteins in the RaSP50 set h ave
12–13% turn, and the 3
10
-helix content is below 10% for all
proteins except lysozyme and a-lactalbumin, with the
majority having 3–6%. The p-helix (I) was essentially
nonexistent in the RaSP50 proteins, and was therefore not
considered a quantifiable structure.
Individual secondary structure assignments and their
combinations. First, let us consider the performance of
the individual assignments made by
DSSP
.Thef scores
given in Table 2 indicate how much information the
analysis algorithm c ould extract from the r eference
spectra. This analysis was performed for all the structure
types, alone or combined. A sum mary o f t he results
appears i n Table 2. The results sugg est that t he
DSSP
program overclassifies some secondary structures, at least
as far as IR and CD spectra are concerned. That is, there
are several structure types, which apparently do not give
rise to unique, detectable spectral characteristics (for
example, f % 1 for the G and B assignments). Note
however, t hat the F C distributions (r
cs
)forthese
structures are also narrow in the RaSP50 set. The only
individual secondary structure assignments made by
DSSP
that are determined by the PLS algorithm with f ‡ % 2
are a-helix (H) and b-sheet (E), none of the f scores for
other individual assigned structures are h igher than 1 .25
(not shown).
Residues with different secondary structu re assignments
can also be combined into a single assignment class. Such
grouping has a possible advantage in secondary structure
determination. Grouping residues with different assign-
ments t hat may have similar spectroscopic signals may also
increase the sensitivity of analysis. The results show that
some f scores could be improved by combining structu res,
such as C + S + B (compared to each of these structures
alone), but none of the combinations tested had f scores
comparable to f
H
or f
E
. In addition, combining other
structures with a-helix (H + G or H + C) or b-sheet
(E + B) did not improve the f scores compared to H and E
determinations alone. The structu re combination that was
found to have the strongest FC/signal correspondence is
C + T + G + S + B. It can be hypothesized that
grouping all the structures but the a-helix and b-sheet must
yield a prediction correlated with the a-helix and b-sheet
prediction, as the value for C + T + G + S + B is simply
100 À (H À E).
Table 1. Optimal rms values and preprocessing techniques f or IR and CD spectroscopic data-region combinations. These rms values are from the
optimal normalization for each secondary structure type.
Data
a-Helix (H) b-Sheet (E) Turn (T)
Others
(C+B+G+S)
RMS f
a
RMS f RMS f RMS f
IR Amide I 8.97 2.46 6.91 2.60 4.14 1.05 9.66 1.25
IR Amide II 7.53 2.93 10.83 1.66 3.91 1.11 10.43 1.15
CD 7.61 2.90 9.12 1.97 4.46 0.97 8.95 1.34
Amide I + II 6.67 3.31 7.09 2.53 3.88 1.12 9.09 1.32
Amide I + CD 6.30 3.51 6.58 2.73 4.05 1.07 8.84 1.36
Amide II + CD 6.97 3.17 8.72 2.06 3.72 1.17 9.06 1.33
Amide I + II + CD 6.06 3.65 6.58 2.73 3.71 1.17 8.85 1.36
a
The information content score (f ¼ r
CS
/rms) described in the text.
2942 K. A. Oberg et al.(Eur. J. Biochem. 271) Ó FEBS 2004
Subclassification of helix and sheet assignments. Several
authors h ave attempted to improve the accuracy of
structure determination by dividing helix into ordered,
H(O), or disordered, H(do), subclassifications or by dis-
criminating between antiparallel, E(AP), and parallel,
E(par), b-sheet [6,8,19]. This is motivated by the idea that
the differences between the geometries, H-bonding, etc. of
these structures should be sufficient to produce differing
band shapes that could be modeled by statistical analysis
algorithms. Typically, this practice results in lower rms
values for the segregated structures (Table 2). A reduction
of rms values for segregated structures was also observed in
this study, but subdividing a-helix and b-sheet classifications
also reduces the corresponding r
CS
values. The consequence
is usually lower f scores for both s ubstructures. Therefore
segregation actually degrades analysis performance in
general. The o nly e xceptions were found to be the
removal of kinks from a-h elices, H(O, < 1), which
increased the determination accuracy for one of the
subassignments (f
H,IR
¼ 3.29 fi f
H(O <1),IR
¼ 3.49,
f
H,CD
¼ 2.90 fi zgr;
H(O <1),CD
2.98), and b-sheet segre-
gation which improved the accuracy of IR determinations
for antiparallel b-sheet (f
E,IR
¼ 2.44 fi f
E(AP ),IR
% 2.8).
The f scores for the counterparts o f these structures,
f
H(do < 1)
and f
E(par)
, were close to one.
As for t he remaining
DSSP
structures, a f score larger than
1.4 is obtained only w hen C and T are combined for analysis
(C + T + G + S + B, and other c ombinations that
include C + T). If more detailed structural information is
desired, grouping sharp turns in the amide backbone
(T + S or T + G + S) ma y provide some information if
FC
T+S
or FC
T+G+S
are unusually high in the protein.
Similarly,theC+B+S+G or the C+B (for IR)
structure combinations also show moderate correlation to
protein spectra band shapes (f % 1.3) .
The complementarities of information in CD and IR
spectra. By comparing t he f scores in the a mide I + II and
CD columns of Table 2, it can be seen that their
information contents are comparable for all structure types.
However, the change in the f scores between cross
validations from separate CD or IR spectra and the hybrid
spectra (IR + CD) reveal that there can be c omplementa-
ritiesbetweentheinformationcontainedineachdata
region. This p oint is investigated further in t he next section
of the paper.
Estimating accuracy in the secondary structure
determination of an unknown
The rms, f scores and correlation coefficients presented in
the tables above are all summaries of the overall perform-
ance characteristics of protein st ructure statistical analyses.
While these values allow different methods to be compared,
the question asked during the analysis of an unknown is
typically not ÔHow accurate is the method in general?Õ, but
rather ÔHowaccuratewastheanalysisforthisprotein?Õ.In
theory, there are several quantities that can be derived f rom
a statistical analysis that can assist in answering this
question. An accuracy evaluation procedure would be most
useful if it could define an expected margin of error for each
unknown analysis. Presumably, it should be possible to
derive additional information from the w ay that a statistical
model reconstructs the spectrum of the unknown protein .
Quality of the fit
The match between the original a nd re constructed spectra
can be evaluated by taking the difference between the two.
The sum of the absolute values of the differences between
the original and fit spectra at each point is used here to
Table 2. Comparison of determination accuracies for secondary structure assignment combinations and segregations. The secondary structures
determined by the
DSSP
program a nd combined or subdivided. H , a-helix; E , b-sheet; T , b-turns; C, unassigned structures; G, 3
10
-helix;B,isolated
residues with b-sheet // angles; S, bend – residues around which the polypeptide chain makes a sh arp turn but do not meet all criteria for the turn
assignment. Subdivisions of the se co ndary structure are designated as follows: H, a-helix; O , ordered a-helix; do, disordered a-helix. These were
determined by giving all r esidues in an a-helix the o rdered, H(O), assignmentandthenreassigningresiduestothe disordered structure, H(do) < 1,
reassigning residues with no backbone H-bo nds within the helix. b-Sheet subclasses are: AP, antiparallel; par, parallel; long, b-strands more than
four residues long; short b-strands less than five residues long. V alues summarizin g the characteristics of the c rystal structures ch osen for th e full
RaSP50 set. See [32] f or the PDB identification c odes. Mean, arithmetic mean o f all RaS P50 FCs for each listed structure; r
CS
, s tandard deviation
of the FCs; v alues in the Range column indicate the full dynamic range of FC values found in the RaS P50 crystal structure secondary structure
assignments (maximum FC minus minimum); rms, the best rm s obtained for this structure type. This value was the optimal rms for full-band
normalization strategies. f, The information content score (f ¼ r
CS
/RMS) described in th e te xt. The h ighest (best) f scores for each group of
structure types are in bold.
Structure
RaSP50 crystal structures CD Amide I + I I+ CD Amide I + II
rCS Range Mean Fctrs SECV f Fctrs SECV f Fctrs SECV f
H 22.09 74.56 27.5 2 7.61 2.9 1 6.06 3.65 4 6.72 3.29
H(O) < 1 21.82 74.06 26.48 2 7.33 2.98 1 5.98 3.65 4 6.25 3.49
H(do) < 1 0.97 3.57 1.02 2 0.96 1.01 4 0.91 1.06 3 0.87 1.11
E 17.97 61.58 22.35 4 9.22 1.95 4 6.68 2.69 1 7.25 2.48
E(AP) (global) 17.59 56.58 19.1 5 10.53 1.67 3 6.95 2.53 5 6.34 2.78
E(par) (global) 4.58 18.88 3.26 5 4.52 1.01 7 4.3 1.07 1 4.68 0.98
E(long) 15.32 53.68 14.49 4 10.22 1.5 5 8.43 1.82 4 8.36 1.83
E(short) 6.42 22.95 7.86 1 5.45 1.18 3 5.11 1.26 4 4.89 1.31
C+T+G+S+B 13.2 74.56 50.13 5 8.94 1.48 5 8.21 1.61 3 9.43 1.4
Ó FEBS 2004 FTIR-CD spectroscopy of proteins (Eur. J. Biochem. 271) 2943
characterize the residuals of the fit. By comparing the
residuals of an unknown with t he residuals of the reference
spectra obtained during cross validation, an estimation of
reliability could be made. A small residual for a given
analysis is usually considered as a good indication of an
accurate, reliable analysis. Such statistical properties of
chemometric analyses are meaningful in systems where
spectra vary in a purely concentration-dependent manner,
but because protein spectra do not necessarily follow this
rule, the quality of t he fit may not be related to the accuracy
of the analysis. In fact, the fit residuals provide what is
perhaps t he most convincing indication that statistical
analysis of protein spectra is fundamentally different than
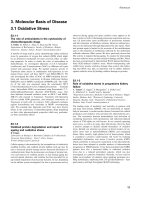
simpler quantitation systems. The situation is illustrated in
Fig. 2A, in which the error for FC
H
determination in cross
validation of t he RaSP50 set is plotted against the spectral
residual for the fit t o each protein. Similar p lots were
obtained for all other structure assignments (not shown).
The correlation coefficient (a linear regression R
2
)forthe
data plotted h ere is 0.024, indicating that the a bility of the
algorithm to reconstruct the protein s pectrum has essentially
no relationship to the accuracy of the analysis.
The Mahalanobis distance of the factors
Another accuracy validation criterion, based on values
derived in the model-construction step, has appeared in
protein structure analysis method reports. When using the
Mahalanobis distance as a reliability evaluation criterion,
the set of factor scores for each spectrum is treated as a
vector in a coordinate system defined by the factors in a
statisticalmodel(f-space).That is, each axis in f-space is one
of the factors, and the coordinates of a spectrum i n f-space
are its factor scores. Typically the score vectors for the
reference spectra form an ellipsoid in f-space. The Maha-
lanobis distance i s a measure of how far from the center of
this ellipsoid the score vector for a given spectrum lies.
If the score vector for an unknown falls significantly outside
the ellipsoid formed by the reference spectra score vectors,
the scores for the unknown therefore follow a different
pattern than those of the basis set. It c an be suggested that a
large Mahalanobis d istance for an unknown indicates that
the statistical analysis algorithm was unable to properly
evaluate the structure of the unknown protein.
The Mahalanobis distan ces vs structure determination
error for b-sheet for the RaSP50 set cross validation is
shown in Fig. 2B. It is clear that the Mahalanobis distance is
also not a useful validation method for protein spectra, at
least w ithin the proteins of the RaSP50 b asis set. The finding
that the Mahalanobis distance does not correlate with
analysis accuracy for the RaSP50 set has important
consequences for structure determination in that it shows
that a novel pattern of factors needed to reconstruct the
spectrum of an unknown protein is not a reliable indication
Fig. 2. Test of potential p redic tors for the structure prediction accuracy.
(A) Relationship betwe en th e FC
H,det
error (FC determination error
for a-helix) and the spectral r esidual from reconstructing unknowns
with the factors from a PLS-1 model. The residual is characterized by
the sum of the absolute values of the d ifference between the a ctual and
reconstructed spectra at each point. These d ata were obtained from a
cross v alidation of hybrid RaSP50 IR + CD spectra. Spectral pre-
processing parameters were optimal. (B) Mahalanobis distanc es for th e
factor s cores (significant f actors only) in the FC d etermination o f FC
E
.
These data were obtained from a cross validation of hybrid RaSP50
IR + CD spectra. Spectral preprocessing parameters were optimal for
FC
E
determination. C. Comparison of the sum of all determined
structures for an unknown (residual for SFC
det
)withFCdetermin-
ation error. d,FC
H,det
errors of individual proteins; compared with s,
FC
E,det
. These data were obtained from a cross validation of hybrid
RaSP50 IR + CD spectra.
2944 K. A. Oberg et al.(Eur. J. Biochem. 271) Ó FEBS 2004
of a failed analysis. Conversely, the results are not neces-
sarily reliab le f or unknowns whose s core vectors fall within
the same region of f-space as the reference-spectra score
vectors.
Do the structure fractional contents total 100%?
Another potential measure o f s tatistical analysis error for an
unknown is the results themselves. Because the FC values
should account fo r all the residues i n a protein, they should
total 100%. If the total is not close to 100%, then it is
reasonable to question the analysis results. The variable
selection method [11], as well as others [35,41] use this as a
criterion for evaluating the qu ality of analysis results. In
particular, this was found to be very useful to build the
SelCon method [5]. As for the residuals and t he scores, the
determination errors for individual proteins are compared
with this accuracy measure in Fig. 2C. Again, there is no
apparent relationship between these quantities. Therefore
the sum of FC
det
values cannot be used to diagnose analysis
accuracy or failure. This finding is important: it indicates
that the determination accuracy for each secondary struc-
ture type is independent of the other structures that have
been analyzed. Therefore, it is not appropriate to disregard
the analysis results in their entirety if a single determined
FC is questionable.
IR/CD comparison
We propose t hat a more reliable method of evaluating
analysis results is the consistency between analysis results
from different s tructure-sensitive techn iques, s uch a s IR and
CD. Because infrared and CD spectra depend on different
phenomena, particular structural distortions are likely to
have a different effect on each of these spectral types, and
that these differences can be used to evaluate analysis
accuracy. In the simplest case, it is necessarily true that when
the FCs obtained from separate analyses of IR and CD
spectra of a protein are very different, then at least one of
the determined structures m ust be Ôincorrect.Õ For conveni-
ence, we will refer to this difference, specifically
FC
IR
À FC
CD
,asDIRCD
det
.
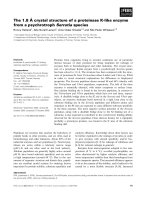
To illustrate the type of information that is available
from DIRCD
det
,theFC
H
determination e rrors for
individual proteins from cross validation of IR-only
and CD-only data is plotted against DIRCD
det
in Fig. 3.
An intuitive relationship is revealed by this figure: when
the FC
H
determined with CD alone is lower than the
FC
H
from IR alone (DIRCD
det
is positive), then the CD
analysis result tends to strongly underestimate the actual
FC
H
. A similar relationship holds when the FC
H
from
IR is the lower value. The linear regression correlation
coefficients (R
2
) for the data plotted in Fig. 2A,B are
0.345 and 0.434, respectively, which indicate a definite
relationship. It appears that DIRCD
det
is the only
quantity examined in this study which has any significant
correlation with analysis error.
In an attempt to evaluate the potentiality of the test
provided by the DIRCD
det
measure, the DIRCD
det
value for
each protein w as used to divide the RaSP50 members into
two subsets with different analysis characteristics. The first
subset was defined a s the proteins with |DIRCD
det
|
(absolute value of DIRCD
det
) smaller than 6%. The rms
FC
H
determination errors calculated for this subset of
proteins were rmsE
H,IR
¼ ± 4.82% H and rmsE
H,CD
¼
± 4.46% H. Combining these results with the a-helix
r
CS,subset
for these 27 proteins in the f score equation gives
f
subset
values of 4.24 and 4.58, respectively (compare with
data in Table 1). If the hybrid IR + CD spectra analysis
results for these same proteins is considered, the rms error
is ± 4.46% H.
These results show that the margin of error for FC
H
determination is reduced when the results from separate
IR and CD analyses a re similar (|DIRCD
det
|<6%).
However, this accounts for just over half of the proteins
in the RaSP50 set. If we consider the remaining proteins,
overall the larger determined FC
H
was more accurate for
74% of the proteins in this second RaSP50 subset. For
b-sheet, a similar observation was made for the
DIRCD
det
> 6% E proteins, but IR was also more
accurate for eight out of 11 proteins. Therefore, the more
accurate result is likely to come from IR analysis. In
conclusion, DIRCD
det
canbeusedtoidentifyproteins
with anomalous spectra (|DIRCD
det
| > 6%), and there-
fore assist in the identification of failed analyses.
Fig. 3. Comparison of FC
det
error and th e d ifference between s eparate
CD and IR analysis results for individual proteins (DIRCD
det
). The
abscissa rep resents the difference be tween separate a nalyses of C D and
IR spectra, DIRCD
det
(higher IR values are to the right) from cross
validation. The ordinates represent the FC
IR
error (FC
IR
–FC
CS
,top
panel) o r FC
CD
errors (bot tom panel) obtained in cross validatio n.
Individual proteins are identified by th eir RaSP codes.
Ó FEBS 2004 FTIR-CD spectroscopy of proteins (Eur. J. Biochem. 271) 2945
Comparison of different statistical analysis algorithms
Thus far, the discussion has focused on the optimization of
input data for protein structure analysis methods. We will
now briefly address the role that the algorithms th emselves
play in analysis accuracy. Recently, Sreerama and Woody
[6] demonstrated on a large set of CD spectra that the
algorithm used (CONTIN, SELCON or CDSSTR) has
littleeffectontherms.WehaveusedtheRaSP50setto
compare different methods on the IR, CD and combined
IR/CD on the broad range of structures represented in
RaSP50. It was found (Table 3) that the choice of analysis
method has only a small effect on analysis accuracy.
By examining selected literature data, it can be observed
that there is a relationship between the number of protein
folds represented in a basis set and the rms. Contrary to
what would be expected, the general t rend is for the error to
increase with the number of proteins used (e.g [41]). For the
CD analyses the relationships for FC
H
and FC
E
are well
represented by straight lines (not shown). Combining this
observation with the frequency of anomalous spectra just
described suggests that those authors who have introduced
more spectra into their reference sets have increased the
number of proteins with anomalous spectra. Through this,
they have degraded the quality of the spectra–structure
relationship i n their statistical models. We suggest that for
small protein basis sets we obtain primarily a measure of
their internal consistency (lack of anomalous spectra) rather
than their expected performance in g eneral. In o rder to test
this hypothesis, a RaSP50 subset was a ssembled using 16 of
the most c ommon proteins in the IR studies with attention
given to maintaining a broad FC distribution. This set,
RaSP16, w as tested both in cross validation and on the
spectra of the full RaSP50 set. We found that the rms values
for the RaSP50 s et are generally lower t han for the R aSP16
set. However, when the RaSP16 statistical model was used
to determine the structures o f all the proteins in the R aSP50
set, its accuracy was % 28% (relatively) worse than when
predictions were made with the RaSP50 m odel. This shows
that there is information in the RaSP50 statistical model
that is lacking from the RaSP16 model. In a second step, w e
randomly generated hundreds of different other 16-protein
databases. Even though the accuracy of the secondary
structure prediction evaluated in cro ss validation yielded
generally RMSs better than the R aSP50, none of them was
able to satisfactorily describe the RaSP50 proteins left out
when building the 16-protein subset. It is impossible t hat the
proteins in the RaSP50 set are representative of a ll possible
structural distortions, so one can ask how much informa-
tion may be lacking from the RaSP50 model. Of course, a
definitive answer to this question cannot be given, but it is
possible to estimate the amount of information d escribing
anomalous signal is contained in the RaSP50 statistical
model. This can be done by comparing the standard errors
from cross validation and self-validation of t he set. Consider
that when an anomalous spectrum is removed from the set
during cross validation, if the information needed to model
that spectrum is not contained i n the remaining spectra then
the FC determination error for that protein will be high.
This in turn will increase the rms. However, in self
validation, all the information contained in the full basis
set can be used to model each s pectrum. Therefore, the
difference between the standard errors of self and cross
validations gives an indication of the completeness of the
information c ontained i n t he basis spectra. F or example, the
standard errors of self valid ation for the RaSP16 set were
3.45% H and 2 .58% E which are essentially half as large as
the RaSP50 rms values.
The latter analyses demonstrate that when the proteins
are carefully selected for the diversity in their structure, no
small subset of the database contains the necessary infor-
mation to describe the entire set. One conclusion of the
paper is therefore that large protein databases, observing
stringent sele ction criteria, are necessary for the prediction
Table 3. Performance comparison of different analysis algorithms with the RaSP50 set. PCA-MR, principal component analysis followed by
multiple regression, constrained to a 100% total; P LS, simultaneous partial least-squares analyses of all structure classes, constrained to a 100%
total; PLS-1, sep arate partial least-squares analyses of each structure t ype with the use of weighting during the spec tral decomposition step. SelCon
has been described in detail in [5].
Data Algorithm
a-Helix (H) b-Sheet (E) Turn (T)
S Other (C + G
+B+S)
RMS f R
a
RMS f R
a
RMS f R
a
RMS f R
a
IR (Amide
I + II)
SelCon3 8.5 2.6 0.92 7.73 2.34 0.90 3.52 1.23 0.38 11.58 1.04 0.26
PCA-MR 6.91 3.2 0.95 7.64 2.35 0.91 4.38 0.99 0.22 9.27 1.3 0.64
PLS 7.29 3.03 0.94 7.58 2.37 0.91 4.36 1 0.21 9.48 1.27 0.62
PLS-1 7.16 3.09 0.95 7.36 2.44 0.91 4.31 1.01 0.13 9.49 1.27 0.62
IR + CD SelCon3 7.57 2.91 0.939 7.97 2.27 0.90 3.97 1.09 0.36 10.30 1.17 0.47
PCA-MR 6.83 3.24 0.95 7.23 2.48 0.92 4.23 1.02 0.29 9.26 1.3 0.64
PLS 6.8 3.25 0.95 6.97 2.58 0.92 4.3 1.01 0.27 9.06 1.33 0.66
PLS-1 6.73 3.28 0.95 6.68 2.69 0.93 4.45 0.97 0.03 9.16 1.31 0.66
CD SelCon3 8.15 2.71 0.91 10.43 1.73 0.82 4.74 0.91 0.00 9.70 1.24 0.55
PCA-MR 7.97 2.77 0.93 9.37 1.92 0.85 4.55 0.95 0.14 8.93 1.35 0.68
PLS 7.72 2.86 0.94 9.47 1.9 0.85 4.47 0.97 0.14 8.96 1.34 0.67
PLS-1 7.7 2.87 0.94 9.22 1.95 0.89 4.47 0.97 0.00 9.03 1.33 0.67
a
The correlation coefficient (R) between the determined and actual FCs for the full RaSP50 set.
2946 K. A. Oberg et al.(Eur. J. Biochem. 271) Ó FEBS 2004
of unknown p roteins. A second important conclusion of the
paper is that only the comparison of analyses run on CD
and IR spectra independently is able to identify failed
solutions in the absence of known structure.
As far as t he specific case of mem brane protein is
concerned, the issue has been raised a number of times but it
is now definitively s ettled. Fasman claimed that the trans-
membrane and peripheral helices could be distinguished on
the b asis of their deconvolved CD spectrum [46,47]. Wallace
investigated the performance of soluble p rotein sets of CD
spectra in analyzing membrane protein CD spectra. The
conclusion was that the soluble protein referen ce set of CD
spectra yields inaccurate results for membrane protein CD
spectra [48,49]. Conversely, S reerama and Woody showed
recently for 13 membrane proteins that the re is no system-
atic difference in the CD spectra of soluble and membrane
proteins. Yet, they reported that increasing the number of
proteins in the CD spectrum database from soluble p roteins
is an important factor to improve the prediction. Similarly,
the additional inclusion of the CD spectra of membrane
proteins brings a small but significant additional improve-
ment. In the field of infrared spectroscopy, anomalous
frequencies have been described for the transmembrane
helices of proteins such as bacteriorhodopsin [50] but most
of the membrane proteins have been shown to have a typical
helix contribution o riginating from the t ransmembrane
helices. In conclusion, more work is needed to asses the
quality of the prediction form membrane proteins.
Acknowledgements
This work was funded by an ARC grant (Action de Recherche
Concerte
´
e, Co mmunaute
´
franc¸ aise de Belgique, Belgium). Dr Goor-
maghtigh is Research Director at the Belgian National Fund For
Scientific Research, Belgium.
References
1. Baumruk, V., Pancoska, P. & Keiderling, T.A. (1996) Predictions
of sec ondary structure using statistical analyse s of electronic and
vibrational circular dichroism and Fourier transform infrared
spectra of proteins i n H
2
O. J. Mol. Biol. 259, 774–791.
2. Rahmelow, K. & Hu
¨
bner, W . (1996) Secondary structure
determination of proteins in aqueous solution by infrared spec-
troscopy: a comparison of multivariate data analysis methods.
Anal Biochem. 241, 5–13.
3. Dalmas, B. & Bannister, W.H. (1995) Prediction o f protein sec-
ondary structure from circular dichroism spectra: an attempt to
solve the problem of the best-fitting reference protein subsets.
Anal. Biochem. 225, 39–48.
4. Pribic, R. (1994) Principal component analysis of Fourier trans-
form infrared and/or circular dichroism spectra of proteins applied
in a calibration of protein secondary structure. Anal. Biochem. 223,
26–34.
5. Sreerama, N. & Woody, R.W. (1 993 ) A self-consistent method for
the analysis of protein secondary structure from circular dichro-
ism. Anal. Biochem. 20 9 , 32–44.
6. Sreerama, N . & Woody, R.W. (2000) Estimation of protein sec-
ondary structure from c ircular dichroism spectra: Comparison of
CONTIN, SELCON, and CDSSTR methods with an expanded
reference set. Anal. Biochem. 287, 2 52–260.
7. Perczel, A., Hollosi, M., Tusnady, G. & Fasman, G.D. (1991)
Convex constraint analysis: a natural deconvolution of circular
dichroism curves o f proteins. Protein E ng. 4, 669–679.
8. Dousseau, F. & Pe
´
zolet, M. (1990) Det ermination of the second-
ary structure content of proteins in aqueous so lutions from th eir
amide I an d amide II infrared bands. Comparison between clas-
sical and partial least-squares methods. Biochemistry 29, 8771–
8779.
9. Sarver, R .W. & Krueger, W.C. (1991) An infrared and circular
dichroism combined app roach t o the analysis of p rotein s econdary
structure. Anal. Biochem. 199, 61–67.
10. Kalnin, N.N., Baik alov, I.A. & Venyaminov, S.Y. (1990) Quan-
titative IR spectrophotometry of peptide compounds in water
(H
2
O) solutions. III. Estimation of the p rotein secondary struc-
ture. Biopolymers 30, 1 273–1280.
11. Manavalan, P. & J ohnson, W.C. (1987) Variable selection method
improves the prediction of protein secondary structure from cir-
cular dichroism spectra. Anal. Biochem. 167, 76–85.
12. Provencher, S.W. & Glockner, J. (1981) Estimation of globular
protein secondary structu re from circular dichroism. Bioc hemistry
20, 33–37.
13. Cabiaux,V.,Oberg,K.A.,Pancoska,P.,Walz,T.,Agre,P.&
Engel, A. (1997) Secondary structures c omparison of aquaporin-1
and bacteriorhodopsin: a Fourier transform infrared spectroscopy
study of two-dim ensional memb rane c rystals. Biophys. J. 73 ,
406–417.
14. Pancoska, P., Fabian, H., Yoder, G., Bau mruk, V. & Ke iderling,
T.A. (1996) P rotein structural segments and their interconnections
derived from optical spectra. T hermal unfolding o f ribonuclease
T1 as an example. Biochemistry 35 , 13094–13106.
15. Venyaminov, S .Y. & Yang, J.T. ( 1996) Determination of P rotein
Secondary Structure. In Circular Dichroism and the Conforma-
tional Analysis of Biomolecules (Fasman, G.D., ed.), pp. 69–107.
Plenum Press, New York.
16. Venyaminov, S.Y. & Vassilenko, K.S. (1994) Determination of
protein tertiary structure class from circular dichroism spectra.
Anal. Biochem. 222, 176–184.
17. Andrade, M.A., Chacon, P., Merelo, J.J. & Moran, F. (1993)
Evaluation of secondary structure of p roteins from UV circular
dichroism spectra using an u nsupervised learning neural n etwork.
Protein Eng. 6, 383– 390.
18. Bohm, G., Muhr, R. & Jaenicke, R. (1992) Quantitative analysis
of protein far UV circular dichroism spectra by neural networks.
Protein Eng. 5, 191– 195.
19. Pribic, R., van Stokkum, I.H., Chapman, D., Haris, P.I. &
Bloemendal, M. (1993) Protein secondary structure from Fourier
transform infrared and/or circular dichroism spectra. Anal. Bio-
chem. 214, 366–378.
20. Lee, D.C., Haris, P.I., Chapman, D. & Mitchell, R.C. (1990)
Determ ina tio n o f p rot ein s ec on da ry structure using factor analysis
of infrared spectra. Biochemistry 29, 9185–9193.
21. Byler, D.M. & Susi, H. (1986) Examination of the secondary
structure of proteins by deconv olved FTIR spectra. Biopolymers
25, 469–487.
22. Surewicz, W .K. & Mantsch, H.H. (1988) New insight into protein
secondary structure from resolution- enhanced infrared s pectra.
Biochim. Biophys. Acta 952, 115–130.
23. Goormaghtigh, E., Cabiaux, V. & Ruysschaert, J.M. (1994)
Determination of soluble and membrane protein structure by
Fourier transform infrared spectroscopy. I. Assignments and
model compounds. Subcell. Biochem. 23, 329–362.
24. Arrondo, J.L.R. & Goni, F.M. (1999) Structu re and dynamics of
membrane proteins as studied by infrared spectroscopy. Prog.
Biophysics Mol Biol. 72, 367–405.
25. Jackson, M. & Mantsch, H.H. ( 1995) The use and misuse of FTIR
spectroscopy in the d eter mination of protein structure. Crit. Rev.
Biochem. Mol. Biol. 30, 95–120.
26. Harris, P.I., Chapman, D. & Benga, G. (1995) A F ourier-trans-
form infrared spectroscopic investigation of the hydrogen-
Ó FEBS 2004 FTIR-CD spectroscopy of proteins (Eur. J. Biochem. 271) 2947
deuterium exchange and secondary structure of the 2 8-kDa
channel-forming integral membrane protein (CHIP28). Eur. J.
Biochem. Mol. Biol. 23 3, 659–664.
27. Oberg, K.A. & Fink, A.L. (1998) A new attenuated total
reflectance Fourier transform infrared spectroscopy method for
the study of proteins in solution. Anal. Biochem. 256, 92–106.
28. Van Hoek, A.N., W iener, M., B icknese, S., Miercke, L., Biwersi, J.
& V erkman, A.S. (1993) Secondary structure an alysis of purified
functional CHIP28 water channels by CD and FTIR spectro-
scopy. Biochemistry 32, 11847–11856.
29. Goormaghtigh, E ., Cabiaux, V. & Ruysschaert, J.M. (1990) Sec-
ondary structure and dosage of soluble and membrane proteins by
attenuated total reflection Fourier-transform infrared spectro-
scopyonhydratedfilms.Eur. J. Biochem. 193, 409–420.
30. Jap, B.K., Maestre, M.F., Hayward, S.B. & Glaeser, R.M. (1983)
Peptide-chain secondary structure of bacteriorhodopsin. Biophys.
J. 43, 81–89.
31. Orengo, C.A., Michie, A.D., Jones, S., Jones, D.T., Swindells,
M.B. & Thornton, J.M. (1997) CATH – a hierarchic classification
of protein d omain structures. Struct ure 5, 1093–1108.
32. Oberg, K.A., Ruysschaert, J.M. & Goormaghtigh, E. (2003)
Rationally selected basis proteins: a new approach to selecting
proteins for spectroscopic secondary structure analysis. Protein
Sci. 12, 2 015–2031.
33. Kabsch, W. & Sand er, C. (1983) Dic tionary of prote in seco ndary
structure: pattern recognition of hydrogen-bo nded and geome-
trical features. Biopolymers 22, 2577–2637.
34. Scopes, R.K. (1987) Measurement of E nzyme A ctivity. In Protein
Purification: Principles and Practice (Cantor, C.R., e d.), pp. 278–
283. Springer-Verlag, New York.
35. Hennessey, J.P. & Johnson, W.C. (1981) Information
content in the circular dichroism of proteins. Biochemistry 20,
1085–1094.
36. Powell, J.R., Wasacz, F.M. & Jakobsen, R.J. (1986) An algorithm
for the reproducible spec tral subtractio n of water from the FTIR
spectra of proteins in dilute solutions and adsorb ed monolayers.
Appl. Spectrosc. 40, 339–344.
37. Venyaminov, S.Y. & Kalnin, N.N. (1990) Quantitative IR spec-
trophotometry of peptide compounds i n water (H
2
O) solutions. I.
Spectral p arameters o f amino acid resid ue absorption bands.
Biopolymers 30 , 1243–1257.
38. Bairoch, A. & Apweiler, R. (1998) The SWISS-PROT protein
sequence data bank and i ts supple ment TrEMBL in 1998. Nuc leic
Acids Res. 26, 38–42.
39. Bairoch, A. & Boeckmann, B. (1991) The SWISS-PROT protein
sequence data bank. Nucleic Acids Res. 19 , 2247–2249.
40. Goormaghtigh, E., de-Jongh, H.H. & Ruysschaert, J.M. (1996)
Relevance of protein thin films prepared for attenuated total
reflection Fourier tr ansform i nfrared spectroscopy: significance of
the pH. Appl. Spectrosc. 50, 1519–1527.
41. Pancoska, P ., Bitto, E ., Janota, V ., Urbanova, M., Gupta, V.P. &
Keiderling, T.A. (1995) Comparison of and limits of accuracy for
statistical a nalyses of vibrational and e lectronic circular d ichroism
spectra in terms of correlations to and predictions o f protein sec-
ondary structure. Protein Sci. 4, 1384–1401.
42. Woody, R.W. (1994) Contributions of tryptophan side chains to
the far-ultraviolet circular dichroism of proteins. Eur. Biophys. J.
23, 253–262.
43. Woody, R.W. & D unker, A.K. (1996) Aromatic and cystine side-
chain circular dichroism in proteins. In Circular Dic hroism and the
Conformational Analysis of Biomolecules (Fasman, G.D. ed.), pp.
109–157. Plenum Press, New York.
44. Barth, A. (2000) The infrared absorption of amino acid side
chains. Prog. Biophysics Mol Biol. 74, 141–173.
45. Barth, A. & Zscherp, C. (2002) What vibrations tell us about
proteins. Quaterly Rev. Biophys. 35, 3 69–430.
46. Park, K., Perczel, A. & Fasman, G.D. (1992) Differentiation
between transmembrane helices and peripheral h elices by the
deconvolution of circular dichroism spectra of membrane
proteins. Protein Sci. 1, 1032–1049.
47. Fasman, G.D. (1996) Differentiation between transmembrane
helices and peripheral helices by the deconvolution of circular
dichroism spectra of membrane proteins. In Circular Dichroism
and the Conformation of Biomolecules (Fasman, G.D. ed.), pp.
381–412. Plenum Press, New York and London.
48. Wallace, B.A., Cascio, M. & M ielke, D.L. (1986) Evaluation of
methods for the prediction of membr ane protein secondary
structures. Proc. N atl Acad. Sc i. USA 83, 9423–9427.
49. Wallace,B.A.,Lees,J.G.,Orry,A.J.W.,Lobley,A. &Janes,
R.W. (2003) A nalyses of circular dichroism spectra of m embrane
proteins. Protein Sci. 12, 875–884.
50. Rothschild, K.J. & Clark, N.A. (1979) Anomalous amide I
infrared absorp tion of purple membra ne. Science 204, 311–312.
2948 K. A. Oberg et al.(Eur. J. Biochem. 271) Ó FEBS 2004


![Tài liệu Báo cáo khoa học: The stereochemistry of benzo[a]pyrene-2¢-deoxyguanosine adducts affects DNA methylation by SssI and HhaI DNA methyltransferases pptx](https://media.store123doc.com/images/document/14/br/gc/medium_Y97X8XlBli.jpg)