Báo cáo khoa học: Principles behind the multifarious control of signal transduction ERK phosphorylation and kinase/phosphatase control potx
Bạn đang xem bản rút gọn của tài liệu. Xem và tải ngay bản đầy đủ của tài liệu tại đây (347.62 KB, 15 trang )
Principles behind the multifarious control of signal
transduction
ERK phosphorylation and kinase/phosphatase control
Jorrit J. Hornberg
1
, Frank J. Bruggeman
1
, Bernd Binder
2
, Christian R. Geest
1
,
A. J. Marjolein Bij de Vaate
1
, Jan Lankelma
1,3
, Reinhart Heinrich
2
and Hans V. Westerhoff
1,4
1 Department of Molecular Cell Physiology, Institute for Molecular Cell Biology, BioCentrum Amsterdam, Vrije Universiteit, Amsterdam,
the Netherlands
2 Department of Theoretical Biophysics, Humboldt University, Berlin, Germany
3 Department of Medical Oncology, VU medical center, Amsterdam, the Netherlands
4 Swammerdam Institute for Life Sciences, BioCentrum Amsterdam, University of Amsterdam, the Netherlands
Much signal transduction occurs through cascades of
activation and inactivation. The mitogen-activated
protein-kinase (MAPK) cascades are highly conserved
examples. They govern many cellular processes, such
as proliferation and differentiation (reviewed in [1,2]).
They consist of a linear cascade of three kinases that
each phosphorylate the next one in line. The kinases
are counteracted by phosphatases. The net function of
such a pathway, i.e. to decide whether a downstream
protein is in the inactive or the active state, is thus the
Keywords
control analysis; kinase; MAPK pathway;
phosphatase; systems biology
Correspondence
H. V. Westerhoff, Department of Molecular
Cell Physiology, Faculty of Earth and Life
Sciences, Free University Amsterdam,
De Boelelaan 1085, 1085 HV Amsterdam,
the Netherlands
Fax: +31 20 4447229
Tel: +31 20 4447230
E-mail:
Websites: />mcp/
/>Note
The mathematical model described here has
been submitted to the Online Cellular Sys-
tems Modelling Database and can be
accessed free of charge at: http://
jjj.biochem.sun.ac.za/database/hornberg/
index.html
(Received 16 July 2004, revised 15 September
2004, accepted 24 September 2004)
doi:10.1111/j.1432-1033.2004.04404.x
General and simple principles are identified that govern signal transduc-
tion. The effects of kinase and phosphatase inhibition on a MAP kinase
pathway are first examined in silico. Quantitative measures for the control
of signal amplitude, duration and integral strength are introduced. We then
identify and prove new principles, such that total control on signal ampli-
tude and on final signal strength must amount to zero, and total control
on signal duration and on integral signal intensity must equal )1. Collec-
tively, kinases control amplitudes more than duration, whereas phospha-
tases tend to control both. We illustrate and validate these principles
experimentally: (a) a kinase inhibitor affects the amplitude of EGF-induced
ERK phosphorylation much more than its duration and (b) a phosphatase
inhibitor influences both signal duration and signal amplitude, in particular
long after EGF administration. Implications for the cellular decision
between growth and differentiation are discussed.
Abbreviations
EGF, epidermal growth factor; ERK, extracellular signal-regulated kinase; ERK-PP, doubly phosphorylated ERK; MAP(K), mitogen-activated
protein (kinase); MEK, MAPK ⁄ ERK kinase; NRK, normal rat kidney; PTP, protein tyrosine phosphatase; TBS, tris-buffered saline.
244 FEBS Journal 272 (2005) 244–258 ª 2004 FEBS
result of the concerted action of all kinases and phos-
phatases [3]. In many human tumors, the MAPK path-
way via the extracellular signal-regulated kinases
(ERK) 1 and 2, is constitutively active [4]. This is often
associated with somatic mutations in genes that encode
components that activate the pathway, such as Ras or
Raf [5,6]. The magnitude and duration (transient vs.
sustained) of MAPK activation are critical for the cel-
lular response [7,8], for instance by influencing differ-
ent target genes [9]. However, it is not understood
completely, to what extent amplitude and duration of
signaling are controlled by the kinases or phosphatases
in the system, and whether they are controlled differ-
entially by some or all of them. On the basis of the
antagonistic action of the kinases and phosphatases
one might expect them to control signal transduction
precisely in opposite ways, as has been shown for
steady-state signal transduction [10].
Experimental possibilities to investigate this issue are
limited by the incompleteness of the arsenal of inhibi-
tors of specific kinases or phosphatases. Systems bio-
logy approaches that combine mathematical modeling
with quantitative experimentation may help in such
cases [11–13]. Detailed mathematical models are avail-
able that describe and predict the behavior of a few
complex signaling networks [14–20]. However, such
specific models can be cumbersome when one wishes
to track down general principles. Simpler models have
led to new suggestions concerning protein kinase signa-
ling, such as the possibility of spatially resolved signa-
ling [21] and have also shed light on the control of
kinases and phosphatases on signal transduction [22].
For instance, it was predicted that, in a protein kinase
signaling pathway, kinases mainly control signaling
amplitude, whereas phosphatases control both signa-
ling amplitude and duration of signaling [22]. Here, we
shall first use a simple model of a MAPK cascade.
With properties of these as inspiration, we shall then
employ mathematics to extend hierarchical control
analysis [8] to time-dependent processes and derive
general principles of signal transduction cascades.
Some of the methodology is similar to that employed
in a recent extension of control analysis to the spatial
domain [23]. The results confirm and extend predic-
tions of earlier theoretical work, namely that duration
of signaling is controlled mainly by phosphatases and
that all kinases together control signaling amplitude to
the exact same extent as all phosphatases together.
We test these general principles experimentally in the
ERK pathway of normal rat kidney (NRK) fibroblasts.
These cells can be synchronized relatively easily, causing
all cells to behave similarly in response to external stim-
uli. They are used frequently as a model system to study
cellular alterations that accompany oncogenic transfor-
mation [24]. Activation of the ERK pathway is required
for the proliferation of fibroblasts [25]. The pathway
consists of three kinases in succession (Raf, MEK and
ERK) and can be activated by various extracellular
stimuli, including the epidermal growth factor (EGF).
We determined the effect of kinase and phosphatase
inhibitors on the activity of the ERK pathway upon
EGF stimulation. Our experimental findings confirm
the predictions from the theoretical work, namely that
kinases control signaling amplitude rather than the
duration of signaling and that phosphatase activity
mainly controls duration.
The mathematical model described here has been
submitted to the Online Cellular Systems Modelling
Database and can be accessed at: chem.
sun.ac.za/database/hornberg/index.html free of charge.
Results
How kinase and phosphatase inhibition affect
signal transduction
In order to track down principles governing the con-
trol of signal transduction, we analyzed a kinetic
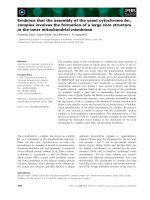
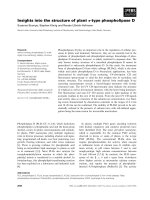
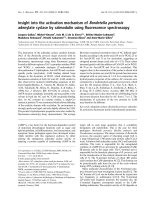
Fig. 1. Schematic representation of the reactions in the model. Act-
ive receptor R activates a cascade of three kinase ⁄ phosphatase
monocycles, by phosphorylating (activating) X1 to X1P (v3). X1P
then causes the phosphorylation of X2 to X2P (v5), which, in turn,
activates the last monocycle (X3 to X3P; v7). The phosphorylated
counterparts are dephosphorylated (v4, v6 and v8, respectively), as
is the receptor (to Ri; v1). We modeled the case in which the ligand
that activates the receptor remains present and therefore the inac-
tive receptor was taken to slowly recycle to become active again
(v2). The architecture of the model was intended to represent a
simplified form of a MAPK pathway.
J. J. Hornberg et al. How kinases and phosphatases control signaling
FEBS Journal 272 (2005) 244–258 ª 2004 FEBS 245
model of a simple linear pathway that consisted of a
receptor and three consecutive kinase ⁄ phosphatase
monocycles (Fig. 1). The activation and inactivation
reactions in the model are analogous to phosphoryla-
tion (by kinases) and dephosphorylation (by phospha-
tases) reactions in cellular signaling pathways such as
the MAPK cascade. The first kinase was activated by
a receptor that switches slowly between an active and
an inactive state.
As the duration and amplitude of signaling may be
critical for the response evoked [7], we calculated the
activation time profile of the signaling molecules
(Fig. 2). Receptor activation (e.g. by EGF binding)
was instantaneous, at t ¼ 0. Whilst the concentration
of active receptor R declined over time, the three con-
secutive kinases (X1, X2 and X3) were activated (i.e.
were phosphorylated to become X1P, X2P and X3P,
respectively), reached a peak value and subsequently
declined to levels that exceeded the level before recep-
tor activation. These time-patterns for activation of
the components of the MAPK cascade were commen-
surate with what has been reported experimentally for
many cell types and with the experimental results we
will present here. This stimulated us to interrogate the
model as to how these time patterns are controlled by
the kinases and the phosphatases.
In order to examine how the second kinase in the
cascade determines the time dependence of the activity
of the third kinase, we varied the V
max
of the second
kinase reaction and recalculated the concentration of
the active form of the third kinase as a function of
time. (This modulation corresponded to the experiment
described below in which MEK, the second kinase of
the MAPK pathway, was inhibited by the noncompeti-
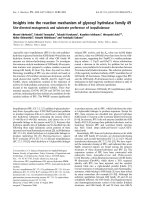
tive inhibitor PD98059 [26].) The results show that the
peak concentration of X3P decreased substantially
(Fig. 3A). The duration (width) of the peak also
decreased, but much less so; an inhibition that
decreased the peak height by 25%, advanced the time
at which the signal returned to below 0.1 by 10%. The
final level of X3P also decreased very significantly
when calculated in relative terms; the final level was
already low before the kinase was inhibited (Fig. 3A).
We concluded that in this example, the activity of the
second kinase exerted substantial control on signaling
amplitude, both in the initial phase of signaling and
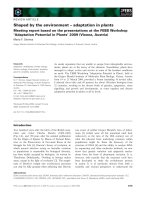
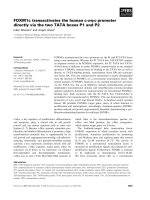
Fig. 2. Time profile of the activity of the four proteins in the model.
The receptor R is inactivated (relatively) quickly to attain a very low
steady state concentration. The kinase ⁄ phosphatase cycles are acti-
vated slightly after each other to reach a maximal peak concentra-
tion, and then decrease to a low steady state concentration. The
activity of the pathway was considered to be represented by the
X3P concentration, which is in line with MAPK pathways, in which
the active third kinase has multiple cytoplasmic and nuclear targets.
Calculations on the various aspects of signaling were performed on
(a) signaling amplitude A, i.e. the maximal X3P concentration that
was attained; (b) duration of signaling d, i.e. the time point at which
the X3P concentration dropped below an arbitrarily chosen value of
0.05; (c) the ‘integral signal strength’, i.e. the area-under-the-curve
until d (this represents the total effect X3P would have on a target
molecule) and (d) the final signaling amplitude, i.e. the steady state
X3P concentration that is attained.
How kinases and phosphatases control signaling J. J. Hornberg et al.
246 FEBS Journal 272 (2005) 244–258 ª 2004 FEBS
much later, and less control on the duration of signa-
ling. The effect of signal transduction on transcription
of downstream genes might not just be a function of
the amplitude of X3P. Other aspects of signaling
dynamics may be important as well, such as frequency
of recurrent pulses [27] or the integrated concentration
of an active molecule (e.g. the area under the X3P
curve). Accordingly, we also calculated the area-under-
the-curve before t ¼ 50 and found that kinase inhibi-
tion had a considerable effect on this (Fig. 3A).
To examine the influence of phosphatases on signa-
ling kinetics, and in particular whether that role should
always be the opposite of that of the corresponding
kinases, we introduced an inhibitor, I, that competit-
ively inhibited the dephosphorylation of X3P. In this
way we anticipated an experiment (see below) in which
protein tyrosine phosphatases were inhibited. We
calculated that, with increasing inhibitor concentration,
the X3P peak concentration became quite a bit higher
(Fig. 3B). In addition, the inhibitor increased the dur-
ation of the peak dramatically, prolonging X3P signa-
ling. For instance, an inhibitor concentration that
increased the peak height by one-third, doubled the
time it took for the X3P concentration to drop below
0.1. Phosphatase inhibition also increased both the
final level of X3P and the ‘area-under-the-curve’ quite
substantially (Fig. 3B).
These calculations lead to the hypothesis that phos-
phatases and kinases were equally important for two
characteristics of signal transduction, i.e. the peak
amplitude and final amplitude, whereas the duration of
signaling and the ‘area-under-the-curve’ might be more
exclusively the control domain of the phosphatases.
The latter would confirm a prediction from earlier the-
oretical work [22]. To corroborate this hypothesis, we
systematically modulated the activities of all compo-
nents in the model, by increasing (and subsequently
decreasing) the rate constant by a factor of two for
one reaction at a time. The effects on the signaling
characteristics specified above were calculated and the
results confirmed that the peak amplitude and the final
level were controlled both by kinases and by phospha-
tases, whereas the duration, although influenced by
kinases, was mainly controlled by phosphatases (results
not shown).
Quantification suggests that all kinases are
equally as important for signaling amplitude
as all phosphatases
In the absence of any quantification of the strength of
control, the above suggestion that kinases and phos-
phatases exert (opposite) control on amplitudes in sig-
nal transduction remains vague. It is not clear whether
the effects on amplitudes should be precisely equal but
opposite, and whether it should be expected that this
be true for the control by a kinase and the phospha-
tase acting at the same level of the cascade. In order
to address these issues, we need to quantify the extents
of control exerted by the individual kinases and phos-
phatases. We do this by asking: ‘What is the percent-
age change in signal strength that is induced by a 1%
activation of a kinase or a phosphatase?’ This (or
rather the variant in which the percentage is infinites-
imal) corresponds to the control coefficient as defined
for the flux control by enzymes in metabolic pathways
[28–31] and for the steady-state amplitudes in signal
transduction [10,19]. Here we shall use these control
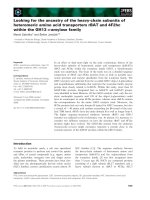
A
B
Fig. 3. The effect of kinase and phosphatase inhibition in the X3P
time profile. (A) The second kinase reaction in the model (v5) was
increasingly inhibited (noncompetitive inhibition by decreasing the
V
max
). This caused a large decrease of the amplitude. Duration was
also affected, but not as much. (B) The third phosphatase reaction
(v8) in the model was increasingly inhibited (by increasing the con-
centration of the competitive inhibitor I). This caused an increase in
both the amplitude and duration of signaling. Both kinase and phos-
phatase inhibition also affected the integral signal strength and
steady state X3P concentration.
J. J. Hornberg et al. How kinases and phosphatases control signaling
FEBS Journal 272 (2005) 244–258 ª 2004 FEBS 247
coefficients to quantify the control on (a) the peak
height (i.e. the highest X3P concentration that was
attained) and (b) the final signal strength (i.e. the
steady state X3P concentration that was attained).
The kinase reactions all had positive control coeffi-
cients both with respect to peak height and with respect
to final signal strength (Table 1). This was expected as
kinases activate the pathway and thus cause higher
amplitudes. The phosphatase reactions, on the other
hand, all had negative control coefficients, again in line
with expectations. However, one might have the expec-
tation that corresponding kinases and phosphatases
(e.g. kinase 1 and phosphatase 1) should always have
precisely opposite effects on certain aspects of signa-
ling. Indeed, such antagonism is found for the control
on the final steady state amplitude (Table 1, bottom
row), which is in line with the control analysis for
steady states [10]. The expectation is not borne out for
signaling before that steady state is attained: controls
on maximal signal amplitude, for instance, were oppos-
ite in sign, but not always equal in absolute magnitude
(e.g. compare column kin1 with column pho1 in
Table 1). Our calculations therefore reject the intuition
purporting that the kinase in a certain monocycle
should have precisely the same control strength as the
corresponding phosphatase in that monocycle. Further
inspection of Table 1 shows that, both for the maxi-
mum signal amplitude and for its final amplitude, the
total control by the kinases and the receptor reactiva-
tion was almost equal to the total control by the phos-
phatases and receptor inactivation (‘Total’ in Table 1).
This could have been a coincidence, or it could reflect
a general principle. To shed light on this, we calculated
the control coefficients of all processes together on the
amplitude and final signal strength (by simultaneously
perturbing all processes (‘all’ column in Table 1). We
found that both coefficients were 0, which indeed
shows that the total control of all activating processes
equals the total control of all inactivating processes.
Phosphatases are more important for signal
duration and integral signal intensity than
kinases
Figure 3 suggested that duration and (possibly) the
integrated signal are controlled more by phosphatases
than by kinases. To be more precise, we define dur-
ation of signaling as the time point at which the X3P
concentration declined below the (arbitrarily chosen)
low value of 0.5% of total X3 (¼ 0.05). The integral
signal strength, which is a measure for the total num-
ber of downstream molecules that are affected by the
signal, was calculated as the total area under the
Table 1. Control of any out of four characteristics of the time dependent signal by any of the molecular processes in the cascade. The signal is taken to reside in the extent of phosphory-
lation of the third kinase in the model MAPK pathway (Fig. 1). The characteristics of that signal are its maximum (amplitude), its ultimate value (final strength), its duration and its time-
integrated concentration. Controlling processes are receptor activation and inactivation and the three consecutive kinase and phosphatase processes. Control is quantified in terms of the
control coefficients defined in the text. A control coefficient equals the derivative towards a reaction rate. Here, we have calculated the control coefficients by increasing the rate of a reac-
tion by 1% and then divide the relative effect on the characteristics by the relative change in reaction rate. The calculated control coefficients depicted here therefore slightly deviate from
the actual control coefficient (numerical error). All the individual control coefficients were summed (Total). Furthermore, the control coefficient for all reactions together was calculated
(All), by simultaneously increasing all reaction rates by 1%. Conclusions that can be drawn from the table are discussed in the text. R. inact., receptor inactivation reaction; R. act., receptor
activation reaction.
Reaction
v1
R. inact.
v2
R. act. v1 + v2
v3
kin 1
v4
pho 1 v3 + v4
v5
kin 2
v6
pho 2 v5 + v6
v7
kin 3
v8
pho 3 v7 + v8
Activating
processes
Inactivating
processes Total All Law
Amplitude )1.20 0.03 )1.17 1.21 )0.81 0.40 1.15 )0.77 0.38 1.06 )0.64 0.41 3.45 )3.43 0.02 0.00 0
Duration )0.44 0.17 )0.27 0.44 )0.60 )0.16 0.42 )0.62 )0.21 0.38 )0.70 )0.32 1.40 )2.37 )0.96 )0.99 )1
Integral )1.41 0.12 )1.30 1.43 )1.25 0.18 1.35 )1.24 0.12 1.22 )1.16 0.06 4.12 )5.06 )0.94 )0.99 )1
Final strength )1.03 1.04 0.01 1.03 )1.02 0.01 1.03 )1.02 0.01 1.02 )1.01 0.01 4.12 )4.08 0.04 0.00 0
How kinases and phosphatases control signaling J. J. Hornberg et al.
248 FEBS Journal 272 (2005) 244–258 ª 2004 FEBS
‘signal strength’ vs. time curve until the X3P concen-
tration declined below 0.05. We shall again use control
coefficients to quantify the control of the duration of
signaling and ‘integral signal strength’ (Table 1).
The inactivation reaction (i.e. phosphatase or recep-
tor inactivation) always had a more negative control
than the corresponding activation reaction (i.e. kinase
or receptor reactivation) had positive control. Signal
duration and integral signal strength were not con-
trolled equally by corresponding kinases and phospha-
tase. For these two signaling characteristics, the total
precise antagonism of all kinases (activating enzymes)
combined and all phosphatases (inactivating enzymes)
combined was not obtained either. So, are there no gen-
eral principles for these aspects of signal transduction?
We did calculate that all phosphatases together must
exert higher negative control on duration and on the
integral signal strength than all kinases together exert
positive control. Also, the difference in control, i.e. the
sum of all control coefficients on duration (and the
integral) was not zero, but )1 or close to that (‘Total’
in Table 1). Perhaps this )1 also reflects a general prin-
ciple, which should then be the quantitative underpin-
ning of the greater average importance of phosphatases
than kinases for duration and integral signal strength.
Of course, these findings can be no more than sugges-
tions, as they were obtained for a certain set of kinetic
parameters and a certain type of kinetics of the kinases
and phosphatases. When we next repeated the above
calculation for different magnitudes of the kinetic
parameters, both the curves and the individual control
coefficients varied with the parameters that were set in
the model (Fig. 4 and results not shown). Figure 4
shows a case where the activation reactions were more
active, leading to a higher peak in X3P phosphorylation;
in fact at the peak most X3 was phosphorylated. Fig-
ure 4B shows that, as expected for this case, the phos-
phatase inhibitor had little effect on the peak height. As
all X3 was already X3P at the peak, little more X3P
could be generated. Accordingly, the control by the
phosphatases on the peak height was smaller (Table 2).
Table 2 shows that also for this case, the following fea-
tures were observed: (a) corresponding kinases and
phosphatases did not exert equal opposite control; (b)
control of all activating enzymes combined equaled con-
trol by all inactivating enzymes with respect to signal
amplitude and (c) control of all inactivating enzymes
exceeded the control by all activating enzymes with
respect to both duration and integral signal strength.
The control for all processes together equaled 0 for
peak amplitude and final signal strength and it equaled
)1 for duration and integral signal strength (‘All’ in
Table 2). Therefore, even though the changes in the
parameters caused the individual control coefficients to
change significantly, the total control always produced
the same result. This led us to hypothesize that there
are laws that govern the totals of control, just as there
are for total control of metabolic fluxes and concentra-
tions [29]. Proving such general laws, however, requires
more than the calculation of a number of examples;
the general case must be addressed.
Summation laws for control on signal
transduction
The above definition of the extent to which a process
controls an aspect of signal transduction, i.e. in terms
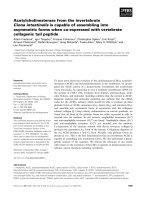
A
B
Fig. 4. The calculations were repeated with different magnitudes of
the kinetic parameters. The activation reactions were more active,
leading to a higher peak X3P concentration. Inhibition of the second
kinase reaction (v5) again decreased the amplitude of signaling (A).
Inhibition of the third phosphatase reaction (v8) had some effect on
the amplitude (B), but this was significantly smaller than in the case
of Fig. 3, as now virtually all X3 was phosphorylated in the peak.
Duration and integral signal strength were again affected by both
kinase and phosphatase inhibition, although inhibition of the phos-
phatase appeared to have more effect on these signaling character-
istics.
J. J. Hornberg et al. How kinases and phosphatases control signaling
FEBS Journal 272 (2005) 244–258 ª 2004 FEBS 249
of a corresponding control coefficient, enables the
application of mathematical methodologies. As shown
in the Appendix, this makes it possible to prove a sum-
mation law for: the maximum signal strength; the dur-
ation of the signal; the final signal strength and the
integral signal strength. The summing is over all
the processes in the system, and its results are given in
the final column of Table 1.
We present herein the principle behind the proof.
This is the concept that equal activation of all reac-
tions has the same effect as accelerating time. Starting
at t ¼ 0, we consider the situation that all processes
become 1% more active. This has the effect that every-
thing happens 1% faster than in the control situation,
but in precisely the same way. Consequently, the maxi-
mum signal strength and the final signal strength will
be the same, each signal magnitude will be reached 1%
earlier and the integral signal intensity will be 1%
smaller (because everything lasts 1% less time).
Accordingly, the sum of the control of all process rates
on maximum and final signal strength must be zero
and the sum of their control on duration and on integ-
ral signal strength )1.
This statement, with respect to signal amplitude, dic-
tates that the average control by the kinases (or, to be
more precise, by the activating processes) should be
equal (though opposite in sign) to the average control
by the phosphatases (or, to be more precise, by all the
inactivating processes). Accordingly, both kinases and
phosphatases must control signal amplitude. Also,
inescapably, in cascades where kinases exert stronger
control on amplitude than in any reference cascade,
the phosphatases must also exert stronger control than
in that reference cascade. It is not possible that in one
cascade control resides more with the kinases whereas,
in a different cascade, the phosphatases are more in
control.
With respect to duration and integral signal
strength, this is different. By ‘taking away’ signal, the
phosphatases accelerate the signal transduction dynam-
ics. Also, the total control corresponds to this acceler-
ation. In more precise terms, the total negative control
by the phosphatases (or inactivating enzymes) on both
duration and integral signal strength must always be 1
stronger than the total positive control exerted by the
kinases (or activating enzymes). In cases where total
control by the phosphatases is close to )1, there will
be little control by the kinases. More generally, there
is a tendency for the kinases to control duration and
integral signal strength less than the phosphatases do.
This then is the precise underpinning of the tendencies
described in the earlier sections of this paper (Figs 3
and 4 and Tables 1 and 2).
Table 2. Control of any reaction on any signaling characteristic in a case with a different set of parameters. The individual control coefficients are different from those in Table 1, but the
summation laws remain. See the text for the conclusions and further discussion of this Table.
Reaction
v1
R. inact.
v2
R. act. v1 + v2
v3
kin 1
v4
pho 1 v3 + v4
v5
kin 2
v6
pho 2 v5 + v6
v7
kin 3
v8
pho 3 v7 + v8
Activating
processes
Inactivating
processes Total All Law
Amplitude )0.42 0.01 )0.41 0.40 )0.27 0.13 0.38 )0.25 0.13 0.34 )0.23 0.11 1.12 )1.17 )0.04 0.00 0
Duration )0.83 0.71 )0.12 0.86 )1.00 )0.13 0.84 )1.03 )0.19 0.80 )1.16 )0.36 3.21 )4.02 )0.81 )0.99 )1
Integral )0.86 0.19 )0.68 0.86 )0.90 )0.03 0.81 )0.91 )0.10 0.71 )0.88 )0.17 2.57 )3.55 )0.97 )0.99 )1
Final strength )1.05 1.06 0.01 1.05 )1.04 0.01 1.05 )1.04 0.01 1.04 )1.03 0.01 4.20 )4.15 0.05 0.00 0
How kinases and phosphatases control signaling J. J. Hornberg et al.
250 FEBS Journal 272 (2005) 244–258 ª 2004 FEBS
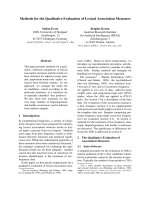
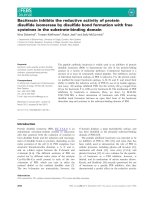
Experimental validation
Kinases control amplitude rather than duration
We set out to test the predictions, based on the theor-
etical work here and in an earlier study [22], experi-
mentally in a MAPK signaling network in living cells.
We focused on the influence of the second kinase in
the MAPK cascade, MEK, on the time profile of ERK
(i.e. the third kinase) phosphorylation upon growth
factor stimulation. The model predicted that MEK
would mainly control the peak height and perhaps the
final amplitude, and less so the peak duration (Figs 3A
and 4A). To address this question, we arrested NRK
fibroblasts in the G
0
-phase using serum-starvation. The
MAPK pathway was then stimulated with EGF,
samples were taken after various incubation times and
the ERK-PP concentration of cell lysates was meas-
ured by quantitative Western blotting. Stimulation
with EGF was carried out in the presence of various
concentrations of the noncompetitive MEK inhibitor
PD98059 [26]. We observed a biphasic ERK-PP time
profile, consisting of a rapid high peak followed by a
low quasi-steady state (Fig. 5A). Increasing MEK
inhibitor concentrations resulted in decreased peak
heights. Added inhibitor had little affect the duration
(width) of the peak. These results confirm the model
predictions that kinase inhibition affects signaling
amplitude much more than signaling duration.
Phosphatases control duration of signaling
In the model simulation, phosphatases controlled maxi-
mum signaling amplitude, signaling duration, final sig-
nal amplitude and integral signal strength. To test
these predictions experimentally, we applied the protein
tyrosine phosphatase (PTP) inhibitor, sodium ortho-
vanadate, to arrested NRK fibroblasts that were stimu-
lated subsequently with EGF. PTP inhibition resulted
in a broader peak followed by a relatively high final
quasi-steady ERK-PP concentration (Fig. 5B), both in
consonant with the model predictions.
The peak height in the presence of the phosphatase
inhibitor was no higher than that in control cells. This
result corresponds closely to that simulated for the
model of Figs 4B i.e. the case where the applied
amount of EGF was close to saturating. Indeed, it has
been previously shown that in NRK cells, this EGF
concentration causes virtually all ERK to become dou-
bly phosphorylated ([32], and our unpublished obser-
vation). We conclude that the experimental results
obtained with a kinase inhibitor and with a phospha-
tase inhibitor were in complete correspondence with
our modeling and mathematical results and those
reported previously [22].
Discussion
Cellular behavior is brought about by the concerted
action of many components. On one hand these com-
ponents should be studied individually but on the
other, cell physiology should address the functioning
of the entire cell. What often remains unanalyzed is to
what extent and how individual components contribute
to (i.e. control) the functioning of cellular systems,
such as the activity of signaling networks. Such ana-
lysis is of vital importance not only for understanding
cellular systems but also for drug design, as it helps
in the process of choosing potential drug targets
A
B
Fig. 5. Experimental validation of the theoretical results. (A) Inhibi-
tion of MEK, the second kinase in the MAPK pathway to ERK,
using the noncompetitive inhibitor PD098059, led to a decrease in
the peak ERK-PP concentration. (B) Protein tyrosine phosphatase
inhibition, using orthovanadate, significantly increased the duration
of the presence of ERK-PP.
J. J. Hornberg et al. How kinases and phosphatases control signaling
FEBS Journal 272 (2005) 244–258 ª 2004 FEBS 251
according to the magnitude of their control on cell
pathology [11,33].
What do we know about the control of intracellular
signaling? Its pathways, such as the MAPK cascades,
are often composed of kinase and phosphatase pairs.
But how important are the kinases and phosphatases
relative to each other? Are all combinations of the
control of signal transduction possible? Here, we com-
bined the analysis of a kinetic model of a simple signa-
ling pathway, with mathematics and with quantitative
experimentation on MAPK signaling. We showed that
there are general principles regarding the control of
protein kinase signaling cascades, and also that these
principles differ from the ones one might have guessed
intuitively. The principles demonstrated here confirm
and elaborate on previous predictions that were made
on the basis of a theoretical analysis of a simple model
of signal transduction [22]. Here, we also verify these
predictions experimentally.
In a simplified mathematical model, we calculated
the control distribution on four features of the activity
of a signaling cascade: the amplitude of signaling; the
final intensity of signaling; the duration of signaling
and the integral signal intensity (which corresponds to
the ‘area-under-the-curve’). For MAPK and other
signaling pathways, these features are important deter-
minants for the biological response that is evoked.
Amplitude should be important if a certain activation
threshold must be exceeded to cause a downstream
effect. For instance, such a form of MAPK activation
is required for the proliferation of fibroblasts [25]. A
paradigmatic example of the importance of duration in
PC12 cells is that sustained MAPK activity leads to
differentiation whereas transient MAPK signaling cau-
ses proliferation [7]. In rat hepatocytes, rapid, transient
MAPK activation promotes progression through the
G
1
phase of the cell cycle and entry into the S phase,
whereas prolonged MAPK activation inhibits this pro-
cess [8]. Furthermore, the repertoire of downstream
genes that are expressed upon MAPK activation
depends on the duration of signaling [9]. These data
imply that critical cellular decisions are made at the
level of the activation characteristics of signaling cas-
cades, such as the MAPK pathway and that distin-
guishing between the early amplitude and late plateau,
and duration and area-under-the-curve may be import-
ant for understanding differential control of down-
stream processes by the activities of kinases and
phosphatases, and other (in-)activating processes.
In our analysis, we introduced new quantitative
measures for the strength of control, akin to those
used in metabolic control analysis, to calculate to what
extent individual kinase and phosphatase reactions
control these decisive signaling characteristics. For two
examples of a signal transduction cascade we showed
that control of the amplitudes, the duration and the
integrated activation of signaling was distributed over
all processes within the cascade and that the control
exerted by the individual processes differ. This is in
line with what is known about control distribution in
metabolic pathways [29,31,34,35]. What is different
from the control of metabolic pathways is the total
control. For the main function of metabolic pathways,
i.e. the rate of product formation (the ‘flux’), control
adds up to 1. Here, control of two characteristics of
signal transduction adds up to 0 and of two other
characteristics to )1. Although a summation rule for
control coefficients of transient times also exists in
control analysis when applied to metabolism [36], this
further substantiates that control of signal transduc-
tion differs fundamentally from the control of meta-
bolic flux [10].
These summation principles for signal transduction
were then derived mathematically. This means that
these principles are not accidental for the two exam-
ples of a linear signal transduction pathway analyzed
here numerically but are general for any signal trans-
duction pathway that fulfils the definition given here.
This definition is quite general (Appendix). Signaling
pathways are frequently regulated by (nonlinear) feed-
back and feed-forward circuitry [37,38]. The summa-
tion does not depend on a linear structure of the
network.
Principles of general validity are also called ‘laws’:
they could have been discovered experimentally, they
require precise definition of conditions and properties,
and they can be derived from underlying accepted
principles by employing mathematics. Here the under-
lying principles include the usual types of deterministic
kinetics and local stability of the system. It is not often
that understanding of an aspect of cell biology can be
achieved by using analytical mathematics.
The laws dictate that the control of all processes on
the amplitude of signaling must equal 0 and that the
total control on the duration (and integrated activity)
of signaling must equal )1. This implies that (a) all
kinases together are necessarily of exact equal import-
ance for the amplitude (i.e. both the maximal and the
steady state activity) as are all phosphatases together,
and that (b) the total control on the signal duration
and integrated strength by all phosphatases always
exceeds the total control of all kinases. This statement
should read ‘all activating enzymes’ for kinases and all
‘inactivating enzymes’ for the phosphatases, in case
reactions other than kinases and phosphatases are
involved in the cascade. Here, it should be noted that
How kinases and phosphatases control signaling J. J. Hornberg et al.
252 FEBS Journal 272 (2005) 244–258 ª 2004 FEBS
this conclusion may depend on the structure of the
signaling network. Non-linearity, caused by regulatory
circuits, may yield unexpected control properties. For
instance, if a kinase is involved in a nonlinear negative
feedback loop, it is possible that its overall control on
the activity of the network proves to be negative, ren-
dering, e.g. a lower amplitude. However, total control
on the amplitude must sum to 0, meaning that one
or more of the other processes in the network will
compensate for the negative control by the particular
kinase.
Although many components of the MAPK pathway
have been identified, not all processes that control its
activity are known. Therefore, and due to the limita-
tion of experimental possibilities, at present it is not
feasible to determine exactly the control coefficients
for all individual reactions in the MAPK pathway.
Our experimental results, however, illustrate that the
general principles we deduced in the theoretical work
we report here and have reported previously [22] are in
qualitative accordance with the experimental data for
the functioning of a complex signaling network in liv-
ing cells: a kinase (MEK) inhibitor affected the ampli-
tude of signaling through MAPK, while leaving
duration unaffected. A (protein tyrosine) phosphatase
inhibitor influenced both duration of signaling to
MAPK and its amplitude in the steady state. We did
not find an effect of the phosphatase inhibitor on the
first peak. This can be attributed to the fact that EGF
stimulation causes virtually all ERK molecules to be
doubly phosphorylated in the first peak ([32] and our
unpublished observation). Phosphatase inhibition
could therefore not further elevate the amplitude in the
peak, and the experimental result was in line what we
obtained by modeling for this case of maximum phos-
phorylation of ERK (Fig. 4B).
The summation laws have a number of implications
for drug therapy, as well as for the understanding of
oncogene function. For instance, for cell functions that
depend on integrated concentration of phosphorylated
ERK (such as total transcription of a target gene) the
summation laws prescribes a constant total control of
)1. The prescribed constancy of control implies that if
the control exerted by one enzyme kinase (or phospha-
tase) is altered (which could be achieved by adding an
inhibitor or by mutation of its gene), the control of at
least one other enzyme (but most probably of many
others) is altered as well. Application of such an inhib-
itor as a drug, or the occurrence of mutations affecting
the control by one enzyme, will therefore almost always
interfere with the regulation of the signal transduction
pathway by all regulatory mechanisms, not just by the
regulators that impinge on the step that is directly
affected by the inhibitor or the mutation. This may well
have implications for the application of signal trans-
duction modulators in cancer treatment, such as tyro-
sine kinase inhibitors that have already been validated
as promising clinical agents in targeted therapies
[39,40]. A more positive note is that the effect of onco-
genic mutations on the activity of a target molecule in
tumor cells will affect cellular signaling, but in addition,
the control that other kinases or phosphatases have on
that signaling. Therefore, antitumor strategies need not
only focus on the molecular target of the mutation, but
could also be directed against other steps in the path-
way, with largely similar results. Or, from a slightly dif-
ferent perspective, the oncogenic mutation should lead
to redistribution of the control and hence to the emer-
gence of additional new targets at other sites in the net-
work. Network-based drug design, a systems biology
approach, may help identify those targets [11] and
enable rationalized combination therapies.
Another issue that may be more readily understood
now, is that mutations in MAP kinases and phosphatases
can differ in the extent to which they shift a cell between
differentiation and proliferation. If kinases and phos-
phatases were considered to be precisely each others
antipode, then less kinase activity should have the same
effect as more phosphatase activity and a mutation in
either should increase or decrease both differentiation
and proliferation rather than cause a shift between
them. Our demonstration that kinases and phosphatases
affect the amplitude and duration of signaling differ-
ently, provides a possible explanation for such a shift:
phosphatase inhibition should activate more the func-
tions that depend on sustained transcription of a regula-
tory gene (such as differentiation), whereas kinase
stimulation (or to be more precise stimulation of any of
the activating processes, such as by Ras activation)
should activate more the function depending on short-
term transcription (perhaps proliferation).
Experimental procedures
Model description
We constructed a mathematical model of a simple linear
signal transduction pathway that consists of a receptor and
three consecutive kinase ⁄ phosphatase monocycles (Fig. 1).
In the model the receptor (R) is activated instantaneously
by added EGF. It is then inactivated over time (to become
Ri). The inactive form of the receptor is re-circulated slowly
to become active once again; the case where EGF remains
present. The active form of the receptor phosphorylates
and thereby activates the first kinase X1 (to become X1P).
Through phosphorylation, this kinase can then activate the
J. J. Hornberg et al. How kinases and phosphatases control signaling
FEBS Journal 272 (2005) 244–258 ª 2004 FEBS 253
second kinase (X2), which, in turn, can activate a third kin-
ase (X3). All reaction steps follow Michaelis–Menten kin-
etic rate equations, with V
max
¼ 1.0 and K
m
¼ 0.1 for the
activating (kinase) reactions and the receptor inactivation
reaction (reaction 1); V
max
¼ 0.3 and K
m
¼ 1.0 for the
deactivating (phosphatase) reactions; and V
max
¼ 0.01 and
K
m
¼ 0.1 for the receptor recirculation reaction. We consi-
der explicit conservation relations for each of the three kin-
ases, i.e. the concentrations of the active and inactive form,
sum up to 1. The initial concentrations for Ri, X1P, X2P
and X3P were set to 0 and the initial concentrations were
set to 1 for X1, X2, X3 and to 0.5 for R. All concentrations
are in mM. It must be stressed that the model was not con-
structed to accurately describe the MAPK pathway, but to
derive general principles that apply to any signal transduc-
tion pathway of this type. The parameter values do not
determine the general conclusions. The model is also avail-
able on our website ( />ments/). The model was analyzed with gepasi 3.30, a public
domain software program specifically designed to simulate
biochemical networks [41,42]. The kinase reactions were
taken to depend proportionally on the concentration of
their corresponding activators (i.e. the preceding phosphor-
ylated kinase). To show that our conclusions do not depend
on this specific set of model parameters (Fig. 4 and
Table 2), the simulation was repeated with increased reac-
tion rates for the kinases: the V
max
of the kinase reactions
were set to 1.2.
Cell culture
NRK fibroblasts were cultured in Dulbecco’s modified
Eagle’s medium (Cambrex Bio Science Verviers SPRL, Ver-
viers, Belgium), supplemented with 10% (w ⁄ v) fetal bovine
serum (Gibco; Invitrogen Corporation, Carlsbad, CA,
USA), 0.10 gÆL
)1
penicillin and 0.10 gÆL
)1
streptomycin in
a humidified 5% (v ⁄ v) CO
2
incubator at 37 °C. For serum-
starvation, cells were washed them with 1· Hank’s buffered
salt solution (Gibco) and then used the same medium, but
with 0.5% (w ⁄ v) bovine serum albumin (AppliChem
GmbH, Darmstadt, Germany) instead of serum.
Stimulation experiments
Cells were grown in culture dishes to subconfluency and
then serum-starved for three days in order to be arrested in
the G
0
-phase of the cell cycle. Subsequently, cells were sti-
mulated with 10 ngÆmL
)1
EGF (Becton Dickinson, Frank-
lin Lakes, NJ, USA) for the indicated periods of time.
Enzyme inhibitors were purchased from Calbiochem (San
Diego, CA, USA). Where indicated MEK was inhibited by
preincubation for 1 h with various concentrations of the
noncompetitive inhibitor PD98059 [26]. We preincubated
cells for 1 h with 0.20 mm sodium orthovanadate [43] to
inhibit PTPs.
Western blot analysis
After stimulation, cells were washed twice with ice-cold
phosphate-buffered saline (17 mm NaH
2
PO
4
, 38.5 mm
Na
2
HPO
4
,68mm NaCl, pH 7.4) and incubated on ice with
‘lysis buffer’ [10 mm Tris ⁄ HCl, pH 7.5, 150 mm NaCl,
0.1% (v ⁄ v) SDS, 0.1% (v ⁄ v) Nonidet P40, 0.1% (w ⁄ v)
sodium deoxycholate, 50 mm NaF, 1 mm sodium-ortho-
vanadate, 1· Complete protease inhibitor mix (Roche,
Basel, Switzerland)] for 20 min. Cell lysates were scraped
using a cell scraper (25 cm per 1.8 cm, Costar, Dow Corning
Europe, Seneffe, Belgium), collected, vortexed for 10 s,
frozen in liquid nitrogen and stored at )80 °C. Protein con-
tents in the cell lysates were determined with the BCA assay
(Pierce, Rockford, IL, USA). Proteins were separated by
SDS ⁄ PAGE, using a 12% resolving gel. Exactly 10 lgof
total protein of each sample was loaded onto the gel in load-
ing buffer [0.25 m Tris ⁄ HCl (pH 7.6), 8% (w ⁄ v) SDS, 40%
(v ⁄ v) glycerol, 0.05% (w ⁄ v) bromophenol blue, 20 mm
dithiothreitol]. Proteins were electrotransferred to Immuno-
Blotä poly(vinylidene difluoride) membranes (Bio-Rad
laboratories, Hercules, CA, USA) using a current of 0.40 A
overnight at 4 °C. Membranes were washed in Tris-buffered
saline [TBS: 20 mm Tris ⁄ HCl (pH 7.6), 150 mm NaCl] sup-
plemented with 0.05% Tween 80 (TBS-T), preincubated for
1 h at room temperature with blocking buffer [5% skim-
milk powder (Oxoid Ltd, Basingstoke, UK) in TBS-T], sup-
plemented with 0.5 mm Na
3
VO
4
, and incubated overnight
at 4 °C with a monoclonal anti-(phospho-p44 ⁄ 42 MAP kin-
ase) Ig (Cell Signaling Technology Inc., Beverly, MA,
USA) in blocking buffer (1 : 2000), supplemented with
0.5 mm Na
3
VO
4
. After washing, membranes were incubated
for 1 h at room temperature with horse-radish peroxidase-
conjugated goat anti-(mouse IgG) (Bio-Rad) in blocking
buffer (1 : 3000). Membranes were washed again and then
incubated for 5 min with Lumi-Light
PLUS
Western Blotting
Substrate (Roche). Signals were detected with a FluorS
TM
MultiImager (Bio-Rad) and quantified using the multi-
analist software (Bio-Rad). All measurements were carried
out in the linear range of the method. The standard error
of the mean was 4.6% of the measured value.
Acknowledgements
We thank Boris N. Kholodenko for intensive discus-
sions, and him and Mark Peletier for discussions on
summation laws of this type.
References
1 Widmann C, Gibson S, Jarpe MB & Johnson GL
(1999) Mitogen-activated protein kinase: conservation
of a three-kinase module from yeast to human. Physiol
Rev 79, 143–180.
How kinases and phosphatases control signaling J. J. Hornberg et al.
254 FEBS Journal 272 (2005) 244–258 ª 2004 FEBS
2 Cobb MH (1999) MAP kinase pathways. Prog Biophys
Mol Biol 71, 479–500.
3 Sun H & Tonks NK (1994) The coordinated action of
protein tyrosine phosphatases and kinases in cell signal-
ing. Trends Biochem Sci 19, 480–485.
4 Hoshino R, Chatani Y, Yamori T, Tsuruo T, Oka H,
Yoshida O, Shimada Y, Ari-iS, Wada H, Fujimoto J &
Kohno M (1999) Constitutive activation of the 41- ⁄ 43-
kDa mitogen-activated protein kinase signaling pathway
in human tumors. Oncogene 18, 813–822.
5 Bos JL (1989) ras Oncogenes in human cancer: a review.
Cancer Res 49, 4682–4689.
6 Davies H, Bignell GR, Cox C, Stephens P, Edkins S,
Clegg S, Teague J, Woffendin H, Garnett MJ, Bottom-
ley W et al. (2002) Mutations of the BRAF gene in
human cancer. Nature 417 , 949–954.
7 Marshall CJ (1995) Specificity of receptor tyrosine kin-
ase signaling: transient versus sustained extracellular sig-
nal-regulated kinase activation. Cell 80, 179–185.
8 Tombes RM, Auer KL, Mikkelsen R, Valerie K,
Wymann MP, Marshall CJ, McMahon M & Dent P
(1998) The mitogen-activated protein (MAP) kinase
cascade can either stimulate or inhibit DNA synthesis in
primary cultures of rat hepatocytes depending upon
whether its activation is acute ⁄ phasic or chronic.
Biochem J 330, 1451–1460.
9 Cook SJ, Aziz N & McMahon M (1999) The repertoire of
fos and jun proteins expressed during the G1 phase of the
cell cycle is determined by the duration of mitogen-acti-
vated protein kinase activation. Mol Cell Biol 19, 330–341.
10 Kahn D & Westerhoff HV (1991) Control theory of reg-
ulatory cascades. J Theo Biol 153, 255–285.
11 Bakker BM, Michels PA, Opperdoes FR & Westerhoff
HV (1999) What controls glycolysis in bloodstream form
Trypanosoma brucei? J Biol Chem 274, 14551–14559.
12 Bhalla US, Ram PT & Iyengar R (2002) MAP kinase
phosphatase as a locus of flexibility in a mitogen-acti-
vated protein kinase signaling network. Science 297 ,
1018–1023.
13 Kitano H (2002) Systems biology: a brief overview.
Science 295, 1662–1664.
14 Huang CY & Ferrell JE Jr (1996) Ultrasensitivity in the
mitogen-activated protein kinase cascade. Proc Natl
Acad Sci USA 93 , 10078–10083.
15 Kholodenko BN, Demin OV, Moehren G & Hoek JB
(1999) Quantification of short term signaling by the epi-
dermal growth factor receptor. J Biol Chem 274, 30169–
30181.
16 Bhalla US & Iyengar R (1999) Emergent properties of
networks of biological signaling pathways. Science 283,
381–387.
17 Asthagiri AR & Lauffenburger DA (2001) A computa-
tional study of feedback effects on signal dynamics in a
mitogen-activated protein kinase (MAPK) pathway
model. Biotechnol Prog 17, 227–239.
18 Schoeberl B, Eichler-Jonsson C, Gilles ED & Muller G
(2002) Computational modeling of the dynamics of the
MAP kinase cascade activated by surface and interna-
lized EGF receptors. Nat Biotechnol 20, 370–375.
19 Lee E, Salic A, Kruger R, Heinrich R & Kirschner MW
(2003) The roles of APC and axin derived from experi-
mental and theoretical analysis of the Wnt pathway.
PLoS Biology 1, e10.
20 Swameye I, Muller TG, Timmer J, Sandra O & Kling-
muller U (2003) Identification of nucleocytoplasmic
cycling as a remote sensor in cellular signaling by data-
based modeling. Proc Natl Acad Sci USA 100, 1028–
1033.
21 Brown GC & Kholodenko BN (1999) Spatial gradients
of cellular phospho-proteins. FEBS Lett 457, 452–454.
22 Heinrich R, Neel BG & Rapoport TA (2002) Mathe-
matical models of protein kinase signal transduction.
Mol Cell 9, 957–970.
23 Peletier MA, Westerhoff HV & Kholodenko BN (2003)
Control of spatially heterogeneous and time-varying
cellular reaction networks: a new summation law.
J Theor Biol 225, 477–487.
24 van Zoelen EJ (1991) Phenotypic transformation of nor-
mal rat kidney cells: a model for studying cellular alter-
ations in oncogenesis. Crit Rev Oncog 2, 311–333.
25 Page
`
s G, Lenormand P, L’Allemain G, Chambard JC,
Meloche S & Pouyssegur J (1993) Mitogen-activated
protein kinases p42mapk and p44mapk are required for
fibroblast proliferation. Proc Natl Acad Sci USA 90,
8319–8323.
26 Alessi DR, Cuenda A, Cohen P, Dudley DT &
Saltiel AR (1995) PD098059 is a specific inhibitor of
the activation of mitogen-activated protein kinase
kinase in vitro and in vivo. J Biol Chem 270,
27489–27494.
27 Lahav G, Rosenfeld N, Sigal A, Geva-Zatorsky N,
Levine AJ, Elowitz MB & Alon U (2004) Dynamics of
the p53-Mdm2 feedback loop in individual cells. Nat
Genet 36, 147–150.
28 Burns JA, Cornish-Bowden A, Groen AK, Heinrich R,
Kacser H, Porteous JW, Rapoport SM, Rapoport TA,
Stucki JW, Tager JM et al (1985) Control analysis of
metabolic systems, Trends in Biochem Sci 10, 16.
29 Westerhoff HV & Van Dam K (1987) Thermodynamics
and Control of Biological Free-Energy Transduction.
Elsevier, Amsterdam.
30 Fell DA (1992) Metabolic control analysis: a survey of
its theoretical and experimental development. Biochem J
286, 313–330.
31 Heinrich R & Schuster S (1996) The Regulation of Cel-
lular Systems. Chapman & Hall, New York.
32 Lahaye DH, Camps MG, Erp PE, Peters PH & Zoelen
EJ (1998) Epidermal growth factor (EGF) receptor den-
sity controls mitogenic activation of normal rat kidney
(NRK) cells by EGF. J Cell Physiol 174, 9–17.
J. J. Hornberg et al. How kinases and phosphatases control signaling
FEBS Journal 272 (2005) 244–258 ª 2004 FEBS 255
33 Cascante M, Boros LG, Comin-Anduix B, de Atauri P,
Centelles JJ & Lee PW (2002) Metabolic control analy-
sis in drug discovery and disease. Nat Biotechnol 20,
243–249.
34 Kacser H & Burns JA (1973) The control of flux. Symp
Soc Exp Biol 27, 65–104.
35 Fell DA (1997) Understanding the Control of Metabo-
lism. Portland Press, London.
36 Heinrich R & Rapoport TA (1975) Mathematical analy-
sis of multienzyme systems. II. Steady state and transi-
ent control. Biosystems 7, 130–136.
37 Milo R, Shen-Orr S, Itzkovitz S, Kashtan N, Chklov-
skii D & Alon U (2002) Network motifs: simple build-
ing blocks of complex networks. Science 298, 824–827.
38 Shen-Orr SS, Milo R, Mangan S & Alon U (2002) Net-
work motifs in the transcriptional regulation network of
Escherichia coli. Nat Genet 31, 64–68.
39 Sebolt-Leopold JS (2000) Development of anticancer
drugs targeting the MAP kinase pathway. Oncogene 19,
6594–6599.
40 Shawver LK, Slamon D & Ullrich A (2002) Smart
drugs: Tyrosine kinase inhibitors in cancer therapy.
Cancer Cell 1, 117–123.
41 Mendes P (1997) Biochemistry by numbers: simulation
of biochemical pathways with Gepasi 3. Trends Biochem
Sci 22, 361–363.
42 Mendes P & Kell D (1998) Non-linear optimization of
biochemical pathways: applications to metabolic engi-
neering and parameter estimation. Bioinformatics 14,
869–883.
43 Huyer G, Liu S, Kelly J, Moffat J, Payette P, Kennedy
B, Tsaprailis G, Gresser MJ & Ramachandran C (1997)
Mechanism of inhibition of protein-tyrosine phospha-
tases by vanadate and pervanadate. J Biol Chem 272,
843–851.
44 Acerenza L, Sauro HM & Kacser H (1989) Control
analysis of time-dependent metabolic systems. J Theor
Biol 137, 423–444.
45 Kholodenko BN, Demin OV & Westerhoff HV (1997)
Control analysis of periodic phenomena in biological
systems. J Physical Chem B. 101, 2070–2081.
46 Ingalls BP & Sauro HM (2003) Sensitivity analysis of
stoichiometric networks: an extension of metabolic con-
trol analysis to non-steady state trajectories. J Theor
Biol 222, 23–36.
47 Westerhoff HV & Chen YD (1984) How do enzyme
activities control metabolite concentrations? An addi-
tional theorem in the theory of metabolic control. Eur J
Biochem 142, 425–430.
Supplementary material
The following material is available from http://
www.blackwellpublishing.com/products/journals/suppmat/
EJB/EJB4404/EJB4404sm.htm
Appendix S1. A description of the model including
kinetic equations and additional data.
Appendix
Summation law for the control of time
dependent phenomena
We here discuss a dynamic reaction system with spatial
homogeneity [23]. In this system, n reactions, num-
bered with the index i, take place, each at a rate e
i
.v
i
.
Through v
i
, the rates are functions of concentrations
(x
j
)ofm reactive molecules in the system, and they are
each further characterized by an activity e
i
. In some
systems these e
i
values correspond with enzyme con-
centrations, such as the concentration of a protein kin-
ase or a protein phosphatase. A chemical reaction v
i
leads to a time-dependent increase in the concentration
of substance x
j
as given by [32] and Eqn (1):
dx
j
dt
¼
X
n
i¼1
n
ji
Á e
i
Á v
i
ð
xÞ: ð1Þ
Here, n
ji
is a stoichiometric number, which is positive
when x
j
is a product of the reaction and negative when
it is a substrate. The vector
x contains the concentra-
tions of all m reactive molecules. The equation
assumes that during the time of observation, the envi-
ronment of the system is constant i.e. any external
change such as the addition of EGF should have
occurred at or slightly before t ¼ 0. The equation
then defines the dynamics of the system in time. We
shall assume that the above differential has a unique
solution that is asymptotically stable in the sense of
Lyapunoff [29].
Equation (1) and the concentrations at time zero,
which we denote by
x
0
, define the concentrations at
any point in time:
x
j
ðe
i
; tÞ¼x
j
ð0Þþ
Z
s¼t
s¼0
X
n
i¼1
n
ji
Á e
i
Á v
i
ð
xÞÁds: ð2Þ
We shall now consider a transformation in which
inspections are made at earlier times (i.e. at t¢ rather
than t) or, at times expressed in seconds rather than in
minutes. In addition, starting at t ¼ 0, any process i is
made to run faster by a factor k
i
(or its units are chan-
ged from min
)1
into s
)1
). Accordingly, the times are
‘earlier’ by a factor k
t
and activities have increased by
the same factor k
i
:
t
0
t=k
t
ð3Þ
e
0
i
e
i
Á k
i
ð4Þ
How kinases and phosphatases control signaling J. J. Hornberg et al.
256 FEBS Journal 272 (2005) 244–258 ª 2004 FEBS
At time zero the untransformed and the transformed
system have the same concentrations of all their com-
ponents, i.e.
x
0
. Substituting into Eqn (2), one obtains:
x
j
0
ðe
i
; tÞ¼x
j
ðk
i
Á e
i
; t=k
t
Þ
¼ x
j
ð0Þþ
Z
s¼t=k
t
s¼0
X
n
i¼1
n
ji
Á k
i
Á e
i
Á v
i
ð
xÞÁds
Writing z for sÆk
t
, this becomes:
x
j
ðk
i
Á e
i
; t=k
t
Þ¼x
j
ð0Þþ
Z
z¼t
z¼0
X
n
i¼1
n
ji
Á
k
i
k
i
Á e
i
Á v
i
ð
xÞÁdz
Because z is just a dummy integration variable, this
implies that:
x
j
ðk
i
Á e
i
; t=k
t
Þ¼x
j
ð0Þþ
k
i
k
i
Á x
j
ðe
i
; tÞÀx
j
ð0Þ
ÀÁ
We now consider the case where all these transforma-
tion factors are equal. They then drop out of the
above equation, implying that:
xðk Á t; k
À1
Á e
i
Þ¼k
0
Á
xðt; e
i
Þ:
This shows that the concentrations are homogeneous
functions of order zero, of all process activities at
order 1 and of time at order )1. Using Euler’s theorem
for homogeneous functions one then formulates the
summation law for time-dependent concentration con-
trol coefficients [23]:
X
n
i¼1
C
x
i
¼ C
x
t
where, the control coefficients have been defined by:
C
x
t
¼
d ln x
d ln t
and
C
x
i
¼
d ln x
d ln e
i
:
It may be noted that these definitions generalize the
control coefficients defined by metabolic control analy-
sis for steady state properties to time dependent prop-
erties [44–46]. Where the control by time is zero, e.g.
in steady state or at an extreme point in the transient
dynamics, the law reduces in form to the traditional
law derived from steady state equations [47]:
X
n
i¼1
C
x
m
i
¼ 0:
We note however, that the traditional law was limited
to steady states, whereas here, we have derived it so
that it also applies to the maxima and minima in time
dependencies in nonstationary phenomena. For the
present discussion, the law applies both to the maxi-
mum level of ERK phosphorylation and to its steady
state level. The integrated output (‘area-under-the-
curve’) is defined as:
IðtÞ¼
Z
t
t¼0
xðsÞÁds:
We consider the same transformation as in Eqns (3)
and (4) and note that:
I
e
i
k
i
; k Á t
¼
Z
s¼kÁt
s¼0
x
e
i
k
i
; k Á s
:ds ¼
Z
s¼kÁt
s¼0
xe
i
; sðÞÁds
¼ k Á
Z
z¼t
s¼0
xe
i
; sðÞÁdz ¼ k Á Ie
i
; tðÞ:
Application of Euler’s theorem gives:
X
n
i¼1
C
IðtÞ
i
À C
IðtÞ
t
¼À1:
If the signal integral converges for long times, this yields
for the total integral signal strength at infinite time:
X
n
i¼1
C
Ið1Þ
i
¼À1:
In many cases the signal intensity does not drop to
zero but attains a steady state level different from zero.
Then the above integral does not converge; the area-
under-the-curve continues to increase with time. In
these cases, the area-under-the-curve should be evalu-
ated up to the point where the curve drops below a
certain value. If at that point in time the time deriv-
ative is small, then the simpler form of the law is
retained. We now consider the time t it takes for the
concentration to attain a certain value
y þ
x
0
. This
time is given implicitly by the equation:
0 ¼
Z
s¼t
s¼0
X
n
i¼1
n
ji
Á e
i
Á v
i
ð
xÞÁds À y
j
:
We now consider the transformation where all
enzymes are activated. The time t¢ at which the con-
centration reaches the same magnitude is then found
by solving the equation:
0 ¼
Z
s¼t
0
s¼0
X
n
i¼1
n
ji
Á e
i
Á k
i
Á v
i
ð
xÞÁds À y
j
:
J. J. Hornberg et al. How kinases and phosphatases control signaling
FEBS Journal 272 (2005) 244–258 ª 2004 FEBS 257
Again, writing z for sÆk
i
and taking all k
i
terms as
equal, this becomes:
0 ¼
Z
z¼k Át
0
t¼0
X
n
i¼1
n
ji
Á e
i
Á v
i
ð
xÞÁdz À y
j
which proves that:
k Á t
0
¼ k Á t k Á e
i
ðÞ¼te
i
ðÞ
i.e. the time at which a certain concentration is
attained is a homogeneous function of time of the
order )1 of the enzyme activities. Hence:
X
n
i¼1
C
s
i
¼À1
where s is the time it takes for the signal to reach a
certain magnitude given a certain local dynamic envi-
ronment (this condition is added to accommodate the
fact that the time needed to attain a certain signal
magnitude may not be unique, e.g. because a signal
increases and then decreases).
How kinases and phosphatases control signaling J. J. Hornberg et al.
258 FEBS Journal 272 (2005) 244–258 ª 2004 FEBS