Báo cáo khoa học: Transcriptional responses to glucose at different glycolytic rates in Saccharomyces cerevisiae ppt
Bạn đang xem bản rút gọn của tài liệu. Xem và tải ngay bản đầy đủ của tài liệu tại đây (403.37 KB, 10 trang )
Transcriptional responses to glucose at different glycolytic rates
in
Saccharomyces cerevisiae
Karin Elbing
1
, Anders Sta
˚
hlberg
1
, Stefan Hohmann
2
and Lena Gustafsson
1
1
Department of Chemistry and Bioscience-Molecular Biotechnology, Chalmers University of Technology, Go
¨
teborg, Sweden;
2
Department of Cell and Molecular Biology-Microbiology, Go
¨
teborg University, Go
¨
teborg, Sweden
The addition of glucose to Saccharomyces cerev isiae cells
causes reprogramming of gene expression. Glucose is sensed
by membrane receptors as well as (so far elusive) intracellular
sensing mechanisms. T he availability of four yeast s trains
that display d ifferent hexose uptake capacities allowed us to
study glucose-induced effects at different glycolytic rates.
Rapid glucose responses were observed i n all strains able to
take up glucose, consistent with intracellular sensing. The
degree of long-term responses, however, clearly correlated
with the glycolytic rate: glucose-stimulated expression of
genes e ncoding enzymes o f the lower part of glycolysis
showed an almost linear correlation with the glycolytic rate,
while expression levels of genes encoding gluconeogenic
enzymes and invertase (SUC2) showed an inverse correla-
tion. Glucose control of SUC2 expression is mediated by the
Snf1-Mig1 pathway. Mig1 dephosphorylation upon glucose
addition is known to lead to repression of target genes. Mig1
was initially dephosphorylated upon glucose addition in all
strains able t o take up glucose, but remained dephospho-
rylated only at high glycolytic rates. Remarkably, transient
Mig1-dephosphorylation was accompanied by t he repres-
sion of SUC2 expression at high glycolytic rates, but sti-
mulated SUC2 expression at low glycolytic rates. This
suggests that Mig1-mediated repression can be overruled by
factors mediating induction via a low glucose signal. A t low
and moderate glycolytic rates, Mig1 was partly dephos-
phorylated both in the presence of phosphorylated, active
Snf1, and unphosphorylated, inactive Snf1, indicating that
Mig1 was actively phosphorylated and dephosphorylated
simultaneously, suggesting independent control of both
processes. Taken together, it appears that glucose addition
affects t he expression of SUC2 as well as Mig1 activity by
both Snf1-dependent and -independent mechanisms that can
now be dissected and r esolved as e arly and l ate/sustained
responses.
Keywords: Saccharomyces cerevisiae; Mig1; Snf1;glucose
repression; glucose signal.
Addition of glucose to Saccharomyces cerev isiae cells
growing in the absence of glucose causes an extensive
reprogramming of gene expression and metabolism. These
changes affect c hromatin s tructure, t ranscription, mRNA
stability, translation and post-translational modifications
[1–4]. A range of d ifferent signalling p athways, including,
among others, the Snf1–Mig1 pathway, the Snf3–Rgt2
pathway and the Ras-cAMP pathway [5], are r esponsible
for these effects. Glucose sensing appears to occur at
different levels. While membrane-localized receptors (Gpr1,
Snf3, Rgt2) h ave been reported, other pathways appear to
be controlled by so far elusive intracellular signals and
sensors. In this work we focus on such effects previously
reported to probably be the result of intracellular sensing/
signalling. We have addressed the question of how signalling
and its output are affecte d by different glycolytic r ates at
identical extracellular conditions. Our data show that even
seemingly simple responses can b e dissected into different
components with potentially different underlying mecha-
nisms.
This study focused on the effects on mRNA levels of
different sets of genes. One such set are genes encoding
enzymes of glycolysis. While expression of genes encoding
enzymes operating in both glycolysis and gluconeo genesis
usually remain constitutive [6,7], expression of genes for
enzymes specific to the lower part of glycolysis is stimulated
upon glucose addition [8]. The underlying signalling pathway
is not understood. However, it has been reported that
stimulated expression requires glucose metabolism through
the upper part of glycolysis [9]. On the other hand, expression
of genes encoding enzymes specific for gluconeogenesis,
respiration, or the uptake and utilization of alternative
carbon sources, is efficiently repressed b y glucose [4].
Glucose repression is a c omplex p rocess involving differ-
ent regulators affecting different subsets of genes. Best
studied is the Snf1–Mig1 pathway, which is involved in the
(de)repression of genes encoding enzymes needed for the
utilization of alternative carbon sources as well as for
gluconeogenesis and respiration. The p rotein kinase Snf1 is
activated by phosphorylation a t low/no glucose [10].
Recently, three protein kinases – Elm1, Tos3 and Pak1
[11–13] – were identified that seem to mediate Snf1
activation. It is unclear how these kinases are c ontrolled,
Correspondence to K. Elbing, Department of Chemistry and
Bioscience-Molecular Biotechnology, Chalmers University of
Technology, PO Box 462, 405 30 Go
¨
teborg, Sweden.
Fax: +46 31 773 25 99, Tel.: +46 31 773 25 81,
E-mail:
Abbreviations:DAPI,4¢,6-diamidino-2-phenylindole dihydro-
chloride; HA, haemagglutinin; QPCR, quantitative PCR.
(Received 6 August 2004, revised 21 October 2004,
accepted 22 October 2004)
Eur. J. Biochem. 271, 4855–4864 (2004) Ó FEBS 2004 doi:10.1111/j.1432-1033.2004.04451.x
but it appears that the hexokinases, Hxk1 and Hxk2, may
play some role in this process [14–17]. In addition, a
decreased Glc7 phosphatase activity may also contribute to
Snf1 activation, as has been s hown by deletion s tudies of
REG1 by Treitel et al. and McCartney et al. [ 10,18]. Also,
protein interactions, as well as carbon source-dependent
phosphorylation of Reg1, may effect Reg1/Glc7 activity
[19,20]. An active Snf1 phosphorylates at least four sites in
the transcriptional rep ressor Mig1. M ig1 phosphorylation
causes the majority of t he protein to exit the nucleus [21].
Recent data, however, suggests t hat phosphorylation-medi-
ated altered interaction with the two co-repressors Cyc8
(Ssn6) and Tup1 on target promoters i s the primary cause
for the switch between repression and derepression [22].
Time-course analyses suggested that the process of
glucose repression consists of a short- and a long-term
response (minutes and hours, respectively) [23,24]. Those
could be d istinguished on the basis of their different
requirements f or sugar kinases, suggesting different signal-
ling pathways. While long-term glucose repression required
Hxk2, for short-term repression any of the three sugar
kinases, Hxk1, Hxk 2 or Glk1, was sufficient [23,24]. It
should be noted that Hxk2 does not have a unique role in
glucose repression, as often c laimed in the literature, but
that Hxk1 also contributes to glucose and, in particular, to
fructose repression [24].
Earlier studies showed a correlation between glucose
consumption rate and glucose repression [25–27]. Our
previously reported series o f strains, in which sugar
uptake is mediated by the individual expression of
different native and chimeric hexose transporters [28,29],
display a wide spectrum of glucose uptake rates. These
strains a re therefore useful for investigating the effects of
different glycolytic rates on glucose-induced signalling
pathways. For this study we have chosen four strains,
which represents t he full range o f glycolytic r ates: a wild-
type, with a high glycolytic rate; a HXT-null strain, which
does not take up glucose owing to the d eletion of all
known hexose transporter (HXT) genes; a strain expres-
sing Hxt7 as the sole s ugar transporter, which displays
relatively high sugar uptake rates; and a strain that
expresses Hxt-Tm6*, a chimera of Hxt1 and Hxt7. Hxt-
Tm6* mediates low uptake rates and, for that reason, the
strain does not produce ethanol also in the presence of
high external sugar levels [28,29].
Materials and methods
Strains
The strains u sed are liste d in Table 1 and all derive from
CEN.PK2-1C MATa leu2-3 122 ura3-52 trp1-289 his3-D
MAL2-8
c
SUC2 hxt12D [30]. KOY.PK2-1C83 (wild-type)
is the prototrophic version of the CEN.PK2-1C s train [28].
In KO Y.VW100P (HXT-null), all known hexose transport-
ers have been deleted and an expression cassette h as been
introduced in the HXT3-6-7 locus [28]. KOY.HXT7P
(HXT7)andKOY.TM6*P(HXT-TM6*) have HXT7 and
the chimera HXT-TM6*, respectively, cloned into this
expression cassette [28,29].
Plasmid pRS316 carrying either SNF1 [10] or MIG1
[31] tagged with the haemagglutinin (HA) epitope at the
C-termini w as transformed into the KOY.PK2-1C82,
KOY.HXT7, KOY.TM6* and KOY.VW100 strains,
which are isogenic to the strains listed above e xcept that
they contain the ura3-52 marker. The resulting transform-
ants are h ence prototrophic. For Mig1-GFP localization,
plasmid BM3315 [21] was transformed into the s ame
strains.
Cultures
Cells were precultured at 30 °Cfor48hin50mLof
complete minimal medium [32], supplemented with 1%
(v/v) ethanol. Fermentors containing 1.5 L of minimal
medium (5· concentrated) were inoculated to an attenuance
(D), at 610 nm, of 0.05. Conditions were maintained
constant at 30 °C, 1500 r.p.m. and pH 5.0. Off gas was
maintained at 0.75 LÆmin
)1
by using a mass flow regulator.
Gas was passed through a condenser to avoid evaporation.
Carbon dioxide production and oxygen consumption were
measured on-line (type 1308; Bruel and Kjaeer, Naerum,
Denmark). At a D
610
of 1 to 1.5, glucose was added to a
final c oncentration of 5% and samples were taken at 1, 5,
10, 15, 20, 30 and 60 min as well as at residual glucose
concentrations of 1.5–2.5%. For the HXT-null st rain,
samples were taken in the ethanol consumption phase
following glucose addition.
Biochemical determinations and consumption rates
Glucose and ethanol were measured in the s upernatant
(1 min at 16 060 g) using enzymatic combination kits
(Roche). Several samples were taken during logarithmic
growth on glucose, and t he specific glucose consumption
rate was determined at a specific time-point.
Quantitative PCR (QPCR)
Samples for RNA extraction were taken into ice-cold water.
RNA was extracted, treated with DNase, and c hecked for
purity by agarose-gel electrophoresis. Samples were pre-
pared [28] and normalized against the quotient between
the levels of the ACT1 and IPP1 mRNAs. The lowest value
for each gene was set to 1. The standard deviation of t he
QPCR is < 0.25 cycles and at least two independent
fermentations were performed. Duplicate samples from
each fermentation w ere analysed.
Protein extracts and Western blot analysis
Cells were harvested and proteins extracted as described in
McCartney et al. [10]. For the detection of Mig1-HA,
samples were separated by PAGE on 7.5% (w/v) SDS gels
and blotted onto nitrocellulose membranes. Membranes
were blocked at room temperature for 1 h in TTBS [TBS
containing 0.1% (v/v) Tween-20] containing 3% (w/v) BSA,
washed three t imes (5 min each wash) in TTBS, incubated
at 4 °C f or 3 h with HA mAb (1 : 1000) (Amersham) i n
TTBS containing 3% (w/v) BSA, washed three times (5 min
each wash) in TTBS, and incubated for 1 h at room
temperature with secondary anti-mouse immunoglobulin
(1 : 5000 dilution) in TTBS containing 3% (w/v) BSA. The
membrane was washed three times ( 5 min each wash) in
4856 K. Elbing et al. (Eur. J. Biochem. 271) Ó FEBS 2004
TTBS prior to detection by chemiluminescence using
ELC plus (Amersham). Snf1-HA samples were dialysed
against buffer overnight [150 m
M
NaCl, 1% (v/v) Triton
X-100, 0.5% (w/v) deoxycholate, 50 m
M
Tris/HCl, pH 8.00,
supplemented with 50 m
M
sodium fluoride and 5 m
M
sodium pyrophosphate], and 400 mg of total protein was
used for immunoprecipitation of Snf1-HA [10]. The preci-
pitate was dissolved in SDS sample buffer, separated by
PAGE on a 7.5% (w/v) SDS gel, blotted onto nitrocellulose
membrane and phospho-Snf1 was detected by using the
a-PT210 antibody, as described by McCartney et al.[10].
As a c ontrol for equal loading, membranes were stripped
and the HA epitope on Snf1 was detected by a monoclonal
anti-HA immunoglobulin, as described above.
Phosphatase treatment
For phosphatase treatment of Mig1, 50 lg of total protein
extract was precipitated with 10% (w/v) trichloroacetic acid
and sedimented for 30 min at 4 °C. The sediments were
washed twice w ith ice-cold 100% acetone for 15 min and
centrifuged for 15 min between each wash, air-dried,
resuspended in 82 lLofH
2
O containing 10 lLof10·
phosphatase buffer and 8 U calf intestine alkaline phospha-
tase (Roche), and incubated a t 37 °C for 1 h. Samples were
again precipitated with trichloroacetic acid, resuspended i n
SDS sample buffer, boiled for 5 min and electrophoresed.
Gels were blotted and proteins detected, as described above
(in Western blot analysis), for M ig1-HA detection.
Determination of invertase activity
Cells were grown in Erlenmeyer flasks containing 2·
minimal medium [32] supplemented w ith 5% ( w/v) glucose
to a D
610
of 1, then harvested by centrifugation. P rotein
extracts and m easurements of invertase activity were
performed as described previously [33].
Microscopy
Localization of Mig1-GFP was visu alized by using a
GFP filter on a Leica DMRXA microscope. DNA was
stained by 4
0
,6-diamidino-2-phenylindole dihydrochloride
(DAPI) (1 lgÆmL
)1
)for10minat30°Cafterwhichthe
cells were quickly washed three times in growth media.
Results
Four strains displaying different glycolytic rates
The wild-type, HXT7 and HXT-TM6* strains display
high (15.8 mmol g
)1
Æh
)1
), intermediate (10.7 mmol
g
)1
Æh
)1
)andlow(3.5mmolg
)1
Æh
)1
) g lucose consumption
rates, respectively [28,29]. The HXT-null strain neither
takes up glucose nor grows with glucose as the sole
carbon source [34] (Fig. 1). In order to follow glucose-
induced responses, the yeast strains were grown in the
presence of 1% (v/v) ethanol to a D
610
of 1, pulsed w ith
glucose to a final concentration of 5 %, and sampled over
a period of 1 h as well as in the subsequent glucose
consumption phase (Fig. 1). After the glucose pulse, the
wild-type and HXT7 strains displayed a clear biphasic
growth with an initial respiro-fermentative phase where
ethanol was produced (Fig. 1) a nd a subsequent respirat-
ory phase where this ethanol was then consumed (data
not shown). In the HXT-TM6* strain, glucose is only
respired, as described previously [28,29]. Following glucose
addition the HXT-TM6* strain initially consumed glucose
Table 1. Saccharomyces cerevisiae strains.
Strain Genotype Source or reference
KOY.PK2-1C83 (wild-type) MATa MAL2-8
c
SUC2 Prototrophic [28]
KOY.PK2-1C82 MATa MAL2-8
c
SUC2 ura 3-52 Auxotrophic: this study
KOY.VW100P
(HXT-null)
MATa MAL2-8
c
SUC2 hxt17D ura3-52 gal2 D
::loxP stl1 D::loxP agt1 D::loxP ydl247w D::loxP
yjr160c D::loxP hxt13 D::loxP hxt15 D::loxP
hxt16 D::loxP hxt14 D::loxP hxt12 D::loxP hxt9 D
::loxP hxt11 D::loxP hxt10 D::loxP hxt8 D::loxP
hxt514 D::loxP hxt2 D::loxP hxt367 D::loxP
Prototrophic [28]
Integration cassette at former HXT367 site
containing the truncated, constitutive promoter of
HXT7 [46], the KlURA3 open reading frame for
counter selection, and the HXT7 terminator
KOY.VW100 As KOY.VW100P but the KlURA3 in the integration
cassette has been replaced with the KanMX
Auxotrophic: this study
KOY.HXT7P
(HXT7)
KOY.VW100P Integration into the cassette:
HXT7prom-HXT7-HXT7term, ura3-52::URA3
Prototrophic [29]
KOY.TM6*P
(HXT-TM6*)
KOY.VW100P Integration into the cassette:
HXT7prom-TM6*-HXT7term, ura3-52::URA3
Prototrophic [28]
KOY.HXT7 KOY.VW100P Integration into the cassette:
HXT7prom-HXT7-HXT7term, ura3-52
Auxotrophic: this study
KOY.TM6* KOY.VW100P Integration into the cassette:
HXT7prom-TM6*-HXT7term, ura3-52
Auxotrophic: this study
Ó FEBS 2004 Glucose response in S. cerevisiae (Eur. J. Biochem. 271) 4857
and e thanol simultaneously, a nd once ethanol was deple-
ted it continued to catabolize g lucose (Fig. 1). The HXT-
null strain continued consuming ethanol, leaving glucose
unconsumed.
Short-term response to glucose addition
Using QPCR we monitored the response to glucose of four
glucose-induced genes encoding enzymes of the lower part
of glycolysis (TPI1, PGK1, PDC1 and ADH1), of three
glucose-repressed genes encoding enzymes in gluconeogen-
esis and the glyoxylate cycle (FBP1, MDH2, ADH2), as well
as of the glucose-repressed SUC2 (invertase) gene. In wild-
type cells, expression of all four glycolytic genes was
strongly stimulated by glucose, reaching a plateau after
about 30 min ( Fig. 2). Expression of t hese genes was not
stimulated at all in the HXT-null strain, o r rather diminished
inthecaseofPGK1 and TPI1. The strains expressing
Hxt7 and Hxt-TM6* as sole hexose transporter showed
intermediate levels of stimulation, which differed in a
gene-specific manner (Fig. 2). Generally, it appeared that
the degree of induction correlated approximately with the
glycolytic rate (measured as the glucose consumption rate)
of the strains.
The mRNA level of the gluconeogenic and glyoxylate
cycle genes, FBP1, ADH2 and MDH2, was rapidly
diminished following glucose addition in all strains able to
take up glucose. In the HXT-null strain, the mRNA of all
these g enes transiently increased and the n e ither plateaued
or decreased.
The expression level of SUC2 diminished in the wild-type
yeast and in the strain e xpressing HXT7, w hile it did not
respond to glucose addition in the HXT-null strain. In the
HXT-TM6* strain, expression of SUC2 was transiently
stimulated.
Long-term glucose response
In order to study the long-term glucose response, samples
from cells growing exponentially with glucose w ere t aken
when 1.5–2.5% of glucos e was still pres ent in the culture
medium (indicated in Fig. 1). For th e HXT-null strain,
samples were taken 5–8 h after g lucose addition when the
strain was still consuming ethanol.
For the glucose-induced glycolytic genes TPI1, PGK1,
PDC1 and ADH1, the long-term expression level showed an
approximately linear correlation with the glycolytic rate,
especially for PGK1 and PDC1 genes (Fig. 3). In the HXT-
null strain, expression levels of TPI1, PDC1 an d ADH1 did
not differ from those of cells growing in the presence of
ethanol only, while the mRNA level of PGK1 was threefold
lower. Expression of the gluconeogenic genes FBP1 and
MDH2 was strongly repressed by 5% glucose in the wild-
type an d HXT7 strains and repressed to a lower extent i n the
HXT-TM6* strain (Table 2). Expression of FBP1 and
MDH2 was unaffected by glucose in the HXT-null strain.
Expression of ADH2 was strongly repressed i mmediately
after glucose addition and remained repressed in the wild-
type and HXT7 strains. In the HXT-TM6* strain, however,
ADH2 remained repressed during the phase of glucose/
ethanol co-consumption (data not shown), but when
ethanol was depleted and the strain only consumed glucose,
ADH2 became fully derepressed (Table 2). The reason for
this behaviour is unclear. Expression of SUC2 was repressed
twofold in the wild-type yeast, slightly increased in the
HXT7 strainandstimulatedfourfoldintheHXT-TM6*
strain during growth on g lucose. In the HXT-null strain,
expression of SUC2 did not seem to respond to glucose
(Table 2). I n agreement with mRNA levels, invertase
activity measurements with glucose-grown cells showed
increased activity in the HXT7 and HXT-TM6*strains,
while activity remained at a low level in the wild-typ e yeast.
The HXT-null strain, which was grown on ethanol supple-
mented with 5% glucose, displayed an intermediate level of
activity (Fig. 4).
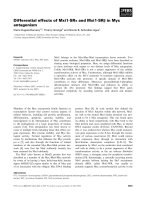
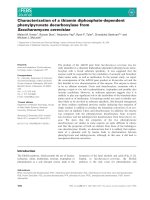
Fig. 1. Cu ltu re profiles. Measurements of glucose (gÆL
)1
)(r), ethanol
(gÆL
)1
)(h) and attenuance (D
610
)(m) for the wild-type, HXT7, HXT-
TM6*andHXT-null strains following glucose a ddition at 0 h to cells
grown on ethanol. The bracket indicates samples taken during the first
60 min after glucose ad dition, and the arro ws specify t he time-points
for sampling during growth on glucose.
4858 K. Elbing et al. (Eur. J. Biochem. 271) Ó FEBS 2004
Snf1 and Mig1 phosphorylation in the wild-type yeast,
and in
HXT7
,
HXT-TM6*
and
HXT-Null
strains
Because of the interesting expression pattern of SUC2,we
investigated the state of the glucose repression signalling
pathway by monitoring the phosphorylation patterns of
Mig1 and Snf1. Snf1 is activated by phosphorylation at low/
no glucose [10,35], and phosphorylation on the critical T210
residue can be monitored by using a specific antibody [10].
Active Snf1 phosphorylates the repressor Mig1 on multiple
sites, lead ing t o d erepression of target genes, such as SUC2
[18,36,37]. Mig1 phosphorylation can be visualized as a
mobility shift by using HA-tagged Mig1 and immunoblot-
ting.
The short-term response was studied by monitoring the
electrophoretic migration of Mig1 following the addition of
glucose t o e thanol-grown cells (the same conditions as in
Figs 1 and 2). In ethanol-grown cells, M ig1 appeared as a
ladder of bands (Fig. 5A), indicating that the protein was
phosphorylated to a different extent and was partially
inactive as a repressor. Interestingly, Mig1 from cells
growing in the presence of 0.05% glucose migrated as a
single slow band, indicating that under these conditions
Mig1 is fully phosphorylated and inactive. This fits with the
observation that SUC2 expression is much higher in cells
growing in the presence of low glucose levels than in ethanol
medium ([38], o wn unpublished data). Mig1 from cells
growing with 5% g lucose, on t he other hand, migrated as a
single fast band of fully dephosphorylated and hence
actively repressing Mig1 (Fig. 5 A, see also Fig. 6 ).
Interestingly, in all glucose-utilizing strains, the addition
of glucose to ethanol-grown cells caused a c ollapse of the
Mig1 ladder to the unph osphorylated (actively repressing)
form. Only in the HXT-null strain was the band pattern
largely unaltered. W hile Mig1 remained unphosphorylated
in the wild-type yeast throughout the time course of the
experiment, it appeared to be rephosphorylated in the
HXT7 and HXT-TM6* strain towards the end of the time
course.
As it appeared that the level of Mig1 increased during the
time course of the experiment, we performed QPCR
analysis of MIG1 gene expression (Fig. 5B). Indeed,
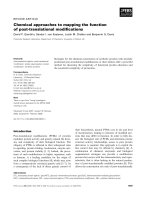
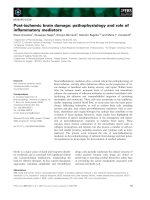
Fig. 2. Gene expression analysis and quantitative PCR (QPCR) analysis. Diagram of central metabolism to indicate the position of t he relevant
enzymes in metabolism. mRNA levels were determined for TPI1, PGK1, PDC1, ADH1, FBP1, MDH2, ADH2 and SUC2 for the wild-type (j),
HXT7 (h), HXT-TM6*(m)andHXT-null (s) strains. Cells were grown in 1% ethanol, glucose was added at 0 h to a final concentration of 5%
and samples were t aken during t he first hour after glucose addition. O ne representative result is shown.
Ó FEBS 2004 Glucose response in S. cerevisiae (Eur. J. Biochem. 271) 4859
expression of MIG1 was stimulated upon glucose addition,
in accordance with recently published data [39]. Stimulation
of expression inversely correlated with the glycolytic rate
and, interestingly, was apparent even in the HXT-null strain.
To monitor the long-term glucose response, the four
strains were grown in the presence of a high (5%)
concentration of g lucose to a D
610
of 1.0. A sample was
shifted to a low (0.05%) concentration of glucose as a
control, and the phosphorylation state of Snf1 and the
mobility pattern of Mig1 were analysed (Fig. 6). Mig1 from
wild-type cells migrated as the a pparently fully phosphor-
ylated form on the low concentration of glucose and as the
dephosphorylated form on the high concentration of
glucose (Fig. 6A). Migration of this latter band did not
change upon treatment with alkaline phosphatase, confirm-
ing that it represents the fully dephosphorylated form
(Fig. 6C). Snf1 was largely unphosphorylated in wild-type
cells growing in a high concentration of glucose, while the
level of phosphorylated Snf1 was increased in cells shifted to
a low concentration of glucose. In the HXT-null strain,
Mig1 migrated at an intermediate rate (high glucose) or as a
diffuse ladder ( low glucose), and Snf1 was phosphorylated
under both conditions. In the HXT7-expressing strain, Snf1
was (as in the wild-type) unphosphorylated when grown on
a high concentration of glucose, whereas Mig1 was partially
phosphorylated (Fig. 6A,B), as also illustrated by the fact
that the Mig1-band migrated more quicly after phosphatase
treatment (Fig. 6C). In the HXT-TM6* strain, Snf1 was
strongly phosphorylated in cells growing in conditions of
both high and low glucose, consistent with a fully glucose-
derepressed s tate o f the cell. Interestingly, it appeared that
Mig1 assumed an intermediate level of phosphorylation in
the HXT-TM6* strain on high glucose (Fig. 6A,B). When
comparing the three strains able to take up glucose, it
appeared that the phosphorylation of Mig1 correlated well
with the glycolytic rate, wh ereas Snf1 pho sphorylation did
not (Fig. 6A,6B).
A good correlation was also seen of the glycolytic rate,
apparent phosphorylation state of Mig1, and its subcellular
localization. Dephosphorylated Mig1, for example i n glu-
cose-grown wild-type cells, has been reported to concentrate
in the nucleus, and this was also observed i n the present
study (Fig. 7). Mig1 from HXT7-expressing cells showed
increased nuclear localization, although not as strongly as in
the wild-type. In HXT-TM6*, as well as in HXT-null cells,
Mig1 was localized diffusely throughout the c ell after the
glucose pulse. I n the latter two strains, DAPI staining did
not clearly reveal the nucleus owing to a high abundance o f
mitochondria, which is consistent with the respiratory
metabolism of these strains.
Discussion
In this study we have used yeast strains with a very broad
range of glycolytic rates to study glucose-induced responses
while maintaining identical growth conditions as well as
high external glucose concentrations.
The results confirm previous reports in that the signalling
pathways studied here are triggered inside the c ell rather
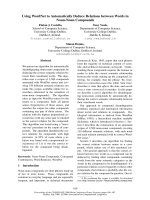
Fig. 3. Correlation of expression levels and glucose consumption rates.
Plot of the relative fold change of the TPI1, PGK1, PDC1 and ADH1
genes in the wild-type , HXT7, HXT-TM6*andHXT-null strains
during glucose growth as compared to ethanol growth vs. the glucose
consumption rate. The names of th e strains are indicated above t he
graph to show which strain displayed which glucose consumption rate.
Error bars sho w standard deviation of the relative fold change from
four independent measurements.
Table 2. Fold changes during 5% glucose growth as compared to
ethanol growth for glucose-repressed genes. Significantly repressed genes
are indicated in bold italic; significantly induced genes are shown in
bold. Data for the wild-type (WT) an d TM6* strains were previously
published in Otterstedt et a l.[28].
Gene WT HXT7 HXT-TM6* HXT-null
FBP1 )63 )71 )13 )1.5
MDH2 )120 )77 )7.9 )1.3
ADH2 )105 )120 )1.0 )2.0
SUC2 )2.2 1.5 3.5 1.3
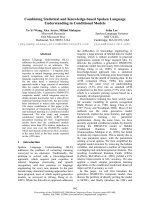
Fig. 4. Relationship between invertase activity and glucose consumption
rate. Plo t of specific invertase activity of the wild-type, HXT7, HXT-
TM6*andtheHXT-null strai ns during growth on 5% glucose vs.
glucose consumption rate. Error bars show t he standard deviation of
invertase activity from at least three independent measurements.
4860 K. Elbing et al. (Eur. J. Biochem. 271) Ó FEBS 2004
than by plasma membrane-localized receptors. This was
first illustrate d by the fact that the HXT-null strain, which
does not take up glucose, also does not respond to glucose
addition. We only observed t wo potentially relevant devi-
ations: expression levels of gluconeogenic genes transiently
increased upon glucose addition to the HXT-null strain, and
the expression l evel of MIG1 was moderately stimulated.
These effects could be caused either by minute amounts of
glucose diffusing into cells of the HXT-null strain or to
signalling pathways sensing external glucose, such as the
Gpr1-PKA pathway. That signalling is t riggered inside the
cells is further indicated by the fact that different glucose
consumption, and h ence glycolytic rates, caused a different
signalling output. The actual signal(s) and sensing mecha-
nisms still remain to be identified, but strains like those used
here will certainly be useful in such studies.
We observed an a lmost perfect correlation between the
apparent glycolytic rate and t he degree of induction of
glycolytic gene expression. This is consistent with previous
chemostat studies of the CEN.PK strain cultured at
different glycolytic rates within the respiro-fermentative
phase, i.e. high dilution rates [40]. Interestingly, a ll glu cose-
consuming strains responded equally quickly to glucose
addition and the difference was manifested as different
amplitudes of expression. This suggests that the – so far
elusive – sensing mechanism somehow monitors quantita-
tive differences of the glycolytic rate.
Similarly, expression of gluconeogenic genes was
repressed in all three glucose-consuming strains equally
quickly. Hence, consistent with previous studies, repression
of these genes is very sensitive to glucose [41]. However,
gluconeogenic genes were repressed to a much lesser extent
in HXT-TM6* cells growing in the presence of high glucose
levels, suggesting t he inte resting s cenario that HXT-TM6*
cells co-express glycolytic and gluconeogenic enzymes.
Potential futile cycling is n ot likely as a higher biomass is
obtained in the HXT-TM6* strain as compared to wild-type
yeast [28]. Moreover, the alcohol dehydrogenases seem to be
regulated in an interesting way in this strain. Expression of
ADH2, which encodes the glucose-repressed alcohol dehy-
drogenase responsible for ethanol consumption, was
strongly repressed in HXT-TM6* cells during glucose/
ethanol co-consumption. It is possible, that the enzyme
encoded by the glycolytic ADH1, whose expre ssion w as
stimulated fourfold under these conditions (data not shown)
takes over the role of Adh2. Once ethanol was depleted and
the strain grew solely on glucose, ADH2 expression was
again derepressed to the same level as before glucose
addition. The glycolytic rate was identical during glucose
consumption and glucose/ethanol co-consumption in the
HXT-TM6* cells (data not shown).
The expression of SUC2, a classical model for a glucose-
regulated gene , appeared particularly interesting, as it
showed very different responses in the f our strains.
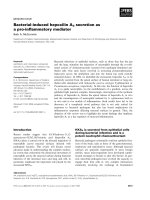
Fig. 5. Mig1 gel mobility pattern in response t o glucose addition. Glu-
cose was add ed at 0 h to a final concentration of 5%. (A) The phos-
phorylation level of Mig1 was estimated as a band-shift. Samples
(30 lg) from wild-type cells grown at high (5%) or low (0.05%)
concetrations of glucose were loaded as a comparison. Slow migration
indicates fully phosphorylated and fast migration fully dephosph or-
ylated Mig1 (see Fig. 6B for phosphatase-treated controls). A total of
60 lg o f extract was l oaded for wild-type, HXT7, HX T-TM6*and
HXT-null strains. (B) mRNA expression of Mig1 during the first hour
after glucose addition, as determined by quantitative P CR (QPCR).
Wild-type (j), HXT7 (h), HXT-TM6*(m), HXT-null strains (s).
Fig. 6. Mig1 and Snf1 phosphorylation in glucose-growing cells. Strains
were grown in 5% glucose (H) and shifted to 0.05% glucose (L) for
2h.TheHXT-null strain was grown in 1% ethanol supplemented with
5% glu cose ( H) and shifted to 0.05% glucose (L) for 2 h. (A) The
migration pattern of Mig1. A t otal of 60 lgofextractwasloadedin
each lane. (B) Detection of phosphorylated Snf1 by using an antibody
specific for Snf1 phosphorylated at T210. The haemagglutinin (HA)
signalwasusedasaloadingcontrol.(C)Treatmentofextractswith
alkaline phosphatase as a control for the Mig1 phosphorylation state.
A total of 50 lg of total protein from the wild-type, HXT7 and HXT-
TM6* strains were incubated with and without calf intestine alkaline
phosphatase (AP). Un treated wild-type samples were loaded as
migration comparisons.
Ó FEBS 2004 Glucose response in S. cerevisiae (Eur. J. Biochem. 271) 4861
Employing strains expressing different hexose transporters
or a given transporter a t different levels, it has previously
been observed that there is a goo d correlation between the
apparent glycolytic rate and the degree of long-term glucose
repression [42–44]. This is confirmed here, although the
picture is complicated by the fact that expression of SUC2 is
stimulated by low glucose levels ([38], own data). Stimulated
SUC2 expression upon glucose ad dition in the HXT-TM6*
strain illustrates that the glucose repression signalling system
perceives a Ôlow glucoseÕ signal, despite the fact that the
external gluco se level is high. The derepressed state of this
strain is confirmed by a high level of phosphorylation o f
Snf1. In order to achieve complete glucose repression, the
wild-type glycolytic rate seems to be required because even
the HXT7 strain, which displayed two-thirds of the wild-
type rate, did not fully repress SUC2 expression.
Expression of SUC2 and gluconeogenic genes is con-
trolled by the Snf1 kinase and th e Mig1 repressor.
Gluconeogenic genes are also controlled by the Sn f1-
dependent Cat8 and Sip4 a ctivators. Monitoring Snf1 and
Mig1 phosphorylation revealed some unexpected observa-
tions that will require further investigation. Perhaps most
perplexing is the observation that Mig1 becomes rapidly
dephosphorylated upon glucose addition in the HXT-TM6*
strain while, at the same time, the expression level of SUC2
strongly increases. This is in clear contradiction to the
current view that dephosphorylated, nuclear Mig1 represses
SUC2 expression. This observation suggests that the system
which mediates induction of SUC2 at a low glycolytic rate is
able to overcome Mig1-mediated r epression. Another
surprising observation concerns the only partial phosphory-
lation of Mig1 in the HXT-TM6* strain growing at high
glucose levels, despite the fact that Snf1 is strongly
phosphorylated. Partial phosphorylation of Mig1 is also
seen in the HXT7 strain at high glucose, even though Snf1 is
unphosphorylated. T his i s n ot caused by the strain being
unable to dephosphorylate Mig1, as this species is observed
transiently upon glucose addition. This observation sug-
gests that the phosphorylation state of Mig1 is not
only controlled by Snf1-dependent phosphorylation but,
obviously, also by dephosphorylation, which is mediated by
the Glc7-Reg1 system [18]. If indeed the observed Mig1
phosphorylation pattern is caused by simultaneous phos-
phorylation/dephosphorylation, these two processes might
be controlled by different signallin g mechanisms. The fact
that one distinct Mig1 band is observed under these
conditions further suggests that certain phosphorylation
sites are used preferentially, which will be tested in the
future. The interplay between th e t wo processes apparently
allows fine-tuning of the M ig1 phosphorylation level. An
almost linear correlation between Mig1 activity and sites
phosphorylated by Snf1 has been observed [21]. Future
work, for which the strains u sed here w ill be instrumental,
will address t he precise m echanisms controlling Mig1
activity and their interplay with the factor(s) m ediating
induction by low glucose.
It has previously been proposed that the establishment of
glucose repression can be dissected into a short-term and a
long-term response. That proposal was based on d ifferent
roles of the sugar kinases: the hxk2D mutant displayed
short-term glucose r epression but was unable t o maintain
repression [24]. In a similar way, the HXT7 and HXT-TM6*
strains displayed short-term Mig1 dephosphorylation (sup-
posedly activating the repressor, although stimulated SUC2
expression was observed, see a bove) but subsequently Mig1
became rephosphorylated. Although unlikely, we cannot
exclude that in our experiment this biphasic behaviour is
caused by properties of the single hexose transporters
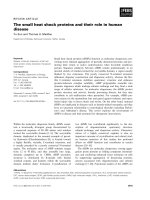
Fig. 7. Mig1-GFP localization in the wild-type,
HXT7 and HXT-TM6* strains growing on 5%
glucose and in the HXT-null strain grown on
1.5% ethanol supplemented with 5% glucose.
BF, bright field DAPI: staining with DAPI to
determine the location of the nucleus. In
HXT-TM6*andHXT-null cells the position
of the nucleus is difficult to determine owing to
the abundance of mitochondria.
4862 K. Elbing et al. (Eur. J. Biochem. 271) Ó FEBS 2004
expressed in these cells. Both Hxt7 and Hxt-TM6* are high-
affinity glucose transporters, which in wild-type cells are
active at low/no glucose and inactivated in medium
containing a h igh concentration of glucose [45]. H ence, it
may be that during adaptation to glucose, the levels of
active transporters diminish, although quantification of the
transporter mRNA of the chimeras shows identical expres-
sion during growth on ethanol and glucose (data not
shown). Ano ther interpretation for the biph asic behaviour
is, like in the hxk2D mutant, the initial, acute response and
the late s ustained response are governed by different
regulatory systems. In that scenario, the initial response
seems to be more sensitive to glucose, while the sustained
response would require higher glucose levels.
Acknowledgements
We ackn owledge Martin S chmidt and Arle Kruckeberg f or critical
reading of the manuscript. We thank Martin Schmidt for the Mig1-HA
and Snf1-HA plasmids and the Snf1 a-PT210 antibody. We also thank
Mark Johnston for the Mig1-GFP plasmid. This work was supported
by the European Commission ( contract BIO4-CT98-0562) a s well as
grants from the Swedish N ational Energy Administration (P1009-5),
the Swedish Council for Forestry and Agricultural Research (52.0609/
97) and Swedish Rese arch Council (621-2001-1988) to Lena Gustafs-
son. Stefan Hohmann holds a research position from t he Swed ish
Research Council.
References
1. Winderickx, J.G. & Taylor. P.M. (2004) Nutrient Induced
Responses in Eukaryotic Cells, 1st edn. Springer-Verlag,
Heidelberg.
2. Scheffler, I.E., de la Cruz, B.J. & Prieto, S.(1998)Control of mRNA
turnover as a m echanism of gluc ose repression in Saccharomyces
cerevisiae. Int. J. Biochem. Cell. Biol. 30, 1175–1193.
3. Sudarsanam,P.,Cao,Y.,Wu,L.,Laurent,B.C.&Winston,F.
(1999) The nucleosome remodeling complex, Snf/Swi, is r equired
for the maintenance of transcription in vivo and is partially
redundant with the histone acetyltransferase, Gcn5. EMBO J. 18,
3101–3106.
4. Gancedo, J.M. (1998) Yeast carbon catabolite r epressio n.
Microbiol. Mol. Biol. Rev. 62, 3 34–361.
5. Rolland, F., Winderickx, J. & Thevelein, J.M. (2002) Glucose-
sensing and -signalling mechanisms in yeast. FEM Yeast Res. 2,
183–201.
6. Chambers, A., Packham, E.A. & Graham, I.R. (1995) Control of
glycolytic gen e e xpressio n in the budding yeast (Saccharomyces
cerevisiae). Curr. Genet. 29, 1–9.
7. Nilsson, A., Norbeck, J., Oelz, R., Blomberg, A. & Gustafsson, L.
(2001) Fermentative capacity after cold storage of baker’s yeast is
dependent on the initial physiological state but not correlated to
the levels o f g lycolytic enzymes. Int. J. Fo od M ic robiol. 71,111–
124.
8. Moore,P.A.,Sagliocco,F.A.,Wood,R.M.&Brown,A.J.(1991)
Yeast glycolytic mRNAs are differentially regulated. Mol. Cell.
Biol. 11, 5330–5337.
9. Boles, E., Heinisch, J. & Zimmermann, F.K. (1993) Diffe rent
signals control the activation of glycolysis in the yeast Saccharo-
myces cerevisiae. Yeast 9, 761–770.
10. McCartney, R.R. & Schmidt, M.C. (2001) Regulation of S nf1
kinase. Activation requires phosphorylation of threonine 210 by
an upstream kinase as well as a distinct step mediated by the Snf4
subunit. J. Biol. Chem. 276, 36460–36466.
11. Hong, S.P., Leiper, F.C., Woods,A.,Carling,D.&Carlson,M.
(2003) Activation of yeast Snf1 and mammalian AMP-activated
protein kinase by upstream kinases. Proc. Natl Acad. Sci. USA
100, 8839–8843.
12. Nath, N., McCartney, R.R. & Schmidt, M.C. (2003) Yeast Pak1
kinase associates with and activates Snf1. Mol. Cell. Biol. 23,
3909–3917.
13. Sutherland, C .M., Hawley, S.A., Mc Cartney, R.R., L eech, A.,
Stark,M.J.,Schmidt,M.C.&Hardie,D.G.(2003)Elm1pisoneof
three upstream kinases for the Saccharomyces cerevisiae SNF1
complex . Curr. Biol. 13, 1299–1305.
14. Hohmann, S., Winderickx, J., de Win de, J.H., Valckx, D ., Cob-
baert, P., Luyten, K., de Meirsman,C.,Ramos,J.&Thevelein,
J.M. (1999) Nove l alleles of yeast h exokinase PII with distinct
effects on catalytic activity and catabolite repression of SUC2.
Microbiology 145, 703–714.
15. Kraakman, L.S., Winderickx, J., Thevelein, J.M. & De Winde,
J.H. (1999) Structure-function analysis of yeast hexokinase:
structural requirements for triggering cAMP signalling and cata-
bolite repression. Biochem. J. 343, 159–168.
16. Mayordomo, I. & Sanz, P. (2001) Hexokinase PII: structural
analysis and glucose signalling in the yeast Saccharomyces
cerevisiae. Yeast 18, 923–930.
17. Ahuatzi, D., Herrero, P., De La Cera, T. & Moreno, F. (2004) The
glucose regulated nuclear localization of hexokinase 2 in
Saccharomyce s c erevisia e is Mig1 dependent. J. Biol. Chem. 279,
14440–14446.
18. Treitel, M.A., Kuchin, S. & C arlson, M. (1998) Snf1 p rotein
kinase regulates phosphorylation of the Mig1 repressor in
Saccharomyces cerevisiae. Mol. Cell. Biol. 18, 6273–6280.
19. Dombek, K.M., Kacherovsky, N. & Young, E.T. (2004) The
Reg1-interacting proteins, Bmh1, Bm h2, Ssb1, and S sb2, have
roles in m aintaining glucose repression in Saccharomyces
cerevisiae. J. Biol. Chem. 279, 39165–39174.
20. Sanz, P., Alms, G.R., Haystead, T.A. & Carls on, M. (2000)
Regulatory interactions between the Reg1-Glc7 protein phos-
phatase and the Snf1 protein kinase. Mol. Cell. Biol. 20, 1321–
1328.
21. De Vit, M.J., W addle, J.A. & Johnston, M. (1997) Regulated
nuclear translocation of the Mig1 glucose repressor. Mol. Biol.
Cell 8, 1603–1618.
22. Papamichos-Chronakis, M., G ligoris, T. & Tzamarias, D. (2004)
The Snf1 kinase controls glucose repression in yeast by modulat-
ing interactions betwee n the Mig1 repressor and the C yc8-Tup1
co-repressor. EMBO Report 5, 368–372.
23. Sanz, P., Nieto, A. & Prieto, J.A. (1996) Glucose repression m ay
involve processes with different s ugar kinase requirements.
J. Bacteriol. 178, 4721–4723.
24. De Winde, J .H., Crauwels, M., Hohmann, S., Thevelein, J.M. &
Winderickx, J. (1996) Differential requirem ent of the yeast su gar
kinases for sugar sensing in estab lishing the catabolite-repressed
state. Eur. J. Bioc hem. 241, 633–643.
25. Herwig, C., Chetreanu, F., Niederberger, P., Marson, I. & van
Stockar, U. (2002) Quantitative analysis of t he impact of HXK2
and REG1 deletion in Saccharomyces cerevisiae on invertase
expression and respiration. Enzyme Microb. Te chnol. 31, 505–
515.
26. Ye L., Kruckeberg, A.L., Berden, J.A. & van Dam, K. (1999)
Growth and glucose repression are controlled by glu cose transport
in Saccharomyces cerevisiae cells containing only one glucose
transporter. J. Bacteriol. 18 1, 4673–4685.
27. Blank, L.M. & Sauer, O . (2004) TCA cycle activity in Saccharo-
myces cerevisiae is a function of environmentally determined
specific growth and glucose uptake r ates. Microbiology 150, 1085–
1093.
Ó FEBS 2004 Glucose response in S. cerevisiae (Eur. J. Biochem. 271) 4863
28. Otterstedt,K.,Larsson,C.,Bill,R.M.,Sta
˚
hlberg, A., Boles, E.,
Hohmann, S. & Gustafsson, L. (2004) Switching the mode of
metabolism in the yeast Saccharomyces cerevisiae. EMBO Report
5, 532–537.
29. Elbing, K., Larsson, C., Bill, R.M.,Albers,E.,Snoep,J.L.,Boles,
E., Hohmann, S. & Gustafsson, L. ( 2004) The role of hexose
transport in control of glycolytic flux in Saccharomyces cerevisiae.
Appl. Environ. Microbiol. 70, 5323–5330.
30. van Dijken, J.P., Bauer, J., Brambilla, L., Duboc, P., Francois,
J.M., Gancedo, C., Giuseppin, M.L., Heijnen, J.J., Hoare, M.,
Lange, H.C., Madden, E.A., Niederberger, P., Nielsen, J., Parrou,
J.L.,Petit,T.,Porro,D.,Reuss,M.,vanRiel,N.,Rizzi,M.,
Steensma, H.Y., Verrips, C.T ., Vindelov, J. & Pronk, J.T. (2000)
An interlaboratory c omparison o f physiological and genetic
properties of four Saccharomyces cerevisiae strai ns. Enzyme
Microb. Technol. 26, 706–714.
31. Schmidt, M.C. & McCartney, R .R. (2000) Beta-subunits of Snf1
kinase are required for kinase funct ion and substrate definition.
EMBO J. 19, 4936–4943.
32. Verduyn, C., Postma, E., Scheffers, W.A. & Van Di jken, J.P.
(1992) Effect of benzoic acid on metabolic fluxes in ye asts: a
continuous-culture study on the regulation of respiration and
alcoholic fermentation. Yeast 8, 501–517.
33. Goldstein, A. & Lampen, J.O. (1975) Beta-
D
-fructofuranoside
fructohydrolase from yeast. Methods Enzymol. 42, 504–511.
34. Wieczork e, R ., Krampe, S., Weierstall, T., Freidel, K., Hollen-
berg, C.P. & Boles, E. (1999) Concurrent knock-out of at least 20
transporter genes is required to block uptake of hexoses in Sac-
charomyces cerevisiae. FEBS Lett. 464, 123–128.
35. Wilson, W.A., Hawley, S.A. & Hardie, D.G. (1996) Glucose
repression/derepression in budding yeast: SNF1 protein kinase is
activated by phosphorylation under derepressing conditions, a nd
this correlates with a high AMP : ATP ratio. Curr. Biol. 6, 1426–
1434.
36. Ostling, J. & Ronne, H. (1998) Negative control of the Mig1p
repressor by Snf1p-dependent phosphorylation in the absenc e o f
glucose. Eur. J. Biochem. 252, 162–168.
37. Smith, F.C., Davies, S.P., Wilson, W.A., Carling, D. & Hardie,
D.G. (1999) The SNF1 kinase complex from Saccharomyces
cerevisiae phosphorylates the transcriptional repressor protein
Mig1p in vitro at four sites within or near regulatory domain 1.
FEBS Lett. 453, 219–223.
38. Ozcan, S., Vallier, L.G., Flick, J.S., Carlson, M. & Johnston, M .
(1997) Expression of the SUC2 gene of Saccharomyces cerevisiae is
induced by low levels of glucose. Yeast 13, 127–137.
39. Kaniak, A ., Xue, Z., Macool, D., Kim, J .H. & Johnston, M.
(2004) Regulatory network connecting two glucose signal trans-
duction pathways in Saccharomyces cerevisiae. Eukaryot. Cell 3,
221–231.
40. van Hoek, P., van Dijken, J.P. & Pronk, J.T. (2000) Regulation of
fermentative capacity an d levels of glycolytic enzym es in chemo-
stat cult ures o f Saccharomyces cerevisia e. Enzyme Microb. Tech-
nol. 26, 7 24–736.
41. Yin, Z., Hatto n, L. & Brown, A .J. ( 2000) D ifferential p ost-tran-
scriptional regulation of yeast mRNAs in respo nse to high and low
glucose concentrations. Mol. Microbiol. 35, 553–565.
42. Sierkstra, L.N., Sillje, H.H., Verbakel, J.M. & Verrips, C.T. (1993)
The glucose-6-phosphate-isome rase reaction is essential for n or-
mal glucose repression in Saccharomyces cerevisiae. Eur. J. Bio-
chem. 214, 121–127.
43. Ronne, H. (1995) Glucose repression in fungi. Trends Genet. 11,
12–17.
44. Reifenberger, E., Boles, E. & Ciriacy, M . (1997) Kinetic char-
acterization of individual hexose transporters of Saccharomyces
cerevisiae and t heir rela tion to the triggering mechanisms of g lu-
cose repression. Eur. J. Biochem. 245, 324–333.
45. Diderich, J.A., S chepper, M., van Hoe k, P., Luttik, M.A., van
Dijken, J.P., Pronk, J.T., Klaassen, P., Boelens, H.F., de
Mattos, M.J., van Dam, K. & Kruckeberg, A.L. (1999) Glu-
cose uptake kinetics and transcript ion o f HXT genes in c hemostat
cultures of Saccharomyces cerevisiae. J. Biol. Chem. 274, 15350–
15359.
46. Hauf, J ., Zimmermann, F.K. & Muller, S. (2000) Simultaneous
genomic overexpression of seven glycolytic enzymes in the
yeast Saccharomyces cerevisiae. Enzyme Microb. Technol. 26, 688–
698.
4864 K. Elbing et al. (Eur. J. Biochem. 271) Ó FEBS 2004