Báo cáo khoa học: Structure, expression and regulation of the cannabinoid receptor gene (CB1 ) in Huntington’s disease transgenic mice ppt
Bạn đang xem bản rút gọn của tài liệu. Xem và tải ngay bản đầy đủ của tài liệu tại đây (313.94 KB, 12 trang )
Structure, expression and regulation of the cannabinoid receptor gene
(
CB1
) in Huntington’s disease transgenic mice
Elizabeth A. McCaw, Haibei Hu, Geraldine T. Gomez, Andrea L. O. Hebb, Melanie E. M. Kelly
and Eileen M. Denovan-Wright
Department of Pharmacology, Dalhousie University, Halifax, Nova Scotia, Canada
Loss of cannabinoid r eceptors (CB1) occurs prior to neuro-
degeneration in Huntington’s disease (HD). The levels and
distribution of CB1 RNA were equivalent in 3-week-old
mice regardless of genotype demonstrating that t he specific
factors and appropriate chromatin structure that lead to the
transcription of CB1 were present in the striatu m of young
R6/2 and R6/1 t ransgenic HD mice. The expression of the
mutant HD transgene led progressively to decreased steady-
state levels of CB1 mRNA in neurons of the lateral striatum,
which was dependent on the size of t he CAG repeat a nd
relative expression of the gene encoding mutant huntingtin
(HD). Although it is known that the coding region of CB1 is
contained within a single exon in mice, rats and humans, the
5¢-untranslated r egion o f t he mouse gene remained t o b e
defined. CB1 mRNA is encoded by two exons separated by
an 18.4-kb intron. Transcription of CB1 occurred at multiple
sites within a GC-rich promoter r egion upst ream o f e xon 1
encoding the 5¢-UTR of CB1. There was no difference in the
selection of specific transcription initiation sites associated
with higher levels of CB1 e xpression in the striatum com-
pared to the cortex or between the striata of wild-type and
HD transgenic mice. The progressive decline in CB1 mRNA
levels in R6 compared to wild-type mice was due to decreased
transcription, which is c onsistent with the h ypothesis that
mutant huntingtin exerts its e ffects by altering transcription
factor activity. The cell-specific conditions that allow for
increased transcription of CB1 in the lateral striatum com-
pared t o other forebrain regions from all t ranscription start
sites were affected by the expression of mutant h untingtin in a
time-dependent manner.
Keywords: mutant huntingtin; s triatum; transcription initi-
ation s ites; q uantitative PCR.
Huntington’s disease (HD) is a p rogressive neurodegener-
ative d isorder, characterize d by a decline in motor function
and cognition, as well as the development of psychiatric
symptoms [1]. HD develops when an individual inherits one
copy of the HD gene with an extended polyglutamine-
encoding CAG r epeat [ 2]. The number of CAG repeats is
inversely correlated w ith the age of onset of th e disorder [3].
The extended polyglutamine tract in mutant huntingtin
confers a n a bnormal function that ultimately causes neuro-
degeneration of a subpopulation of cells in the basal ganglia.
In addition, a reduction in the level of normal huntingtin
may also be detrimental to the survival and function of
neurons [4,5].
One of the earliest known changes in human HD
patients is the loss of cannabinoid receptors [6]. Immuno-
histochemistry and r adio-ligand b inding ass ays of post-
mortem human b rains at different ages and stages of HD
have demonstrated that CB1 receptors decrease on nerve
terminals in the globus pallidus [7] and substantia nigra
[6,8] prior to cell loss. Similarly, CB1 mRNA levels
decline in the striatum of transgenic HD mice [8,9]. The
mechanism b y w hich mutant huntingtin causes changes
in CB1 mRNA levels has not yet been determined and it
is not known whether the decline in CB1 mRNA levels is
caused by decreased transcription, altered mRNA pro-
cessing or increased mRNA turnover.
There are a number of t ransgenic mouse models of H D.
The R 6 transgenic HD mouse m odels were created by
inserting exon 1 of the human HD gene, containing an
expanded CAG repeat under the control of the human HD
promoter, into t he mouse g enome. These t ransgenic mice
do not exhibit neuronal d egeneration, but do display a
progressive HD phen otype including tremor and abnormal
movement characteristic of the symptoms exhibited by
human HD patients [10]. R6 mice model early changes in
brain function caused by the expression of exon 1 of mutant
human huntingtin in animals that have a full complement of
mouse huntingtin. Transgenic R 6 mouse models differ in
the length of the CAG repeat within exon 1 of the human
HD transgene and site of transgene integration. The R6/1
model h as approximately 115 CAG repeats, while the R6/2
model has 150 repeats. The R6/2 model also has an earlier
onset of symptoms and exhibits more severe symptoms than
the R6/1 model [10,11]. This observation is co nsistent with
Correspondence to E. Denovan-Wright, Department of Pharmaco-
logy, Sir Charles Tupper Medical Building, 15D Dalhousie University,
Halifax, NS, Canada B3H 1X5. Fax: +1 902 494 6294,
Tel.: +1 902 494 1363. E-mail:
Abbreviations: HD, Huntington’s disease; CIP, calf intestinal phos-
phatase; TAP, tobacco acid pyrophosphatase; M-MLV, Moloney
murine leukaemia virus; GAPDH, glyceraldehyde-3-phosphate
dehydrogenase; qRT, quantitative reverse transcription; HPRT,
hypoxanthine ribosyl transferase; RLM, RNA ligase-mediated;
EST, expressed sequence tag; RPA, RNase protection assay.
(Received 2 7 July 2004, revised 4 October 2004,
accepted 25 October 2004)
Eur. J. Biochem. 271, 4909–4920 (2004) Ó FEBS 2004 doi:10.1111/j.1432-1033.2004.04460.x
the negative correlation between age of onset and CAG
repeat length observed in humans.
Using t he R6 transgenic mice as models of early stage
HD, we initiated studies aimed at under standing how
mutant hu ntingtin leads to c ell-specific dysregulation of the
levels of CB1 m RNA. The overall goal of this research was
to determine how expression of mutant huntingtin selec-
tively alters the steady-state mRNA levels of specific
transcripts such as C B1 in striatal neurons. Since it is
known that the length of the C AG repeat affects the on set of
HD in humans and in mice, we first confirmed that the rate
of decrease in steady-state CB1 mRNA was dependent on
the l ength o f t he CAG trinucleotide (nt) repeat and relative
expression of the HD gene. W e then determined the
structure of the mouse CB1 gene and determined that
transcription of t he CB1 gene was a ffected in striatal
neurons of transgenic HD mice.
Experimental procedures
Animals
Two transgenic HD mice colonies were estab lished and
maintained by crossing hemizygous R6/2 or R6/1 males
with CBAxC57BL/6 females. Mice were originally pur-
chased from The Jackson Laboratory (Bar H arbor, M E,
USA). All mice were genotyped as described previously [12].
Animal care and handling protocols were in accordance
with the guidelines d etailed by t he Canadian Council on
Animal Care and were approved by the Carleton Animal
Care Committee at Dalhousie University.
In situ
hybridization analysis
In situ hybridization was performed on coronal sections
(Bregma +1.70 to )0.50 [13]); of 3 to 24-week-old mouse
brains using a radiolabeled antisense CB1-specific oligo-
nucleotide probe (MMCB1: 5¢-ATGTCTCCTTTGAT
ATCTTCGTACTGAATGTCATTTG-3¢) as described
previously [9]. MMCB1 is complementary to nucleotides
74–110 of the m ouse CB1 cDNA (GenBank Accession
Number U40709). Nucleotide 1 of this cDNA sequence
corresponds to the s tart of the initiation c odon in the CB1
coding sequence s hown i n F ig. 4. Slides were exposed to
Kodak Biomax MR film for 2–4 weeks a t room tempera-
ture. The CB1 mRNA levels were analysed using
KODAK
1
D
IMAGE ANALYSIS S OFTWARE
. The levels of CB1-specific
hybridization signal in the l ateral s triatum were normalized
by subtracting the optical density of the CB1-specific
hybridization in the medial striatum. The levels of CB1
mRNA were low in the medial striatum relative to the lateral
striatum and were e quivalent in all wild-type a nd HD mice
examined. The optical density of the corrected hybridization
signal in the lateral striatum was s ubjected to two-way
ANOVA
assessing the influence of genotype (WT, R6/1 and
R6/2) and age (3–24 weeks) of independent groups of mice
(n ¼ 4 per specific age and genotype). The overall two-way
ANOVA
was f ollowed by one-way
ANOVA
s to assess: (a) the
influence o f genotype (WT, R 6/1, R6/2) on CB1 mRNA
levels for each age to determine genotype-specific changes;
and (b) the influence of age for each genotype to identify any
decreases in CB1 mRNA levels that occurred with increas-
ing age indep endent of genotype. Tukey’s honestly signifi-
cant multiple comparison s w ere u sed to i dentify a lterations
in CB1 gen e expression among WT, R 6/1 and R6/2 mice at
specific ages previously identified b y one way
ANOVA
sas
hosting significant genotype- or age-specific differences. A
0.05 level of significance was adopted for all comparisons.
The rate o f d ecline i n C B1 m RNA le vels in R6/2 and R6/1
mice was fit with the equation y ¼ y° +ae
–bx
using
SIGMA
PLOT
software. The variables which describe the exponential
decay in CB1 mRNA levels in R6/2 mice include y° ¼ 8.72,
a ¼2.8898 and b ¼ )0.76. For R6/1 mice, the variables
which describe t he exponential decay in CB1 mRNA levels
are y° ¼ 10.39, a ¼ 48.87 and b ¼ )0.17. The P-value for
each coefficient was < 0.01.
5¢-RNA ligase-mediated-RACE (5¢-RLM-RACE)
To obtain RNA, mice were deeply anaesthetized using
sodium pentobarbital (65 mgÆkg
)1
i.p.), decapitated, and
cortical and striatal tissue was dissected. The tissue was
immersed in liquid nitrogen and stored at )70 °Cpriorto
RNA extraction using Trizol
TM
(Invitrogen). The First
Choice
TM
RLM-RACE kit (Ambion) was used to prepare
a cDNA libr ary. B riefly, to tal R NA was t reat ed with ca lf
intestinal phosphatase (CIP) to remove the 5¢-phosphate
from all R NAs that did not have a 7-methylguanosine
cap, as well as from any trace genomic DNA. The RNA
was then divided into two samples. One aliquot was
exposed to tobacco acid pyrophosphatase (+TAP) to
remove 7-methylguanosine caps f rom the 5¢-end of the
mature m RNAs leaving a free 5 ¢-phosphate. The other
aliquot did not receive TAP treatment (–TAP) and served
as a control for the effectiveness of the initial CIP
treatment. Adapter RNA w as ligated to the 5¢-phosphate
groups on +TAP and control (–TAP) RNA using T4
RNA ligase. Moloney m urine leukaemia virus ( M-MLV)
reverse transcriptase and random decamers were us ed to
synthesize single-stranded cDNA. 5¢-RLM-R ACE PCR
was performed using an outer adapter primer (5¢-GC TG
ATGGCGATGAATGAACACTG-3 ¢) and MMCB1. An
aliquot of the primary PCR reaction was used as the
template for a second round of amplification with an
inner adapter primer (5¢-CGCGGATCCGAACACTGC
GTTTGCTGGCTTTGATG-3¢) and eithe r MMCB1 o r
RPAAS ( 5¢-GGTCAGTAAGTCAGTCGGTCTGCG-3¢).
PCR conditions for both t he first and second rounds of
amplification using MMCB1 were: 94 °Cfor3min,
followed by 35 cycles of 94 °C for 30 s, 60 °Cfor30s,
72 °C for 30 s, followed b y a final extension of 72 °Cfor
10 min. The PCR conditions using RPAAS were identical
with the exception that the annealing temperature was
increased to 62 °C and the extension time was i ncreased
from 30 to 60 s. Aliquots of the secondary PCR reactions
were fractionated on a 2% (w/v) agarose gel. The
remainder of the PCR-amplified DNA was ligated into
TOPO-Blunt
TM
vectorandusedtotransformTOP10cells
(Invitrogen). The sequence of 20 individual clones was
determined by T7 dideoxy sequencing ( USB), using
[
33
P]dATP[aP] (3000 CiÆmmol
)1
) and M13 universal for-
ward and reverse primers. The intron and exon sequences
of the CB1 gene were identified by comparing the
sequence o f t he 5 ¢-RLM-RACE cDNA clones to t hat o f
4910 E. A. McCaw et al. (Eur. J. Biochem. 271) Ó FEBS 2004
mouse genomic DNA in the database at t he Wellcome
Trust S anger Institute. P CR was used to amplify the
portion of mouse g enomic DNA that was missing in the
Sanger database. The CB1 cDNA (AY522554) and
genomic DNA (AY522555) sequences were submitted to
GenBank.
RNase protection assay
Two probe templates were g enerated by PCR a mplification
of mouse genomic DNA containing the putative CB1
transcription start sites that were identified by 5¢-RLM-
RACE. The downs tream probe (RPA-1, Fig. 2B) was
created from a sense p rimer (RPA S: 5 ¢-CGCAGACCG
ACTGACTTACTGACC-3¢),andanantisenseprimer
(Intron AS: 5¢-CCTGGAACACGGAGCAAGAAC-3¢)
complementary to a sequence within the 5¢)end of the
intron sequence. The upstream probe (RPA-2, Fig. 2B)
was generated from a sense primer (Up2 S: 5¢-CCAA
TGTCAGGTCAGTTCTTAGGCTCATTAA-3¢) comple-
mentary to t he region upstream of the putative s tart sites,
and an antisense primer (RPAAS) that was complementary
to the sense primer of the downstream probe. The PCR
cycling parameters were identical to those used for 5¢-RLM-
RACE with the e xception that the annealing t emperature
was 55 °C and the e xtension time was 90 s . The 414- and
316-bp PCR products were gel purified using a gel
extraction kit (Sigma, Oakville, ON, Canada), cloned in
pGEM-T (Promega, Madison, WI, USA) and sequenced.
The Lig’nScribe
TM
kit (Ambion, Austin, TX, USA) was
used to generate products that would p roduce biotinylated
CB1-specific antisense RNA after in vitro transcription
(Maxiscript; A mbion). Two control antisense templates,
mouse glyceraldehyde-3-phosphate dehydrogenase
(GAPDH) and mouse b-actin (Ambion), we re also tran-
scribed in vitro. Full-length biotin-labelled ribonucleotide
probes were fractionated on a 5% polyacrylamide gel,
visualized using U V shadowing, excised fro m the gel and
eluted. The CB1-, GAPDH-, and b-actin-specific probes
were stored at )80 °C.
RNase protection assays were performed using the
Supersignal RPA III kit (Pierce, Rockford, IL, USA) and
striatal and cortical RNA samples from 9-week-old wild-
type and R6/2 mice. Each probe (400 pg) was combined with
1, 10 or 25 lg RNA and, following precipitation and
resuspension in buffer, allowed to hybridize overnight at
42 °C. Control reactions i ncluded 1 0 pg probe only, and
400 p g probe with excess yeast RNA. After hybridization, all
samples, except the sample containing 10 pg CB1 probe only,
were subjected to a 30-min RNase digestion using a 1 : 100
dilution of RNase A/T1. Digestion products and a biotin-
ylated RNA ladder ( Ambion) were fractionated on a 5%
polyacrylamide gel, and transferred to Hybond N+
membrane (Amersham Pharmacia, Piscataway, NJ, U SA).
Bands were visualized by chemiluminescent detection
(Pierce) of the protected probe and RNA ladder.
Quantitative RT-PCR
Quantitative reverse transcription-PCR (qRT-PCR) was
used to determine the number of copies of mature and
unspliced CB1 transcripts in cDNA samples derived from
the striatum of wild-type a nd HD transgenic mice. S triatal
RNA was extracted from 3-, 5-, 6-, and 12 week-old wild-
type and R6/1 transgenic HD mice (n ¼ 6 per age and
genotype). Three gene-specific primers and M-MLV reverse
transcriptase (Promega) were used to generate first-strand
cDNA using 1 lg total RNA. These primers included
Intron AS, MMCB1 and a primer complementary to
hypoxanthine ribosyl transferase (HPRT AS: 5¢-CACA
GGACTAGAACACCTGC-3¢). The CB1-specific sense
primer used in qRT-PCR reactions corresponded to
nucleotides +433 to +454 (RT sense 5¢-TCCTTGTAG
CAGAGAGCCAGCC-3¢) within exon 1 (Fig. 4), which
was downstream of t he transcription start sites identified by
5¢-RLM-RACE within exon 1. This primer was used in
conjunction with the coding region-specific antisense primer
(MMCB1) to amplify a 253-bp product from cDNA
corresponding to mature CB1 transcripts. The RT sense
primer was also used with the Intron AS primer to amplify a
192-bp product from unspliced CB1 p rimary transcript.
HPRT was amplified using HPRT AS and HPRT S
(5¢-GCTGGTGAAAAGGACCTCT-3¢) primers. Stand-
ards, containing 10
6
to 10
1
copies of PCR products derived
from mature and primary CB1 mRNA and HPRT mRNA
were prepared. qRT-PCR was p erformed following the
manufacturer’s instructions for LightCycler DNA FastStart
SYBRGreen 1 [14] using 5 m
M
MgCl
2
for amplification of
HPRT,4m
M
MgCl
2
for amplification of mature CB1
cDNA, and 2 m
M
MgCl
2
for amplification of primary CB1
cDNA. Quantitative P CR was p erformed simultane ously
on individual cDNA samples and known a mounts of each
standard using each set of primers. H PRT cycling c ondi-
tions were 10 min at 95 °C, 45 cycles of denaturation (95 °C
for 15 s), annealing (63 °C for 5 s), and extension (72 °Cfor
10 s). F luorescence w as quantified at the end of each cycle.
Annealing temperature was reduced to 60 °C to amplify
primary and mature CB1 cDNA. As n egative controls, the
reverse transcriptase enzyme was o mitted from cDNA
synthesis reactions for each sample and –RT c ontrols were
subjected to qRT-PCR. No products were observed i n –RT
reactions using primers for HPRT and mature CB1 mRNA.
Small amounts of p roduct were observed in s ome, but not
all, reactions containing CB1 primary transcript-specific
primers, which corresponded to t race genomic DNA. The
amount of product in the –RT reactions was subtracted
from the a mount of p roduct in e ach +RT reaction and t he
amount of primary and mature CB1 transcript was
normalized b y dividing by the a mount of HPRT in each
sample.
Results
CB1
mRNA levels decline at different rates in
two strains of transgenic HD mice
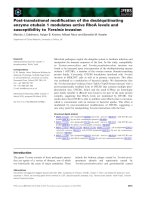
In situ hybridization was performed on coronal brain
sections of wild-type, R6/1 and R6/2 m ice, ranging in age
from 3 to 24 weeks (Fig. 1). The highest levels of CB1-
specific hybridization were observed i n the lateral striatum
of wild-type mice a nd 3-week-old R6/1 and R 6/2 transgenic
HD mice (Fig. 1 A). The CB1-specific hybridization signal
was decreased in the lateral striatum of older transgenic HD
mice. There was no statistically significant change in CB1
Ó FEBS 2004 CB1 mRNA loss in Huntington’s disease (Eur. J. Biochem. 271) 4911
mRNA levels in the m edial striatum of a ny of the w ild-type
and HD mice examined. The optical density of the
hybridization signal in the lateral striatum, corrected by
subtracting the signal in the m edial striatum, of four mice
per age and genotype were averaged (Fig. 1B), s ubjected t o
two-way
ANOVA
and post hoc tests. There was no significant
change in the steady-state levels of C B1 mRNA in the
lateral striatum of wild-type mice from 3 to 24 weeks of age.
CB1 m RNA l evels i n the l ateral s triatum o f R 6/2 HD mice
decreased from wild-type levels at 3 we eks of age to a
minimum level of 30% of that observed i n wild-type mice
by 4 weeks of age (P<0.05) and re mained constant at all
other t ime points examined. T he minimum level of CB1-
specific in situ hybridization signal observed in older R6
mice corresponds to CB1 mRNA levels that do not continue
to decline t o less t han 30% of the levels observed in wild-
type mice because minimum levels of CB1 mRNA are
detected by Northern blot analysis of RNA samples derived
from t he c ortex of wild-type and the cortex and striatum o f
R6/2 HD mice [9]. CB1 mRNA levels in the lateral striatum
began to decrease at 5 weeks in R6/1 m ice, reached a
minimum level by 9 weeks (P<0.05) and remained
relatively constant over the n ext 1 5 weeks. There was no
statistically significant difference in the a mount of CB1
mRNA detected in the oldest R6/2 ( 11 weeks) and R6/1
mice (24 wee ks). The age-dependent decrease in the average
steady-state levels of CB1 mRNA in the lateral s triatum of
the t wo transgenic HD mouse strains fit simple exponential
decay curves (Fig. 1C). This data indicated that the rate of
change in the l evels of CB1 mRNA in the lateral striatum
was dependent on age and genotype.
Previously, we determined that CB1 mRNA is highly
expressed i n isolated neurons in the cortex and hippocam-
pus of wild-type mice [9]. Most cells of the c ortex express
CB1 a t levels t hat are similar to t hat observed in the m edial
striatum. The levels of CB1 m RNA in the medial striatum
and majority of c ortical neurons remained con stant in wild-
type and R6/1 and R6/2 transgenic HD mice. Isolated
neurons that had high levels of CB1 mRNA expression were
visible in the cortices of all wild-type mice, all 3 to 15-week-
A
B
C
3 4 5 6 7 8 9 10111215182124
10
20
30
40
50
60
Age (weeks)
O
p
t
i
c
a
l
D
e
n
s
i
t
y
*
~
*
~
*
~
*
*
*
~
*
*
~
**
*
*
*
*
~
*
*
*
*
*
O
p
t
i
c
a
l
D
e
n
s
i
t
y
L
o
g
(
O
p
t
i
c
a
l
D
e
n
s
i
t
y
)
0.6
0.8
1.2
1.4
1.6
10
20
30
40
50
5010152025
Age (weeks)
1.0
1.8
0
5010152025
Age (weeks)
WT
R6/1
R6/2
35824
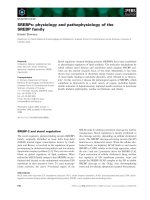
Fig. 1. The progressive de crease in the steady-
state CB1 mRNA levels in the lateral stria tum
of HD mice is d ependent on genotype.
(A) Representative mouse brain s ections sub-
jected to in situ hybridization t o detect CB1
mRNA using the MMCB1 p robe . The most
intense hybridization signal is se en in the l at-
eral striatum of the brains, which r emained
constant in t he wild-type ( WT) mice and
decreases o ver time in the R6/1 and R 6/2
mouse brains. The age in weeks of each mouse
is indicated above each column showing a
representative coronal b rain section
(Bregma 0.80) for each genotype at selected
ages. The w hite circles o n the in se t (boxed)
section derived f rom an 8-week-old wild-type
mouse in A represent the regions of each brain
that were subjected to d ensitometric analysis
of th e CB1-specific hy bridization s ignal.
(B) Histogram s howing the average optical
density (± SE of the m ean) of the hybridiz a-
tion signal in th e lateral striatum for f o ur
individual wild-type (striped bars), R 6/1
(black bars), a nd R6/2 (grey s tippled bars)
mice of each age indicated on the x-axis.
*Statistical significant di fference from WT
mice;
statistical s ignificant difference from
R6/1 mice at the identical age. (C)
SIGMA PLOT
was used t o fit t he best curve that d escribes
the rate of change in CB1 mRNA levels in the
lateral striatum o f R6/1 (open circles) and
R6/2 (solid circles) mice. The o ptical density
values o f the le vels of CB1 mRNA i n the
lateral striatum fi t a lo garithmic decay curve
for both t he R6/1 and R6/2 s trains of HD
mice with a coefficient of d etermination (R
2
)
value of 0.99 and 0.88 for R6/2 and R6/1 mice,
respectively.
4912 E. A. McCaw et al. (Eur. J. Biochem. 271) Ó FEBS 2004
old R 6/1 and all 3 t o 7-week-old R6/2 mice examined (data
not shown). In contrast, we did not observe isolated cortical
neurons with high levels of CB1 expression in any 1 8 to 24-
week-old R6/1 or 9 to 12-week-old R6/2 mice. We did
observe labelling of isolated cortical neurons with increased
CB1 mRNA levels i n all 8-week-old R6/2 mice examined
although the number o f these neurons appeared to be
reduced in 8-week-old R6/2 compare d to 3 to 7-week-old
R6/2 and w ild-type mice. The r andom distribution and
paucity of t hese neurons, however, precluded an accurate
quantitative comparison o f the number of neurons in the
cortex among mice of different ages and genotypes.
The in situ hybridization analyses demonstrated that CB1
mRNA levels in the lateral striatum and isolated c ortical
neurons, b ut not in the medial striatum or th e majority of
cells in the cortex, declined at different rates in two strains of
transgenic HD mice. I n addition, expression of CB1 i n the
lateral striatum w as affected prior to t he time that expres-
sion of CB1 in isolated cortical neurons was affected in both
strains of R6 transgenic HD mice. It appeared that the
amino t erminus of mutant huntingtin containing an expan-
ded polyglutamine tract caused the steady-state CB1
mRNA levels in the lateral striatum to decrease between 3
and 4 weeks a nd 5 and 9 weeks in R6/2 and R6/1 mice,
respectively, and t hat m RNA levels in the lateral s triatum
reached a new constant level that was similar to that
observed in the medial striatum and cortex. These data
suggested that either the rate of CB1 transcription or the
relative stability of CB1 mRNA was affected in a manner
that was dependent on the length of the CAG repeat and
relative expression of the human HD transgene in the two
strains of mice and that mutant huntingtin differentially
affected CB1 mRNA levels in specific types of neurons.
Mus musculus CB1
gene structure
The coding region of CB1 is contained within a single
exon in mice, rats and humans [15–17]. However, the
5¢-untranslated r egion o f t he mouse gene remained t o b e
defined. As a first step in defining the CB1 promoter, w e
determined the sequence and structure of the 5¢-end of
cDNAs corresponding to full-length mature CB1 mRNA
and deduced the structure of the CB1 gene by comparing
the cDNA sequences to the genomic DNA sequences
available in the mouse g enome sequence database a t the
Sanger Wellcome Trust Institute. 5¢-RLM–RACE was
performed to identify the 5¢-end of 7-methylguanosine-
capped CB1 mRNAs expressed i n the striatum of wild-type
mice. PCR amplification was performed using a CB1-
specific primer complementary to a sequence within the
coding region of CB1 (MMCB1). The PCR products were
between 50 and 400 bp in length. Abundant products
greater than 2 00 bp were not visible in the –TAP control
sample (Fig. 2A). The PCR p roducts from the +TAP
reactions were cloned and the cloned inserts ranged in size
from 100 to 450 bp. The s equence of s everal clones for each
insert size was determined and the sequences were aligned
with mouse genomic DNA (Wellcome Trust Sanger Insti-
tute database). In each clone, the cDNA seq uence was
colinear with t he genomic sequence f rom 62 bp upstream
from the CB1 translation start site until the 3¢-end of
MMCB1. The remainder of the sequence of each clone
corresponded t o the 5 ¢-untranslated r egion of CB1 mRNA,
which was colinear with mouse genomic sequence 18.4 kb
upstream of the coding region of the CB1 gene. Because the
genomic sequence of t his region was incomplete in the
Sanger database, we used P CR to amplify t he ambiguous
region and compared genomic and c DNA CB1 sequences.
The 5¢-UTR of the mouse CB1 gene contained an 18 406 bp
intron with conserved intron s plice site sequences (Fig. 2 B).
Because t he PCR reactions may h ave preferentially ampli-
fied small products, a second gene-specific primer (RPAAS)
was u sed in 5¢-RLM-RACE reactions (Fig . 2A) to deter-
mine if any CB1 transcript s had 5¢-ends upstream o f those
determined using the primer complementary to the coding
region of CB1. One product of 250 bp was cloned and
sequenced. In total, s even different s ized 5 ¢-RLM-RACE
clones with unique 5¢-ends were identified, which corres-
ponded to seven putative transcription initiation sites within
the CB1 gene upstream of the intron in the 5¢-UTR. It is
unlikely that premature termination of the reverse tran-
scriptase reaction could g enerate the 5 ¢-end of these cDNAs
as the adapter sequence was present in each cloned insert
and the adapter RNA was added before the reverse
transcriptase reaction. Several expressed sequence tags
(EST) a nd cDNA CB1 clones have been listed in Gen Bank
that contain sequence on both sides of the CB1 intron. Each
of these ESTs have a unique 5¢-e nd compared to those
determined by 5¢-RLM-RACE (Fig. 2B). We have desig-
nated the +1 position of exon 1 as the 5¢ most transcription
start site identified using 5¢-RLM-RACE. Other CB1
cDNA sequences in GenBank (U40709, BE650953,
U17985) h ave 5¢-ends that are 3¢- to the CB1 intron. Unlike
the 5¢-RLM-RACE cDNA clones, these EST clones m ay
have resulted from premature termination of reverse
transcriptase reactions or they may represent additional
CB1 transcription start sites. T he putative transcription
initiation sites o f the mouse CB1 gene are s hown in Fig. 2B
and Fig. 4.
The human CB1 gene described in the Sanger database
has t wo exons separated b y a n intron. The relative position
of the introns in the m ouse and h uman genes are identical
and the sequences at the 5¢-and3¢-splice s ite junctions are
conserved and correspond to splice junction consensus
sequences (Fig. 2B). There are t wo human CB1 c DNA
clones reported in GenBank (X54937 and NM_001840) that
havethesame5¢-end. The position o f the transcription s tart
site for human CB1 does not correspond to any of t he start
sites identified in the mouse CB1 gene (Fig. 4). In both
mouse and human, the upstream region of CB1 is GC rich
as would be p redicted for a promoter region. There is a
putative TATA box (CATAAAT) 25 bp upstream o f the
+1 transcription start site in the mouse CB1 gene.
Conserved TATA boxes are not found within 25 bp of
the human or other mouse transcription start sites.
Decreased transcription of
CB1
in HD mice
Because of the apparent complexity in the number of
transcription initiation sites in the mouse CB1 gene and
because 5¢-RLM-RACE may have led to the identification
of rare copies of mRNA, w e d ecided to determine wh ether
the 5¢-transcription initiation sites could be observed
without using a PCR-based detection m ethod. RNase
Ó FEBS 2004 CB1 mRNA loss in Huntington’s disease (Eur. J. Biochem. 271) 4913
Protection Assays (RPA) were c onducted to confirm the
position of the transcription start sites identified by
5¢-RLM-RACE reactions and t o determine the r elative
abundance of mRNAs with specific 5¢-ends. Mouse b-actin-
and GAPDH-specific probes were prepared and used as
controls in the RPA assays. b-actin levels are not affected by
theexpressionofexon1ofmutantHD [18] and the amount
of protected b-actin-specific probe was u sed t o normalize
the amount of input RNA in all other experiments
(Fig. 2 C). GAPDH mRNA decreases in the striata of
symptomatic t ransgenic R 6/2 H D compared to w ild-type
mice [19]. GAPDH was used as a positive control to
demonstrate t hat RPA could detect difference s between the
amount of mRNA in wild-type and transgenic HD RNA
samples. Levels of GAPDH mRNA, normalized to b-actin
mRNA, were 50% lower in 9-week-old R6/2 compared
to wild-type mice (data not shown). Two controls were
included in each RPA experiment. The first control included
probe that was not hybridized with target RNA or treated
with RNase. The second control i ncluded RNase-treated
A
B
GG GTAAGA TAG GGTT
AG GURAGU YAG RNNN
Intron
(18.4 Kb)
Exon xon 2
L
+-
L
+
MMCB1 RPAAS
100
200
300
400
500
600
100
200
300
MMCB1RPAAS
ATG
CB1
:
Conserved
:
RPA-2
RPA-1
D
200
500
400
300
PN 1 2 3 4
+1
C
ß-actin
750
500
400
300
200
LPN1234 56 7
*
8
80
80
-
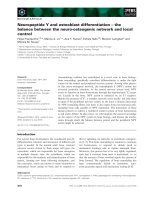
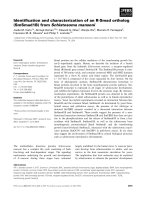
Fig. 2. Trans cription initiates a t m ultiple s ites upstream o f the intron w ithin the 5 ¢-untranslated region of the CB1 gene. (A) 5¢-RLM-RACE was
performed u sing CB1 gene-specific primers 1 and 2 (MMCB1 and RPAAS). Products were fractionated on 2% agarose gels. The size of molecular
mass markers (100 bp ladder, L) is indicated on the left of each gel. The control reaction (–TAP) is indicated by -, and the experimental products
(+TAP) are i ndic ated by +. T he +TAP-specific PCR products were c loned and seq ue nced. (B) T he large upward pointing a rrows indicate the
relative positions of the 5¢- ends of the cDNA clone s identified by 5¢-RLM-RACE compared to the exon/intron organization of the CB1 gene. The
major transcription initiation site is indicated by +1 (Fig. 4). The small upward p ointing arrows indicate the 5¢-end o f mouse CB1 EST and cDNA
clones found in GenBank. The relative position of MMCB1 and RPAAS used for 5¢-RLM -RACE are indicated. The sequence corresponding to
conserved splice s ites [35] is aligned below the c orrespon ding sequence of the mouse CB1 gene at th e intron–exon junctions and the a pproximate size
of the i ntron separating the t wo CB1 exons is 18.4 kb. The r elative positions of RPA-1 and RPA-2 probes used for RPA analysis ( C and D) are
shown. For e ach series of protectio n r eaction s, 1 0 p g o f undigested p robe co ntro l ( P) and a no target co ntrol t h at c onsists o f 400 pg of prob e
combined with excess yeast RNA and digested with RNase (N) are shown. In C, 10 lg wild-type striatal RNA (lane 1), 25 lg R6/2 striatal RNA
(lane 2), 25 lg wild-type cortical RNA (lane 3) and 25 lg R6/2 cortical RNA (lane 4) were subjected to RPA using the RPA-1 probe. The RNA
samples were all derived from 9-week-old mice. Each of the RPA-1-specific products were detected in an over-exposure of an RPA analysis of 25 lg
wild-type cortical (lane 5), wild-type striatal (lane 6), R6/2 striatal (lane 7) and R6/2 cortical (lane 8) RNA. T he arrow to the right o f l ane 8 indicates
the most abundant protected product observed in all samples. The RPA product corresponding to unspliced primary transcript is indicated by an
arrow and asterix. The relative mobility of biotin-labelled RNA ladder (L) is indicated to the left of each blot. A 1 lgaliquotofeachRNAsample
shownin(C)and(D)wassubjectedtoRPAusingtheb-actin-specific RPA probe and are shown b eneath each blot. In (D) the RPA-2-specifi c
product was detected in 10 lg of 18-week-old wild-type striatal RNA ( lane 1), R6/1 striatal RNA (lane 2), wild-type cortical RNA (lane 3) and R6/1
cortical RNA (lane 4).
4914 E. A. McCaw et al. (Eur. J. Biochem. 271) Ó FEBS 2004
probe in the presence of excess yeast RNA. The former
control demonstrated that the probe was full-length and the
latter control demonstrated that the probe was only
protected i f it annealed with complementary m RNA and
was protected from RNase digestion.
We hypothesized that the differences in steady-state CB1
mRNA levels between the lateral striatum and cortex a nd
between the lateral striata of c ontrol a nd R6 HD mice may
have been due to differences in transcription start site usage.
To determine whether the decline in CB1 mRNA levels in
transgenic HD mice was r elated to differences in transcrip-
tion initiation start s ite selection, RPA w as conducted using
RNA isolated f rom the striatum and cortex of w ild-type
and R6/2 animals. A 425-bp probe (RPA-1) was synthes-
ized that spanned the mouse genomic DNA sequence
containing the majority of the putative transcription
initiation sites upstream of t he CB1 intron. This probe
was created from a 414-bp PCR product corresponding to a
region of genomic DNA extending from between t he first
and second putativ e transcription i nitiation sites within
exon 1, to 110 bp into the 5¢-end of the intron (Fig. 2B). In
the 9 we ek-old wild-type and R6/2 transgenic mouse striatal
RNA s amples, t he most abundant RPA product was
320 n ts in length, which corresponded to the length of the
probe that was protected by the exon 1-specific portion of
the CB1 mRNA (Fig. 2C). This indicated that the most
abundant CB1 mRNAs were produced from a transcription
start site o r sites that existed at a location upstream of t he
sequence included in the RPA-1 probe. In a ddition to the
320-nt protected probe, other less abundant protected
fragments were visible. The 150–280 nt frag ments c orres-
ponded in size to probes t hat annealed with mRNA that
initiated a t t ranscription start sites identified by 5¢-RLM-
RACE. All of the protected products observed in the
wild-type sample were p resent in both the R6/2 striatal
RNA, and the wild-type and R6/2 cor tical RN A ( Fig. 2C).
There was less of each protected product in the R6/2 striatal
and c ortical RNA samples a nd in wild-type cortical RNA
samples compared to wild-type striatal RNA samples,
although i t appeared that the relative proportion of each
band in any sample remained constant in independent
experiments using differen t amounts of input RNA. There
was less of the most abundant 320-nt CB1 mRNA
protected p roduct i n R6/2 compared to wild-type s triatal
RNA. The amount o f t he protected product in the R6/2
striatal sample was equivalent to the amount of the
protected product in both t he wild-type a nd R6/2 cortical
RNA samples. T his analysis demonstrated that there w as
no striatum-specific use o f p articular CB1 transcription
initiation sites or change in transcription initiation site usage
due to the expression of mutant huntingtin.
We also detected a RPA product that was protected after
annealing with unspliced primary CB1 transcript. The size
of this protected product (414 n ts) was slightly less than
the f ull-length CB1 probe (425 nts) although t his d ifference
was not apparent on the 5 % d enaturing acrylamide gels
presented in Fig. 2. The 11 nt difference in size between
the undigested full-length RPA probe and the CB1
primary transcript-protected product corresponds to adap-
ter sequence added to the CB1 probe during synthesis. No
protected products were observed a fter RNase treatment in
reactions containing RPA probe and 1–10 lg genomic
DNA (data not shown) demonstrating that the 414-nt
protected p robe had annealed to p rimary CB1 mRNA and
not contaminating DNA. There was less primary transcript-
protected p roduct when 2 5 lgofR6/2striatalRNAwas
used in the hybridization reaction compared to 10 lgof
wild-type striatal RNA, suggesting that the levels of
unspliced primary CB1 transcript in each sample were
proportional to the levels of mature CB1 transcript
(Fig. 2 C). The amount of primary t ranscript was lower in
R6/2 compared to wild-type striatal RNA and the ratio of
the optical density of t he primary to mature transcript w as
0.1 in all cortical and s triatal RNA samples suggesting
that there was decreased transcription of the CB1 gene in
HD mouse brain. T his supports the hypothesis that the rate
of transcription of CB1 in the striatum of symptomatic R6/2
mice is similar to the rate of transcription i n regions of the
brain where CB1 is e xpressed at a low basal level, and that
the cell-specific conditions that allow for increased tran-
scription of the CB1 gene in the lateral striatum compared
to other forebrain regions, are time-dependently affected
by the expression of mutant huntingtin.
Because it appeared that the majority o f t ranscripts were
derived from a start site that w as upstream of the 5¢-end of
the sequence included in RPA-1, we synthesized a second
probe (RPA-2) and repeated the R PA analysis of striatal
and cortical RNA isolated from wild-type and symptomatic
R6 mice. RPA-2 spanned a 314-bp sequence containing the
first putative transcription start site (Fig. 2B). These ana-
lyses demonstrated that the majority of CB1 transcripts
were synthesized from transcription start site 1, which is
located 266 bp upstream o f the 3 ¢-end of RPA-2. The l evels
of CB1 mRNA derived from the +1 position (Fig. 4)
were lower in all cortical RNA samples and striatal RNA
isolated from R6 mice compared to the levels observed in
wild-type striatal RNA (Fig. 2D). Therefore, t here was one
predominant transcription start site and several other
transcription s tart sites i n the mouse CB1 gene that were
used to express the CB1 gene in striatal and cortical
neurons. We consistently saw the same pattern o f RPA-
protected products in wild-type and the two R6 strains of
different ages (data not shown). The levels of CB1 m RNA
produced from each transcription start site in the s triatum
of R6 compared to wild-type mice declined proportionately
demonstrating that t here is no transcription initiation site
selection associated with either the expression of CB1 in t he
striatum vs. t he cortex or expression of CB1 in transgenic
HD mice.
To test the hypothesis t hat expression of mutant hunt-
ingtin decreased CB1 transcription, we measured the
amount of p rimary and m ature CB1 transcript in striatal
RNA of w ild-type and R6/1 mice by qRT–PCR. R6/1, and
not R6/2, mice were used in this study because the rate of
CB1 mRNA decline was slower in R6/1 compare d to R6/2
mice (Fig. 1B,C) and we hypothesized that it may have been
possible to determine whether primary transcript levels
changed prior to the time that t he decrease in mature CB1
transcript levels were apparent in R6/1 mice. Because intron
splicing occurs cotranscriptionally [20], the amount of
primary transcript present at a given time point reflects
the amount of newly synthesized primary transcript.
Relative rates of transcription can t herefore be inferred
from quantification of primary transcript levels. We isolated
Ó FEBS 2004 CB1 mRNA loss in Huntington’s disease (Eur. J. Biochem. 271) 4915
RNA from striata of 3-, 5 -, 6- and 12-week-old wild-type
and R6/1 mice a nd prepared c DNA using gene-specific
primers complementary to exon 2 and intron 1 of the mouse
CB1 gene. A primer complementary to the mouse HPRT
mRNA was also included in the reverse-transcriptase
reactions. HPRT is constitutively expressed in wild-type
and R6 transgenic mice and the levels o f HPRT were used
to normalize C B1 levels among samples. Consistent with
in situ hybridization r esults, qRT-PCR demonstrated that
there w as no difference in the a mount of mature CB1
transcript in the striatum of 3- and 5-week-old wild-type and
R6/1 mice (Fig. 3). While less m ature CB1 transcripts were
detected in the brains of 6-week and 12-week R6/1
transgenic mice compared to age-matched wild-type mice,
this difference was only statistically significant at 12
weeks ( P<0.05) (Fig. 3A). The qRT-PCR a nalysis of
mature CB1 mRNA levels differed from our previous in situ
hybridization results where there was a statistically sig-
nificant difference in the levels of CB1 mRNA between
6-week-old wild-type and R6/1 mice. However, the in situ
hybridization results were based on the levels of CB1
mRNA in the lateral st riatum where t he highest levels of
expression of CB1 a re found and t he mutant huntingtin-
induced decline in CB1 occurs. In contrast, t he cDNA for
qRT-PCR w as derived from the entire dissected striatu m
and, as such, the observed decrease in the CB1 mRNA levels
in the striatum of R6 mice was diluted b y the amount of
message contributed by other striatal neurons where CB1
mRNA levels remained constant.
No statistically significant difference was detected in the
amount of primary C B1 transcript among wild-type and
R6/1 mice at 3 or 5 weeks of age. H owever, t he average
primary transcript level was lower in 5-week-old R6/1
compared to wild-type mice. The levels of primary CB1
transcript detected were significantly decreased in the
striatum of 6- (P<0.05) and 12-week-old (P<0.05)
R6/1 mice compared to age-matched wild-type mice
(Fig. 3B). Based on these observations and RPA analysis
of primary transcript levels, it appeared that the rate of
transcription of the CB1 gene was decreased in the striata of
R6 mice and that t his decrease led to the observed decre ase
in steady-state levels of mature CB1 mRNA.
Comparison of human and mouse CB1 promoters
Using
MATINSPECTOR
(http://www.g enomatix.de), several
transcription factor-binding sites were detected upstream of
the major transcription start s ite and within t he 5¢-UTR of
the mouse CB1 gene. Transcription factor binding sites with
100% core sequence s imilarity and ‡ 95% matrix similarity
are listed in Table 1. We analysd the ge nomic DNA
sequences of the human and m ouse CB1 genes in the region
including and upstream of the transcription i nitiation s ites
to locate conserved regulatory sequences. The promoter
sequences were readily align ed but did c ontain insertion/
deletion differences (Fig. 4). Several transcription factor-
binding sites w ere conserved i n t he CB1 promoters of both
species (Fig. 4). A number of transcription factors have
been shown t o physically interact with mutant huntingtin
including SP1 , NcoR , C REB a nd NRSF [5,21–24]. Con-
served SP1, but not NCoR, CREB and NRSF, binding sites
were located in t he mouse a nd human CB1 promoters. No
NCoR, CREB or NRSF b inding sites w ith 100% core
similarity were observed i n the mouse CB1 region within
500 b p upstream or downstream of the major transcription
start s ite. The i dentification of the transcription factors that
control CB1 gene expression and which, if any, of these
transcription f actors interact with mutant huntingtin
remains to be determined.
Discussion
The endogenous ligands of CB1, arachidonylethanolamide
(anandamide) [25] a nd 2-arachidonyl g lycerol [26], a ct as
modulators of dopamine neurotransmission, and a bnor-
malities in c annabinoid signalling o r m odulation of dop-
amine signalling o r both h ave been implicated in a number
of neurodegenerative diseases includ ing H D and Parkinson
disease, and in other neuropsychiatric disorders such as
schizophrenia [27]. Cannabinoid receptors therefore are
important modulators of brain function and loss of these
receptors would likely negatively impact brain function in
HD patients [6]. Our goal, however, was to complete a
description of the mouse CB1 gene and to determine how
CB1 mRNA l evels are affe cted in HD transgenic mice as a
A
1.00
0.60
0.40
0.20
0.80
Ratio of Mature
CB1/HPRT
CB1/HPRT
B
0.06
0.04
0.02
0.08
35 6
12
35 6
12
*
*
*
Ratio of Primary
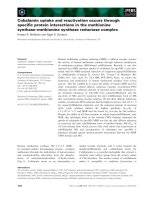
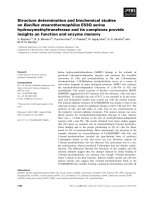
Fig. 3. Primary CB1 transcripts decrease in R6/1 HD mice prior to the
loss of mature CB1 mRNA. Using qRT-PCR, we quantified mature
CB1 mRNA (A) and primary CB1 transcripts (B) from wild-type and
R6/1 HD mice striatal RNA. One microgram of to tal striatal RNA
from each sample w as used for cDNA synthesis. The l eve ls of CB1
primary and mature transcripts were normalized to t h e concentration
of HPRT in each sample. The ratio of mature (A) or primary (B) CB1
to HPRT is represented on the y-axis.Theageofthemiceinweeks
from which the RNA w as ex tracted is indicated on the x-axis. The
striped and solid bars represent the mean values for wild-type (n ¼ 6)
and R6/1 (n ¼ 6) mice, r espectively. E ach experiment was performed
simultaneously on three samples per transcript, age and genotype and
thedatawerepooled(n ¼ 6). The error bars represent SE of the mean.
Normalized cDNA levels were subjected to one-way analysis of vari-
ance (
ANOVA
). *Significant difference (P<0.05) from w ild-type.
4916 E. A. McCaw et al. (Eur. J. Biochem. 271) Ó FEBS 2004
first step in defin ing one of the t oxic functions of mutant
huntingtin.
The l ength o f the trinucleotide CAG repeat within the
HD gene is correlated with t he time of symptom onset, rate
of disease progression and severity of symptoms in HD
patients and HD transgenic mice [3,10]. The R6/1 mice have
a later age of motor symptom onset and cognitive decline
and slower disease progression than the R6/2 mice [ 10,28].
Previous work demonstrated that levels of mutant hunting-
tin protein are lower in the R6/1 mice compared to R6/2 [10]
and t hat neuronal intranuclear inclusions (NIIs) contain ing
the human transgene-encoded a mino terminus of hum an
huntingtin form more slowly throughout the brain tissue in
R6/1 compared to R6/2 mice [29,30]. The differences
between the two transgenic lines of HD mice inc lude the
length of the C AG repeat within the HD tra nsge ne a nd the
site of integration o f the transgene [10], which appears to
lead to differences in t he amount of protein produced from
the t ransgene. Therefore, the length of the polyglutamine
tract encoded by the human HD transgene or relative
expression of the transgene affects the rate of HD progres-
sion in these mice. To determine w hether the r ate of d ecline
in steady-state CB1 mRNA levels was dependent on
genotype, in situ hyb ridization was used to detect CB1
mRNA in the brains of wild-type and the R6/1 and R6/2
transgenic HD mice. In situ hybridization and densitometric
analysis demonstrated that the steady-state levels o f C B1
mRNA in the lateral striatum of wild-type mice remained
constant in 3 to 24-week-old mice but that there was a
significant decline in CB1 mRNA in both R 6/1 and R6/2
mice. Loss of C B1 m RNA levels in t he lateral striatum of
R6/2 HD mice occurred at a faster rate, and at an earlier age
compared to the R6/1 mice. The final steady-state levels o f
CB1 mRNA were t he same in both s trains of R6 transgenic
HD m ice. Therefore, t he relative expression level o f m utant
huntingtin or length of the C AG repeat or both affected the
onset and rate of decline of CB1 mRNA levels. Moreover,
because the final s teady-state level of CB1 m RNA was the
same in both models of transgenic HD mice and t he rate of
decline of the CB1 mRNA was described by simple
exponential decay curves in both species, it appears that
the l ength of the CAG repeat and relative expression of the
transgene affected the rate of mRNA message loss but not
the final steady-state levels of CB1 mRNA.
We als o wis hed to define the structure of the mouse CB1
gene and quantify the levels of mRNA that corresponded to
each transcription start site in striatal RNA to determine
whether there was differential transcription start site usage
among tissues or between wild-type a nd R6 transgenic HD
mice. Mu ltiple CB1 t ranscription start sites were iden tified
upstream of an 18.4-kb intron by 5¢-RLM-RACE a nd
confirmed by RNase protection assays. cDNA and EST
clones with 5¢-ends corresponding to sequences located
downstream of t he mouse CB1 intron are p resent in
GenBank. It is possible therefore that transcription may
occur downstream o f the mouse CB1 intron although we
did not detect any 5¢-RLM-RACE clones that corresponded
to capped mRNAs that initiated in exon 2 . T o d ate, only a
single human CB1 transcription start site has been des-
cribed, which is upstream of t he intron in the human CB1
gene. The single transcription i nitiation site for human CB1
does not correspond to any transcription initiation sites
identified in the mouse CB1 gene. The exon/intron organ-
ization and primary sequence of the coding and r egulatory
sequences are conserved between the mouse and human
CB1 genes.
RPA a nalysis d emonstrated that there i s a proportional
loss of the CB1 transcripts from each of the transcription
start sites of the CB1 gene in R6 transgenic HD compared
to wild-type mice. This ind icated that spe cific mRNAs
derived from particular start sites were not preferentially
lost in the striatum of HD mice. Further, the final
equilibrium levels of each CB1 transcript in the striatum
of HD mice was the same as the basal levels of CB1 mRNA
found in the cortex in both wild-type and HD mice. This
conclusion is supported by earlier Northern blot analysis of
the levels of CB1 mRNA in the striatum and cortex of wild-
type and R 6/2 mice [9]. This i ndicated that the difference
between neurons in the medial striatum and cortex that
express basal levels of CB1 and neurons in the lateral
striatum that have higher steady-state levels of CB1 mRNA,
was not due to different start site selection within the CB1
promoter. It appears that the factors or conditions that
control the higher steady-state levels of CB1 mRNA in the
lateral striatum compared to the medial striatum and cortex
Table 1. T ranscription factor binding sites in the mouse CB 1 promoter.
AREB6, Atp1a1 regulatory element binding factor 6; MZF1, myeloid
zinc finger p rotein; RAR, retinoic acid nuclear receptor; WHN, winged
helix protein; B KLF, basic krueppel-like factor; ZF5, z inc fi nger do-
main; MYT1, z inc finger TF i nvolved in primary neurogen esis; E2A
proteins, and GATA-1, half-site 1; ARNT, AhR nuclear translocator
homodimers; CLOCK BMAL, binding site of Clock/BMAL het-
erodimer; AP1, A ctivator protein 1 ; SP1, stimulating protein 1;
HMGIY, high-mobility g roup protein 1; M YOD, Myoblast deter-
mining factor; LMO2COM, complex of Lmo2 bound to Tal1, E2A
proteins, and GAT A-1, half-site 1.
Transcription
factor
Core
consensus
Number
of sites
Positions
relative to +1
a
Sequence
AREB/AREB6 GGTG 2 )471, +467
ETSF/ELK1 TTCC 1 )471
MZF1/MZF1 CCCC 2 )471, )116
RARF/RAR GACC 1 )396
CMYB/CMYB TAAC 1 )348
VMYB/VMYB AACG 1 )348
WHZF/WHN ACGC 3 )318, +109, +201
ELKF/BKLF GGGT 1 )267
ZF5F/ZF5 GCGC 3 )219, )138, +206
MYT1/MYT1 AAGT 1 )153
HIFF/ARNT CGTG 1 )53
EBOX/MAX CACG 1 )52
HIFF/CLOCK BMAL1 CGTG 1 )52
AP1F/AP1 TGAC 1 +222
SP1F/SP1 CGCC 1 +260
SORY/HMGIY TTAA 1 +423
MYOD/MYOD GGTC 1 +465
MYOD/LMO2COM CAGG 1 +466
a
Numbers refer to the position of the 5¢-end of the conserved
matrix of each response element in relation to the +1 major
transcription initiation site in the mouse CB1 promoter presented
in Fig. 4.
Ó FEBS 2004 CB1 mRNA loss in Huntington’s disease (Eur. J. Biochem. 271) 4917
are affected by the expression of mutant huntingtin. W hen
the f unction of this factor or synergistically acting group of
factors is lost, there is no d ifference in CB1 expression
throughout the striatum a nd cor tex. It appeared that the
length of the CAG repeat or relative expression levels of the
huntingtin transgene affected the rate at which the f unction
of this factor was lost in t he two lines o f transgenic HD
mice.
The steady-state levels of CB1 mRNA could decrease in
HD compared to wild-type m ice i f t he ra te of transcription
was reduced or if mRNA turnover was increased. If CB1
mRNA stability was decreased, there would be a higher
ratio of primary to mature transcript in striatal RNA
isolated from HD compared to wild-type mice a nd the
amount of unspliced primary transcript would be the same
in wild-type and HD mice. If heteronuclear RNA splicing
was affected by the e xpression of the h uman HD transgene,
one would p redict a relative increase in the amount of
primary CB1 transcript at any given time point in HD mice
as intron processing would be delayed and t he half-life of
the p rimary transcript would be increased. If transcription
of the CB1 gene decreased in a specific subset o f neurons,
the amount of primary and mature CB1 transcript would be
lower i n HD c ompared to w ild-type mice. Moreover, the
ratio of p rimary to mature transcript would be the same in
both wild-type a nd HD mice after an equilibrium between
M GGTGGCCGCGGCCAGGTAGCTGAGGACTGGAGGCGGCGCAGAGGGGAGGGTCGGGCGGAGACCTCACTTGGCCGGCCTTCCTGCCGCCCTGTTTCCGGAT
-406
H T* ***** ***G** G**G*GC***A*C**A*CCCC***CCC*G**C**CTC*G****TGGGCT**C**TCC***T**-** ******C*
M C CCGACCGCCCGGCGCGTGACCTCCAGTGA-GGTCCTGGCAATGAGCA GCGCTGGTGATTAACGGCCCCGAGGTCGCGGGCAGTG-AGGC
-318
H *AG**CG*T****CAGA*******C**GCG**A***GT****G***C**GCTGCCCGG*A**GT********T*************T****G*C*C*T**
Sp1 AP2 -229
M ACGCGTCCCCT-TTGGCCACGCCAGGGTGGGAGGGCGCCAGGGAG
CAGAGCAGGGTGA-GGCCGCGGGGTCGTT GGTGGCAAAGAGTGAGG
H **CA*C***T*C******TG*T*******T*****TAT*C*******C***GA***C*T***A******G*C*CCGGGAGCGC**C***GG**GAG****
-142
MYT1,E2F
M
ATGACAC AGTGGGCGCCGAGCGCC AGGGCCGTCCCTCCTAGCCCCCGGGCCAGCGCCGCGGCGGGTACCGCGC AGCAAAGTTTG
GAG
H *G**AGAGGAGA***A**T*A**C*G***GAAG***CTT*****CT**G*****A****TG**************C**C***CCCA************G*
-42
Sp1,ZF9,MAZF,MZF1 PDX1,XBP1,MAX,ARNT,BMAL1,PAX8
M CCGCGGGCGCCGCGCGCCGGTCCCTCCCC
GCGCAGATCCCTTGGCGGAGTCTCTGAAGCAGCCAATGTCAGGTCAGTTCTTAGGCTCATTAACACGTGAT
H *TA*******T****T*A*****************T*****C*****G****G**CC**C***GC**C****G***GA*AA*******************
M
GGGACCACGCTTCATAAATGGGACTG
GAGA BOX +1 +57
GAGCGAGAGCAGGCCAGAGACAGCG
CGCGAGCTGAGGGAGAGGCAGGGAC CTCAAGCAGGGCGCGGCGACGG
H ******G****************************GGA*************** ***G*******C*********TG*G*G***G**A**A********
ZF9 +145
M GCGCTCGGGGTGGCCCAAGCGGGCGG
CCCCAGGCCGGCCAGCGCGGT CAGTGGGACGCCGGGGAGAGCCGGAGAA CGAAGCGGGCCTG
H ****C****C****GG*GA************C*****G*CAG****GGCTCG*G*GA****C*A*T*A******T*G***GGGG***G**TC***G*CGG
MZF1 WHZF +245
M TCCGAGCCCAGGGG
AGCCAGTCCCAGGGGCCGTGGCGCACGGGTGCTAGAGGCCGGGGACGCGGGCGCGCAGACCGACTGACTTACTGACCGATCGCCGC
H **G****AGC****C*********G*TC**T**C***GG****C***G***A*****-****C*****T*G***G*********G*******CC*****G
+326
ZF9,MAZF,SP1,RREB1 ZF9
M GGGCACGCCCCGCTCCACCCCGCCCCA
CCGCGCC CCGCGCCGCCTCCC CTGCTCGCTC-GCTGCCTCTACCTTCTCCACTTC
H A*****A****A*********A****G**T****AGCAGCCCGGCGC*G************GCACG**A***C***T**CA**C**T*************
M
E2F,EGRF MYT1 +425
TTTTCCGCC
TCCGCCTCCTTCTGGCTCCCCTGGCGCCAGAGCCTCCCCCTGGCTCAGGCGGGAGCCTGGGCTGTCTGCAGAGCTCTCATAGAGTCTG-GG
H *****************T*CT**T*****GC********C****T***T****C*G******G****C****CC*************CGT-****A*T**
OCT1 +515
M GCAAATTTCCTTGTAGCAGAGAGCCAGCCCCTTGGCTGGGCGACAGGTGCCGAGGGAGCTTCTGGCCCGTGGACCGGGGGATGC
GAAGGgtaaga…………
H *G*T*****G**C****G**C*A*********GA*********G*******A************T****A*****A*******************…………
+19009
M K S I L D G L A
M …………tgttagGGTTCCCTCCTG-GCACCTCTTTCTCAGTCACGTTGAGCCTGGCCTAATCAAAGACTGAGGTTATGAAGTCGATCTTAGACGGCCTTGC
H …………*c*****A**G**C****T*GGT*A************TT******TCA*********************************C****T********
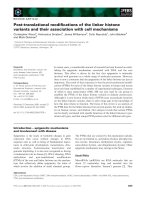
Fig. 4.
CLUSTAL
alignment of t he mouse (M) and hum an (H) CB1 promoter regions. Stars represent nucleotides found in the human CB1 genomic
DNA t hat m atch the mouse D NA sequence. Dashes i nd icate i ns ertion/dele tions. T he position indicated b y +1 i s t he major C B1 transcriptio n
initiation site in the mouse sequence and numb ering on the left is relative to t his +1 po sition. Arrows pointing to the r ight above t he bold
nucleotides in the mouse CB1 sequence represent transcription start sites identified in this study. The arrow pointing to the right below the human
CB1 sequ en ce represents th e 5¢-end of a human CB1 cDNA reported in GenB ank. The downward pointing arrows indicate the position o f the
5¢-ends of mouse CB1 cDNA and EST clones that are present in GenBank. Exon sequence is indicated by upper case letters. The intronic sequences
at the 5¢-and3¢-splice s ite junctions are in lower case letters. The small dots represent 1 8 395 and 2 0 467 bp intron sequences i n the mouse and
human genomic DNA sequence, respectively, that separate the splice site sequences. The amino acid sequence of mouse and human CB1 encoded
by exon 2 is shown above the aligned genomic sequences and the codin g region is double underline d. Conserved transcription factor binding
elements a re underlined.
4918 E. A. McCaw et al. (Eur. J. Biochem. 271) Ó FEBS 2004
the n ew reduced rate of transcription and constant rate of
turnover was established. We detected the primary tran-
script o f the major CB1 transcription p roduct i n RPA
analyses. T here was less p rimary transcript detected in the
R6/2 HD striatal RNA samples compared to wild-t ype
striatal RNA samples as determined by densitometric
analysis, and the r atio of primary to m ature CB1 mRNA
(approximately 0.1) w as the same in t he samples d erived
from wild-type and HD mice. To confirm t he finding that
the absolute levels of CB1 primary transcript were decreased
in HD mouse striatum, we determined the levels o f primary
and mature CB1 mRNA by qRT-PCR. This analysis
demonstrated that the rate of t ranscription of CB1 is
reduced in the striatum of HD m ice prior to the time that
the decreased steady-state level of CB1 mRNA was
observed.
An altered rate of transcription is consistent with the
hypothesis that mutant huntingtin exerts its effects by
altering transcription f actor activity [5,21–24,31,32]. C om-
parative analysis of the promoter r egions of the mouse a nd
human CB1 genes demonstrated that there were a number
of transcription factor binding sites that have been con-
served between the two species, suggesting that s ome
common individual factor or groups of factors could be
affected by the e xpression of mutant huntingtin in mice and
humans. Only 1–2% of genes expressed in the striatum are
affected by mutant huntingtin [18]. Mutant huntingtin and
the transcription factors t hat have b een shown to physically
interact with mutant huntingtin are widely expressed
throughout the brain. It is not yet known how mutant
huntingtin selectively alters transcription of a small subset of
genes by interacting with ubiquitously expressed transcrip-
tion factors.
Another possibility is that mutant huntingtin itself has a
characteristic that is unique when this protein is expressed
in the striatum. It appears that with increasing age the
length of the CAG repeat in mutant HD may be
increased significantly by m echanisms that occur postmit-
otically [33,34]. Although t he expression of CB1 changes
over time, the initial conditions that lead to the increased
expression of CB1 in the lateral striatum compared t o
elsewhere in the brain are present and functional i n young
HD mice. Loss of CB1 or other mRNAs and the
development of NIIs and motor symptoms occur o ver
time. I t is possible that, due to the postmitotic chan ge in
the length of the CAG r epeat, mutant huntingtin protein
produced in the striatum of o lder animals may have sig-
nificantly longer polyglutamine-repeats and have g reater
effects on transcription of a subset of genes in the
striatum.
The toxic gain of function associated with mutant
huntingtin is not restricted to transcriptional d ysregulation.
While the loss of individual gene products such as CB1 or
any of t he other m RNAs and p roteins that have altered
steady-state levels in the striatum o f HD mice or patients
likely contributes to disease progression, the inheritance and
expression of mutant huntingtin is the primary cause of
HD. Examination o f t he regulation of individual m utant
huntingtin-affected genes such as CB1 may increase our
understanding of at least o ne abnormal f unction of mutant
huntingtin by allowing us to identity the factor(s) that are
affected by the expression of mutant huntingtin and the
exact mechanism by which mutant huntingtin alters the
function of such factors. This work describing the gene
structure of CB1 and i ts pattern of expression in transgenic
mice will provide the information necessary to determine
how mutant huntingtin alters the expression of this partic-
ular gene.
Acknowledgements
This work was supported b y grants from the Canadian Institutes of
Health Research to E. D W. and the Natural Sciences and Engineering
Research Council of Canada (NSERC) to M.E.M.K. E.A.M. received
an NSERC summer studentship. W e thank M. Huang, K. Murphy and
J. Nason f or technical assistance.
References
1. Martin, J.B. & Guse lla, J .F. ( 1986) H untington’s disea se: patho-
genesis and management. N. Eng l. J. M ed. 315, 1 267–1276.
2. The Huntington’s Disease Collaborative Research Group ( 1993)
A novel gene containing a t rinucleotide repeat that is expanded
and unstable on Huntington’s disease chromosomes. Cell 72,
971–983.
3. Trottier, Y., Biancalana, V. & Mandel, J.L. (1994) Instability of
CAG repeats in Huntington’s disease: relation to paren tal trans-
mission and age of onset. J. Med. Genet. 31, 377–382.
4. Duyao, M.P., A uerbach, A.B., Ryan, A ., Pe rsichetti, F., Bar nes,
G.T.,McNeil,S.M.,Ge,P.,Vonsattel, J.P., Gusella, J.F., Joyner,
A.L. & MacDonald, M.E. (1995) Inactivation of the mouse
Huntington’s disease gene homolog Hdh. Science 269, 4 07–410.
5. Zuccato, C., Tartari, M., Crotti, A., Goffredo, D., V alenza, M.,
Conti,L.,Cataudella,T.,Leavitt,B.R.,Hayden,M.R.,Timmusk,
T., Rigamonti, D. & Cattaneo, E. (2003) Huntingtin interacts with
REST/NRSF t o modulate th e transcription o f NRSE-controlled
neuronal genes. Nat. Genet. 35, 76–83.
6. Glass, M., F aull, R.L.M. & Dragunow, M. (1993) Loss of can-
nabinoid receptors in the substantia nigra in Huntington’s disease.
Neuroscience 56, 523–527.
7. Richfield, E.K. & Herkenham, M. (1994) Selective vulnerability in
Huntington’s disease: pref erential loss of cannabinoid receptors in
lateral g lobus pallidus. An n. Neurol. 36 , 577–584.
8. Glass, M., Dragunow, M. & Faull, R.L.M. (2000) The pattern of
neurodegeneration in H untington’s d isease: a c omparative s tudy
of ca nnabinoid , do pamine , a de nosine a nd GABA
A
receptor
alterations in the human basal ganglia in Hunti ngton ’s disease.
Neuroscience 97, 505–519.
9. Denovan-Wright, E.M. & Robertson, H.A. ( 2000) Cannabino id
receptor messenger RNA levels decrease in a subset of neurons in
the l at eral striatum, cortex and hippo campus of tran sgenic Hun-
tington’s disease mice. Neuroscience 98 , 705–713.
10. Mangiarini, L., Sathasivam, K ., Seller, M., Cozens, B., Harper,
A.,Hetherington,C.,Lawton,M.,Trottier,Y.,Lehrach,H.,
Davies, S. & Bates, G. (1996) Exon 1 of the HD gene with an
expanded CAG repeat is sufficient to cause a progressive neuro-
logical phenotype in transgenic mice. Cell 87, 493–506.
11. Naver, B., Stub, C., Moller, M., Fenger, K., Hansen, A.K.,
Hasholt, L. & Sorensen, S.A. (2003) Molecular and behavioral
analysis of the R6/1 H untington’s disease transgenic mouse.
Neuroscience 122, 1049–1057.
12. Hebb, A.L.O., Robertson, H.A. & Denovan-Wright, E.M. (2004)
Striatal phosphodiesterase mRNA a nd protein l evel s are reduced
in H unt ington’s Disease tran sgenic mice prio r to the onset o f
motor symptoms. Neuroscience 123, 967–981.
13. Franklin, K.B.J. & Paxinos, G. (1997) Th e Mouse Brain in
Stereotaxic Coordinates. Academic P ress, San D iego.
Ó FEBS 2004 CB1 mRNA loss in Huntington’s disease (Eur. J. Biochem. 271) 4919
14. Liu, R.Z., Denovan-Wright, E.M. & Wright, J.M. (2003) Struc-
ture, m RNA expression and linkage mapping of the brain-type
fatty acid-bind ing pro tein gene (FABP7) from zebrafish (Danio
rerio). Eu r. J. Bioc hem. 270, 715–725.
15. Matsuda, L.A., Lolait, S.J., Brownstein, M.J., Y oung, A.C. &
Bonner, T.I. (1990) Structure of a cannabinoid receptor and
functional expression of the cloned c DNA. Nature 34 6 , 561–564.
16. Gerard, C.M., Mollereau, C., Vassart, G. & Parmentier, M. (1991)
Molecular cloning of a human cannabinoid receptor which is also
expressedintestis.Biochem. J. 279, 129–134.
17. Chakrabarti, A., Onaivi, E.S. & Chaudhuri, G. (1995) Cloning
and sequencing o f a cDNA encod ing th e mou se brain-typ e c an-
nabinoid receptor protein. DNA Seq. 5, 385–388.
18. Luthi-Carter, R., Strand, A.D., Peters, N.L., Solano, S.M., Hol-
lingsworth, Z.R., Menon, A.S., Frey, A.S., Spektor, B.S., Penney,
E.B., Schilling, G., Ross, C.A., Borchelt, D.R., Tapscott, S.J.,
Young, A.B., Cha, J H.J. & Olson, J.M. ( 2000) Decreased
expression of striatal signaling genes in a mouse model o f Hun-
tington’s disease. Hum. Mol. Genet. 9, 1259–1271.
19. Luthi-Carter,R.,Hanson,S.A.,Strand,A.D.,Bergstrom,D.A.,
Chun, W., Peters, N.L., W oods, A.M., Chan, E.Y., Kooperberg,
C.,Krainc,D.,Young,A.B.,Tapscott,S.J.&Olson,J.M.(2002)
Dysregulation of gene expression in the R6/2 model of polyglu -
tamine d isease: parallel changes in muscle and brain. Hum. Mol.
Genet. 11, 1911–1926.
20. Proudfoot, N.J., Furger, A. & Dye, M.J. (2002) Integrating
mRNA processing with transcription. Cell 10 8, 501–512.
21. Steffan, J.S., Kazantsev, A., Spasic-Boskovic, O., Greenwald, M.,
Zhu, Y Z., Gohler, H., Wanker, E., Bates, G., Housman, D .E. &
Thompson, L.M. ( 2000) The Huntington’s disease p rotein i nter-
acts with p53 and CBP and represses t ranscription. Proc. Natl
Acad. Sc i. USA 97 , 6763–6768.
22.Dunah,A.W.,Jeong,H.,Griffin,A.,Kim,Y M.,Standaert,
D.G.,Hersch,S.M.,Mouradian,M.M.,Young,A.B.,Tanese,N.
& K rainc, D. (2002) Sp1 and TAFII130 transcriptional activity
disrupted in e arly Huntington’s d isease. Science 296, 2238–2243.
23. Li,S H.,Cheng,A.L.,Zhou,H.,Lam,S.,Rao,M.,Li,H.&Li,
X J. (2002) Interaction of Huntington’s disease protein with
transcriptional activator Sp1. Mol. Cell. Biol. 22, 1 277–1287.
24. Yohrling, G.J., Farrell, L .A., Hollenberg, A.N. & Cha, J.H.J.
(2003) Mutant huntingtin increases nuclear core pressor function
and enhances ligand-dependent nuclear hormone receptor acti-
vation. Mol. Cell Neurosci . 23, 28–3 8.
25. Devane, W.A., Hanus, L., Breuer, A., Pertwee, R.G., Sevenson,
L.A., Griffin, G., Gibson, D., Mandelbaum, A., Etinger, A. &
Mechoulam, R. (1 992) Isolation and structure of a b rain con-
stituent that binds to the cannabinoid receptor. Science 258, 1946–
1949.
26. Mechoulam, R., Ben-Shabat, S., Hanus, L., L igumsky, M.,
Kaminski, N.E., Schatz, A .R., Gopher, A ., Almog, S., Martin,
B.R.,Compton,D.R.,Pertwee,R.G.,Griffin,G.,Bayewitch,M.,
Barg, J. & Vogel, Z. (1995) Identification of an endogenous
2-monoglyceride, present in canine gut, that binds to cannabinoid
receptors. Biochem. Pharmacol. 50, 83–90.
27. Glass, M. (2001) The role of cannabinoids in neurodegenerative
diseases. Pr og. Neuro-Psychopharmacol. Biol. Psychiat. 25 , 743–
765.
28. Carter, R.J., Lione, L.A., Humby, T., Mangiarini, L., Mahal, A.,
Bates, G.P., Dunnett, S.B. & Morton, A.J. (1999) Characteriza-
tion of progressive motor deficits in m ice transgenic for the human
Huntington’s disease mutation. J. Neurosci. 19, 3248–3257.
29. Hansson, O., Castilho, R.F., Korhonen, L., Lindholm, D., Bates,
G.P. & B rundin, P. (2001) Partial r esistance to malonate-induced
striatal cell death in transgenic m ouse models of Huntington’s
disease is dependent on age and CAG repeat length. J. Neur och em.
78, 6 94–703.
30. Meade, C.A., Deng, Y.P., Fusco, F.R., Del Mar., N., Hersch, S.,
Goldowitz, D. & Reiner, A. (2002) Cellular localization and
development of neuronal intranuclear inclusions in striatal and
cortical neurons in R6/2 transgenic mice. J. Comp. Neurol. 449,
241–269.
31. Cha, J H.J. (2000) Transcriptional dysregulation in Huntington’s
disease. Trends Neurosci. 23, 3 87–392.
32. van Roon-Mom, W.M., Reid, S.J., Jones, A.L., MacDonald,
M.E., F aull, R .L. & Snell, R .G. (2002) Insoluble TATA-binding
protein accumulation in Huntington’s dise ase cortex. Brain R es.
Mol. Br ain Res. 109 , 1–10.
33. Shelbourne, P.F ., K illeen, N ., Hevner, R .F., Johnston, H.M.,
Tecott, L., Lewand oski, M., E nnis, M., R amirez, L., L i, Z., I an-
nicola, C., Littman, D.R. & Myers, R.M. ( 1999) A Huntingt on’s
disease CAG expansion at the murine Hdh lo cus is un stab le and
associated with behavioural a bnormalities in mice. Hum. Mol.
Genet. 8, 763–774.
34. Kennedy, L. & Shelbourne, P.F. (2000) Dramatic mutation
instability in HD mouse s triatum: does polyglutamine load
contribute to cell-specific vulnerability in Hun tington’s disease?
Hum. Mol. Gen et. 9, 2539–2544.
35. Mathews, C.K., v an Holde , K .E. & Ahern, K.G. (2000) Bio-
chemistry, 3rd edn. Addison- Wesley Longman Inc, San Francisco,
p. 1098.
4920 E. A. McCaw et al. (Eur. J. Biochem. 271) Ó FEBS 2004