Towards Computational Models of Visual Aesthetic Appeal of Consumer Videos docx
Bạn đang xem bản rút gọn của tài liệu. Xem và tải ngay bản đầy đủ của tài liệu tại đây (577.19 KB, 14 trang )
Towards Computational Models of Visual
Aesthetic Appeal of Consumer Videos
Anush K. Moorthy
⋆
, Pere Obrador, and Nuria Oliver
Telefonica Research, Barcelona, Spain.
Abstract. In this pap er, we tackle the problem of characterizing the
aesthetic appeal of consumer videos and automatically classifying them
into high or low aesthetic appeal. First, we conduct a controlled user
study to collect ratings on the aesthetic value of 160 consumer videos.
Next, we propose and evaluate a set of low level features that are com-
bined in a hierarchical way in order to model the aesthetic appeal of
consumer videos. After selecting the 7 most discriminative features, we
successfully classify aesthetically app ealing vs. aesthetically unappealing
videos with a 73% classification accuracy using a support vector machine.
Key words: Video aesthetics, video quality, sub jective assessment
1 Introduction
In today’s digital world, we face the challenge of developing efficient multimedia
data management tools that enable users to organize and search multimedia con-
tent from growing rep ositories of digital media. Increasing storage capabilities at
low prices combined with pervasive devices to capture digital images and videos
enable the generation and archival of unprecedented amounts of personal multi-
media content. For eg., as of May 2009, about 20 hours of video footage – most
of it user-generated – were uploaded on the popular video sharing site YouTube
every minute [1]. In addition, the number of user-generated video creators is
expected to grow in the US by 77% from 2008 to 2013 [2].
Text query-based image and video search approaches rely heavily on the
similarity between the input textual query and the textual metadata (e.g. tags,
comments, etc.) that has previously been added to the content by users. Rele-
vance is certainly critical to the satisfaction of users with their search results, yet
not sufficient. For example, any visitor of YouTube will attest to the fact that
most relevant search results to day include a large amount of user generated data
of varying aesthetic quality, where aesthetics deal with the human appreciation
of beauty. Hence, filtering and re-ranking the videos with a measure of its aes-
thetic value would probably improve the user experience and satisfaction with
the search results. In addition to improving search results, another challenge
⋆
A. K. Moorthy is with The University of Texas at Austin, Austin, Texas, USA -
78712. This work was performed when A. K. Moorthy was an intern at Telefonica
Research, Barcelona, Spain.
2 A. K. Moorthy, P. Obrador and N. Oliver
faced by video sharing sites is being able to attract advertisement to the user
generated content, particularly given that some of it is deemed to be “unwatch-
able” [3], and advertisers are typically reluctant to place their clients’ brands
next to any material that may damage their clients’ reputations [4]. We believe
that the aesthetic analysis of such videos may be one of the tools used to au-
tomatically identify the material that is “advertisement worthy” vs. not. Last,
but not least, video management tools that include models of aesthetic appeal
may prove very useful to help users navigate and enjoy their ever increasing –
yet rarely seen – personal video collections.
Here, we focus on building computational models of the aesthetic appeal of
consumer videos. Note that video aesthetic assessment differs from video quality
assessment (VQA) [5] in that the former seeks to evaluate the holistic appeal
of a video and hence encompasses the latter. For example, a low quality video
with severe blockiness will have low aesthetic appeal. However, a poorly lit un-
distorted video with washed-out colors may have high quality but may also be
aesthetically unappealing. Even though image aesthetic assessment has recently
received the attention of the research community [6–10], video aesthetic assess-
ment remains little explored [8].
To the best of our knowledge, the work presented in this paper represents the
first effort to automatically characterize the aesthetic appeal of consumer videos
and classify them into high or low aesthetic appeal. For this purpose, we first
carry out a controlled user study (Section 3) to collect unbiased estimates of the
aesthetic appeal of 160 consumer videos and thus generate ground truth. Next,
we propose low-level features calculated on a per-frame basis, that are correlated
to visual aesthetics (Section 4.1), followed by novel strategies to combine these
frame-level features to yield video-level features (Section 4.2). Note that previous
work in this area has simply used the mean value of each feature across the video
[8], which fails to capture the video dynamics and the peculiarities associated
with human perception [11]. Finally, we evaluate the proposed approach with
the collected 160 videos, compare our results with the state-of-the-art (Section
5), discuss the implications of our findings (Section 6) and highlight our lines of
future work (Section 7).
In sum, the main contributions of this paper are threefold: 1) We carry out
a controlled user study to collect unbiased ground-truth about the aesthetic ap-
peal of 160 consumer videos; 2) we propose novel low-level (i.e., frame-level)
and video-level features to characterize video aesthetic appeal; and 3) we quan-
titatively evaluate our approach, compare our results with the state-of-the-art
and show how our method is able to correctly classify videos into low or high
aesthetic appeal with 73% accuracy.
2 Previous Work
Aesthetic Appeal in Still Images: One of the earliest works in this domain
is that by Savakis et al. [12] where they performed a large scale study of the
possible features that might have an influence on the aesthetic rating of an im-
Visual Aesthetic Appeal of Consumer Videos 3
age. However, no algorithm was proposed to evaluate appeal. In [10], Tong et
al. extracted features – including measures of color, energy, texture and shape
– from images and a two-class classifier (high vs. low aesthetic appeal) was pro-
posed and evaluated using a large image database with photos from COREL
and Microsoft Office Online (high aesthetic appeal) and from staff at Microsoft
Research Asia (low aesthetic appeal). One drawback with this approach is that
some of the selected features lacked photographic/perceptual justification. Fur-
thermore, their dataset assumed that home users are poorer photographers than
professionals, which may not always be true.
Datta et al. [6] extracted a large set of features based on photographic rules.
Using a dataset from an online image sharing community, the authors discovered
the top 15 features in terms of their cross validation performance with respect to
the image ratings. The authors reported a classification (high vs. low aesthetic
appeal) accuracy of 70.12%. Ke et al. [7] utilized a top-down approach, where
a small set of features based on photographic rules were extracted. A dataset
obtained by crawling DPChallenge.com was used and the photo’s average rating
was utilized as ground truth. In [8], Luo and Tang furthered the approach pro-
posed in [7] by extracting the main subject region (using a sharpness map) in
the photograph. A small set of features were tested on the same database as in
[7], and their approach was shown to perform better than that of Datta et al. [6]
and Ke et al. [7]. Finally, Obrador recently proposed a region-of-interest based
approach to compute image aesthetic appeal [9] where the region-of-interest is
extracted using a combination of sharpness, contrast and colorfulness. The size
of the region-of-interest, its isolation from the background and its exposure were
then computed to quantify aesthetic appeal with good results on a photo dataset
created by the author.
Aesthetic Appeal in Videos: To the best of our knowledge, only the work
in [8] has tackled the challenge of modeling video aesthetics, in which their goal
was to automatically distinguish between low quality (amateurish) and high
quality (professional) videos. They applied image aesthetic measures – where
each feature was calculated on a subset of the video frames at a rate of 1 frame
per second (fps) – coupled with two video-specific features (length of the motion
of the main subject region and motion stability). The mean value of each feature
across the whole video was utilized as the video representation. They evaluated
their approach on a large database of YouTube videos and achieved good classi-
fication performance of professional vs. amateur videos (≈ 95 % accuracy).
3 Ground Truth Data Collection
Previous work in the field of image aesthetics has typically used images from
online image-sharing websites [13]. Each of these photo-sharing sites allows users
to rate the images, but not necessarily according to their aesthetic appeal. A few
websites (e.g. Photo.net) do have an aesthetic scale (1-7) on which users rate
the photographs. However, the lack of a controlled test environment implies that
the amount of noise associated with the ratings in these datasets is typically
4 A. K. Moorthy, P. Obrador and N. Oliver
large [14]. In addition, users are influenced in their aesthetic ratings by factors
such as the artist who took the photograph, the relation of the subject to the
photographer, the content of the scene and the context under which the rating is
performed. Hence, a controlled study to collect aesthetic rating data is preferred
over ratings obtained from a website. As noted in [13], web-based ratings are
mainly used due to a lack of controlled experimental ground truth data on the
aesthetic appeal of images or videos. In the area of image aesthetics, we shall
highlight two controlled user studies [9, 12], even though neither of these data
sets was made public.
To the best of our knowledge, the only dataset in the area of video aesthetics
is that used by Luo and Tang [8]. It consists of 4000 high quality (professional)
and 4000 low quality (amateurish) YouTube videos. However, the authors do
not explain how the dataset was obtained or how the videos were ranked. The
number of subjects that participated in the ranking is unknown. It is unclear
if the videos were all of the same length. Note that the length of the video has
been shown to influence the ratings [15]. The content of the videos is unknown
and since the rating metho d is undisclosed, it is unclear if the participants were
influenced by the content when providing their ratings. Finally, the authors do
not specify if the rated videos had audible audio or not. It is known that the
presence of audio influences the overall rating of a video [16].
In order to address the above mentioned drawbacks and to create a publicly
available dataset for further research, we conducted a controlled user study where
33 participants rated the aesthetic appeal of 160 videos
1
. The result of the study
is a collection of 160 videos with their corresponding aesthetic ratings which
was used as ground truth in our experiments. In this section, we detail how the
videos were selected and acquired, and how the study was conducted.
Video Selection: Since the focus of our work is consumer videos, we crawled
the YouTube categories that were more likely to contain consumer generated con-
tent: Pets & Animals, Travel & Events, Howto & Style, and so on. To collect
the videos, we used popular YouTube queries from the aforementioned cate-
gories (i.e., text associated with the most viewed videos in those categories), for
instance, “puppy playing with ball” and “baby laughing”. In addition and in
order to have a wide diversity of video types, we included semantically different
queries that retrieved large numbers (>1000) of consumer videos, such as “Rio
de Janeiro carnival” and “meet Mickey Mouse Disney”. In total, we downloaded
1600 videos (100 videos × 16 queries). A 15 second segment was extracted from
the middle part of each of the videos in order to reduce potential biases induced
by varying video lengths [15]. Each of the 1600 videos was viewed by two of
the authors who rated the aesthetic appeal of the videos on a 5-point Likert
scale. The videos that were not semantically relevant to the search query were
discarded (e.g, “puppy playing with ball” produced videos which had children
and puppies playing together or just children playing together); videos that were
professionally generated were also discarded. A total of 992 videos were retained
from the initial 1600. Based on the mean ratings of the videos – from the two
1
Each video received 16 different ratings by a subset of 16 participants.
Visual Aesthetic Appeal of Consumer Videos 5
sets of scores by the authors after converting them to Z-scores [17], 10 videos
were picked for each query such that they uniformly covered the 5-point range
of aesthetic ratings. Thus, a total of 160 videos – 10 videos × 16 queries – were
selected for the study. The selected videos were uploaded to YouTube to ensure
that they would be available for the study and future research.
User Study: An important reason for conducting a controlled study is the
role that content (i.e., ”what” is recorded in the video) plays in video ratings. As
noted in [13], the assessment of videos is influenced by both their content and
their aesthetic value. We recognize that these two factors are not completely
independent of each other. However in order to create a content-independent
algorithm that relies on low-level features to measure the aesthetic value of a
video, the ground truth study design must somehow segregate these two factors.
Hence, our study required users to rate the videos on two scales: content and
aesthetics, in order to reduce the influence of the former in the latter.
A total of 33 participants (25 male) took part in the study. They had been
recruited by email advertisement in a large corporation. Their ages ranged from
24 to 45 years ( µ = 29.1) and most participants were students, researchers or pro-
grammers. All participants were computer savvy and 96.8 % reported regularly
using video sharing sites such as YouTube. The participants were not tested for
acuity of vision, but a verbal confirmation of visual acuity was obtained. Par-
ticipants were not paid for their time, but they were entered in a $USD 150
raffle. The study consisted of 30 minute rating sessions where participants were
asked to rate both the content and the aesthetic appeal of 40 videos (10 videos
× 4 queries). Subjects were allowed to participate in no more than two rating
sessions (separated by at least 24 hours).
The first task in the study consisted of a short training session involving 10
videos from a “dance” query; the data collected during this training session was
not used for the study. The actual study followed. The order of presentation
of queries for each subject followed a Latin-square pattern in order to avoid
presentation biases. In addition, the order in which the videos were viewed within
each query was randomized. The videos were displayed in the center of a 17-inch
LCD screen with a refresh rate of 60 Hz and a resolution of 1024 × 768 pixels,
on a mid-gray background, and at a viewing distance of 5 times the height of
the videos [18]. Furthermore, since our focus is visual appeal, the videos were
shown without any audio [16].
Before the session began, each participant was instructed as follows. You
will be shown a set of videos on your screen. Each video is 15 seconds long. You
have to rate the video on two scales: Content and Aesthetics from very bad (-2) to
very good (+2). By content we mean whether you liked the activities in the video,
whether you found them cute or ugly for example.
2
You are required to watch each
video entirely before rating it. We were careful not to bias participants toward
any particular low-level measure of aesthetics. In fact, we left the definition fairly
2
Each video was embedded into the web interface with two rating scales underneath:
one for content and the other for aesthetics. The scales were: Very Bad (-2), Bad
(-1), Fair (0), Good (1), Very Go od (2).
6 A. K. Moorthy, P. Obrador and N. Oliver
(a) (b)
Fig. 1. (a) Histogram of aesthetic MOS from the user study. (b) Proposed 2-level
pooling approach, from frame to microshot (level 1) and video (level 2) features.
open in order to allow participants to form their own opinion on what parameters
they believed video aesthetics should be rated on.
During the training session, participants were allowed to ask as many ques-
tions as needed. Most questions centered around our definition of content. In
general, subjects did not seem to have a hard time rating the aesthetics of the
videos. At the end of each query, participants were asked to describe in their own
words the reasons for their aesthetic ratings of the videos. With this question-
naire, we aimed to capture information about the low-level features that they
were using to rate video aesthetics in order to guide the design of our low-level
features. Due to space constraints, we leave the analysis of the participants’
answers to these questions for future work.
The study yielded a total of 16 different ratings (across subjects) of video aes-
thetics for each of the 160 videos. A single per-video visual aesthetic appeal score
was created: First, the scores of each participant were normalized by subtracting
the mean score p er participant and per session from each of the participant’s
scores, in order to reduce the bias of the ratings in each session. Next, the aver-
age score per video and across all participants was computed to generate a mean
opinion score (MOS). This approach is similar to that followed for Z-scores [17].
Thus, a total of 160 videos with ground truth about their aesthetic appeal in
the form of MOS were obtained. Figure 1 (a) depicts the histogram of the aes-
thetic MOS for the 160 videos, where 82 videos were rated below zero, and 78
videos were rated above zero. Even though 160 videos may seem small compared
to previous work [8], datasets of the same size are common in state-of-the-art
controlled user studies of video quality assessment [19].
4 Feature Computation
The features presented here were formulated based on previous work, the feed-
back from our user study and on our own intuition.
The major difference between an image and a video is the presence of the
temporal dimension. In fact, humans do not perceive a series of images in the
Visual Aesthetic Appeal of Consumer Videos 7
same fashion as they perceive a video [5]. Hence, the features to be extracted from
the videos should incorporate information about this temporal dimension. In this
paper, we propose a hierarchical pooling approach to collapse each of the features
extracted on a frame-by-frame basis into a single value for the entire video,
where pooling [11] is defined as the process of collapsing a set of features, either
spatially or temporally. In particular, we perform a two-level pooling approach,
as seen in Fig. 1 (b). First, basic features are extracted on a frame-by-frame
basis. Next, the frame-level features are pooled within each microshot
3
using 6
different pooling techniques, generating 6 microshot-level features for each basic
feature. Finally, the microshot-level features are pooled across the entire video
using two methods (mean and standard deviation), thus generating a set of 12
video-level features for each of the basic frame-level features.
In the following sections we describe the basic frame-level features and their
relationship (if any) to previous work, followed by the hierarchical pooling strat-
egy used to collapse frame-level values into video-level descriptors.
4.1 Frame-Level Features
Actual Frame Rate (f
1
, actual-fps): 29% of the downloaded videos contained
repeated frames. In an extreme case, a video which claimed to have a frame-
rate of 30 fps had an actual new frame every 10 repetitions of the previous
frame. Since frame-rate is an integral part of perceived quality [5] – and hence
aesthetics, our first feature, f
1
, is the “true” frame-rate of the video. In order to
detect frame repetition, we use the structural similarity index (SSIM) [20].
A measure of the perceptual similarity of consecutive frames is given by
Q = 1 − SSIM (small Q indicates high similarity), and is computed between
neighboring frames creating a vector m. To measure periodicity due to frame
insertions, we compute m
th
= {ind(m
i
)|m
i
≤ 0.02}, where the set threshold al-
lows for a small amount of dissimilarity between adjacent frames (due to encod-
ing artifacts). This signal is differentiated (with a first order filter h[i] = [1 −1]),
to obtain dm. If this is a p eriodic signal then we conclude that frames have
been inserted, and the true frame rate is calculated as: f
1
= fps ×
MAX(dm)−1
T
m
,
where T
m
is the number of samples in m corresponding to the period in dm.
Note that this feature has not been used before to assess video aesthetics.
Motion Features (f
2
, motion-ratio, and f
3
, size-ratio): The human visual
system devotes a significant amount of resources for motion processing. Jerky
camera motion, camera shake and fast object motion in video are distracting and
they may significantly affect the aesthetic appeal of the video. While other au-
thors have proposed techniques to measure shakiness in video [21], our approach
stems from the hypothesis that a good consumer video contains two regions: the
foreground and the background. We further hypothesize that the ratio of mo-
tion magnitudes between these two regions and their relative sizes have a direct
impact on video aesthetic appeal.
3
In our implementation a microshot is a set of frames amounting to one second of
video footage.
8 A. K. Moorthy, P. Obrador and N. Oliver
A block-based motion estimation algorithm is applied to compute motion vec-
tors between adjacent frames. Since the videos in our set are compressed videos
from YouTube, blocking artifacts may hamper the motion estimates. Hence, mo-
tion estimation is performed after low-pass filtering and downsampling by 2 in
each dimension, each video frame. For each pixel lo cation in a frame, the mag-
nitude of the motion vector is computed. Then, a k-means algorithm with 2
clusters is run in order to segregate the motion vectors into two classes. Within
each class, the motion vector magnitudes are histogrammed and the magnitude
of the motion vector corresponding to the peak of the histogram is chosen as a
representative vector for that class. Let m
f
and m
b
denote the magnitude of the
motion vectors for each of the classes, where m
f
> m
b
, and let s
f
and s
b
denote
the size (in pixels) of each of the regions respectively. We compute f
2
=
m
b
+1
m
f
+1
and f
3
=
s
b
+1
s
f
+1
. The constant 1 is added in order to prevent numerical instabili-
ties in cases where the magnitude of motion or size tends to zero. These features
have not been used before to characterize video aesthetics.
Sharpness/Focus of the Region of Interest (f
4
, focus): Sharpness is of
utmost importance when assessing visual aesthetics [9]. Note that our focus lies
in consumer videos where the cameras are typically focused at optical infinity,
such that measuring regions in fo cus is challenging. In order to extract the in-
focus region, we use the algorithm proposed in [22] and set the median of the
level of focus of the ROI as our feature f
4
.
Colorfulness (f
5
, colorfulness): Videos which are colorful tend to be seen
as more attractive than those in which the colors are “washed out” [23]. The
colorfulness of a frame (f
5
) is evaluated using the technique proposed in [23].
This measure has previously been used in [9] to quantify the aesthetics of images.
Luminance (f
6
, luminance): Luminance has been shown to play a role in the
aesthetic appeal of images [6]. Images (and videos) in either end of the luminance
scale (i.e., poorly lit or with extremely high luminance) are typically rated as
having low aesthetic value
4
. Hence, we compute the luminance feature f
6
as the
mean value of the luminance within a frame.
Color Harmony (f
7
, harmony): The colorfulness measure does not take into
account the effect that the combination of different colors has on the aesthetic
value of each frame. To this effect, we evaluate color harmony using a variation of
the technique by Cohen-Or et al. [24] where they propose eight harmonic types
or templates over the hue channel in the HSV space. Note that one of these
templates (N-type) corresponds to grayscale images and hence does not apply
to the videos in our study. We compute the (normalized) hue-histogram of each
frame and convolve this histogram with each of the 7 templates
5
. The peak of the
convolution is selected as a measure of similarity of the frame’s histogram to a
particular template. The maximum value of these 7 harmony similarity measures
(one for each template) is chosen as our color harmony feature. Other color
4
A video with alternating low and high luminance values may also have low aesthetic
app eal.
5
The template definitions are the same as the ones proposed in [24].
Visual Aesthetic Appeal of Consumer Videos 9
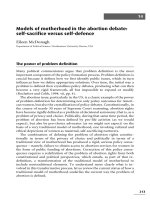
Fig. 2. Rule of thirds: the head of the iguana is placed in the top-right intersecting
point.
harmony measures have been used to assess the aesthetic quality of paintings
[25], and photos and video [8].
Blockiness Quality (f
8
, quality): The block-based approach used in current
video compression algorithms leads to the presence of blocking artifacts in videos.
Blockiness is an important aspect of quality and for compressed videos it has
been shown to overshadow other artifacts [26]. YouTube consumer videos from
our dataset are subject to video compression and hence we evaluate their quality
by looking for blocking artifacts as in [26]. Since this algorithm was proposed for
JPEG compression, it is defined for 8 × 8 blocks only. However, some YouTube
videos are compressed using H.264/AVC which allows for multiple block sizes
[27]. Hence, we modified the algorithm in [26] to account for multiple block sizes.
In our experiments, however, we found that different block sizes did not improve
the performance of the quality feature. Therefore, in our evaluation we use the
8 × 8 block-based quality assessment as in [26] and denote this quality feature as
f
8
. We are not aware of any previously proposed aesthetic assessment algorithm
that includes a blockiness quality measure.
Rule of thirds (f
9
, thirds): One feature that is commonly found in the liter-
ature on aesthetics and in books on professional photography is the rule of thirds
[28]. This rule states that important compositional elements of the photograph
should be situated in one of the four possible power points in an image (i.e., in
one of the four intersections of the lines that divide the image into nine equal
rectangles, as seen in Figure 2). In order to evaluate a feature corresponding to
the rule of thirds, we utilize the region of interest (ROI) extracted as described
above. Similarly to [8], our measure of the rule of thirds (f
9
) is the minimum
distance of the centroid of the ROI to these four points.
4.2 Microshot and Video-Level Features
Once the 8 frame-level features (f
2
to f
9
) have been computed on every frame,
they are combined to generate features at the microshot (i.e., 1 second of video
footage) level which are further combined to yield features at the video level.
We compute 6 different feature pooling techniques for each basic frame level
feature – mean, median, min, max, first quartile (labeled as fourth) and third
quartile (labeled as three-fourths) – in order to generate the microshot-level fea-
10 A. K. Moorthy, P. Obrador and N. Oliver
tures, and we let our classifier automatically select the most discriminative fea-
tures. In this paper we pool microshot-level features with two strategies in or-
der to generate video-level features: average, computed as the mean (labeled
as mean) of the features across all microshots; and standard deviation (labeled
as std), again computed across all microshots in the video. Thus, a bag of 97
video-level features is generated for each video: 8 frame-level basic features × 6
pooling techniques at the microshot level × 2 pooling techniques at the video
level + f
1
.
In the remainder of the paper, we shall use the following nomenclature:
videoLevel-microshotLevel-basicFeature, to refer to each of the 97 features. For
eg., the basic feature harmony (f
7
), po oled using the median at the microshot
level and the mean at the video level would be referred as: mean-median-harmony.
The use of these pooling techniques is one of the main contributions of this pa-
per. Previous work [8] has only considered a downsampling approach at the
microshot level (at 1 fps), and an averaging pooling technique at the video level,
generating one single video level feature for each basic feature, which cannot
model their temporal variability.
5 Experimental Results
Even though one may seek to automatically estimate the aesthetic ratings of
the videos, the subjectivity of the task makes it a very difficult problem to solve
[13]. Therefore, akin to previous work in this area, we focus on automatically
classifying the videos into two categories: aesthetically appealing vs. aesthetically
unappealing. The ground truth obtained in our user study is hence split into
these two categories, where the median of the aesthetic scores is considered as the
threshold. All scores above the median value are labeled as appealing (80 videos)
and those below are labeled as unappealing (80 videos). In order to classify the
videos into these two classes, we use a support vector machine (SVM) [29] with
a radial basis function (RBF) kernel (C, γ) = (1, 3.7) and the LibSVM package
[30] for implementation.
We perform a five-fold cross-validation where 200 train/test runs are carried
out with the feature sets that are b eing tested. We first evaluate the classifi-
cation performance of each of the 97 video-level features individually. The best
performing 14 features in these cross-validation tests are shown in Table 1. The
classification performance of these features is fairly stable: the average standard
deviation of the classification accuracy across features and over the 200 runs is
2.1211 (min = 0.5397, max = 3.2779).
In order to combine individual features, we use a hybrid of a filter-based
and wrapper-based approach, similar to [6]. We only consider the video-level
features that individually perform above 50%. We first pick the video-level fea-
ture which classifies the data the best. All the other video-level features de-
rived from the same basic feature and p ooled with the same video-level pooling
method (i.e., either mean or standard deviation) are discarded from the bag
before the next feature is selected. The next selected feature is the one that
Visual Aesthetic Appeal of Consumer Videos 11
classifies the data the best in conjunction with the first selected feature, and
so on. A 7-dimensional feature vector
6
is thus formed. The selected features in
order of their classification performance after being combined with the previ-
ously selected features are: actual fps (acc=58.8%, σ = 1.5); mean-three-fourth-
colorfulness (acc=67%, σ = 1.8); std-median-thirds (acc=69.5%, σ = 1.9); mean-
fourth-focus (acc=69.6%, σ = 2.2); mean-max-luminance (acc=71%, σ = 1.9);
mean-fourth-quality (acc=72.0%, σ = 1.9); and std-median-focus (acc=73.0%,
σ = 2.0).
An overall classification accuracy of 73.03% is thus obtained. In order to pro-
vide a comparison with previous work, we implemented the algorithm proposed
in [8], achieving a classification accuracy of 53.5%. The poor performance of this
algorithm may be attributed to the fact that it was designed for professional
vs. amateur video classification rather than for classifying consumer videos into
high or low visual aesthetic appeal.
Feature Accura. Feature Accura.
1. actual-fps 58.77% 8. mean-mean-colorfulness 56.34%
2. mean-max-size-ratio 58.68% 9. mean-med-colorfulness 56.21%
3. std-fourth-motion-ratio 58.06% 10. mean-mean-quality 55.73%
4. mean-fourth-quality 57.67% 11. mean-three-fourth-quality 55.70%
5. mean-three-fourth-colorfulness 56.86% 12. mean-max-luminance 55.62%
6. mean-max-colorfulness 56.80% 13. std-three-fourth-motion-ratio 55.19%
7. mean-max-quality 56.62% 14. mean-three-fourth-luminance 55.16%
Table 1. Individual classification accuracy of the top 14-features in descending order
of performance.
Personalization: Personalization has not been explored before in this area
even though it is known that certain aspects of aesthetic sensitivities depend
on individual factors [13]. In this section, we carry out a preliminary analysis
of the personalization of aesthetic ratings. Recall that two of the authors rated
the aesthetic value of 1600 videos. All videos which were semantically irrele-
vant or professionally generated were excluded from the analysis (608 videos or
38%). Video-level features were computed for the remaining 992 videos. Using
the 7-dimensional feature vector previously described, we obtain classification
accuracies of 61.66% (author 1) and 58.17% (author 2).
In order to evaluate the impact that personalization would have on this
dataset, we select the optimum feature combination – using the approach de-
scribed above – for each of the authors. Table 2 depicts the selected features and
their contributions to classification accuracy, yielding classification accuracies
of 63.24% (author 1) and 66.46% (author 2), significantly larger in the case of
author 2 than the accuracies obtained with the non-personalized feature vector.
6
The feature vector is restricted to 7-dimensions due to the relatively small number
of videos in the ground truth (160) and in order to prevent overfitting.
12 A. K. Moorthy, P. Obrador and N. Oliver
Author 1 Author 2
Feature Accura. StdDev Feature Accura. StdDev
actual-fps 58.4% 0.1 mean-fourth-luminance 58.0% 0.2
+ mean-mean-quality 60.2% 0.3 + mean-max-harmony 62.1% 0.5
+ mean-mean-size-ratio 61.2% 0.4 + std-max-quality 64.1% 0.6
+ mean-fourth-harmony 62.3% 0.7 + mean-median-size-ratio 65.0% 0.5
+ std-max-quality 63.2% 0.7 + mean-fourth-focus 66.0% 0.7
+ std-max-size-ratio 63.1% 0.7 + std-fourth-size-ratio 66.1% 0.6
+ mean-max-luminance 63.1% 0.8 + mean-max-thirds 66.4% 0.6
+ std-fourth-thirds 63.2 % 0.9 + std-mean-focus 66.5% 0.7
Table 2. Classification accuracies with personalized feature vectors. Features selected
for each author and their contribution to accuracy - ’+’ indicates that the result was
obtained by combining this feature with the one right above it.
Aesthetics vs. Quality: As we mentioned in the introduction, quality does
not capture all aspects of the aesthetic appeal of a video, but a holistic defini-
tion of aesthetics must include the quality of a video. In order to illustrate the
role that quality plays on aesthetics, we evaluate the performance of the quality
features – blockiness quality (f
8
) and actual frames-per-second (f
1
) – on the
aesthetics classification. Hence, a quality feature vector is created by combining
the actual fps measure (f
1
) and the blocking quality pooling strategy that gives
the best performance (mean-fourth-quality). This vector when used for classi-
fication yields an accuracy of 58.0%, which suggests that even though quality
is an integral part of aesthetics, the aesthetic value of a video encompasses el-
ements beyond traditional measures of quality. When adding the focus feature
(f
4
), arguably a quality feature also, particularly the std-median-focus feature,
the overall performance increases to 60.0%, still well below the performance ob-
tained when using the best performing 3 aesthetics features: 69.5%, as previously
explained.
6 Discussion
Apart from the actual-fps feature (f
1
), the rest of the features that were au-
tomatically selected to classify the aesthetic value of videos correlate well with
previous research and intuition. For example, the third quartile of the colorful-
ness feature (f
5
) would indicate that the maximum colorfulness value is probably
noise, and the statistical measure of third quartile is a stable indicator of colorful-
ness. Again, the first quartile of the quality feature (f
8
) correlates with research
in image quality assessment [11]. Further, quality features alone do not seem to
capture all the elements that characterize the aesthetic value of consumer videos.
The standard deviation of the focus feature (f
4
) is again intuitive in the
sense that humans tend be more sensitive to changes in focus rather than its
absolute value. This is also true for the rule-of-thirds feature (f
9
), which is a
measure of how well the main subject is framed in the video. Even though the
Visual Aesthetic Appeal of Consumer Videos 13
motion features that we computed were not selected in the final feature vector, on
their own these features performed well (see Table 1) and seemed to be useful for
personalization (Table 2). Given that the number of videos in the personalization
dataset is large and that motion features on their own seem to correlate well with
perception, we hypothesize that increasing the number of videos in the current
dataset (which we plan to undertake in the future) will result in a selection of
the motion features as well.
7 Conclusions and Future Work
In this paper, we have proposed a hierarchical approach to characterize the
aesthetic appeal of consumer videos and automatically classify them into high
or low aesthetic appeal. We have first conducted a controlled user study to
collect human ratings on the aesthetic value of 160 consumer videos. Next, we
have proposed 9 low-level features to characterize the aesthetic appeal of the
videos. In order to generate features at the video level, we have proposed and
evaluated various pooling strategies (at the microshot and video levels) based
on statistical measures. Based on the collected ground truth ratings, we have
automatically selected 7 features at the video-level and have classified the videos
into high vs. low aesthetic appeal with 73% classification accuracy, compared to
53.5% classification accuracy of a state-of-the-art algorithm. The videos and the
subjective ratings have been made available publicly
7
.
We plan on increasing the number of videos in our ground truth database
and conduct a larger scale user study. Future work includes exploring temporal
models to characterize video aesthetics, investigating personalization techniques
and shedding light on which features of our aesthetics model may be universal
vs. person-dependent, and assessing the influence of audio in aesthetic ratings so
as to form a complete measure of audio-visual aesthetics. Finally, we also plan to
develop novel aesthetics-assisted hierarchical user interfaces to allow end users
to efficiently navigate their personal video collections.
References
1. Junee, R.: 20 Hours of Video Uploaded Every Minute! http://youtube-
global.blogsp ot.com/ (2009)
2. Verna, P.: A Spotlight on UGC Participants.
(2009)
3. Wayne, B. (2009)
4. Messaris, P.: Visual persuasion: the role of images in advertising. Sage Publications
Inc. (1997)
5. Wang, Z., Sheikh, H.R., Bovik, A.C.: Objective video quality assessment. The
Handb ook of Video Databases: Design and Applications (2003) 1041–1078
6. Datta, R., Joshi, D., Li, J., Wang, J.: Studying aesthetics in photographic images
using a computational approach. Lec. Notes. in Comp. Sci. 3953 (2006) 288
7
/>14 A. K. Moorthy, P. Obrador and N. Oliver
7. Ke, Y., Tang, X., Jing, F.: The design of high-level features for photo quality
assessment. IEEE Conf. Comp. Vis. Pat. Recog. 1 (2006)
8. Luo, Y., Tang, X.: Photo and video quality evaluation: Focusing on the subject.
Eur. Conf. Comp. Vis. (2008) 386–399
9. Obrador, P.: Region based image appeal metric for consumer photos. IEEE Work.
Mult. Sig. Proc. (2008) 696–701
10. Tong, H., Li, M., Zhang, H., He, J., Zhang, C.: Classification of digital photos
taken by photographers or home users. Lec. Notes. in Comp. Sci. (2004) 198–205
11. Moorthy, A.K., Bovik, A.C.: Visual importance pooling for image quality assess-
ment. IEEE Jnl. Sel. Top. Sig. Proc. 3 (2009) 193–201
12. Savakis, A.E., Etz, S.P., Loui, A.C.: Evaluation of image appeal in consumer
photography. SPIE Proc., Human Vis. Elec. Img. (2000) 111–121
13. Datta, R., Li, J., Wang, J.: Algorithmic Inferencing of Aesthetics and Emotion in
Natural Images: An Exposition. IEEE Intl. Conf. Image Proc. (2008) 105–108
14. Amatriain, X., Pujol, J.M., Oliver, N.: I Like It, I Like It Not. Proceedings Int.
Conf. UMAP’09 (2009)
15. Pinson, M.H., Wolf, S.: Comparing subjective video quality testing methodologies.
Vis. Comm. and Imag., SPIE 5150 (2003) 573582
16. Beerends, J.G., De Caluwe, F.: The influence of video quality on perceived audio
quality and vice versa. Jnl. Aud. Engg. Soc. 47 (1999) 355–362
17. van Dijk, A.M., Martens, J.B., Watson, A.B.: Quality asessment of coded images
using numerical category scaling. SPIE Adv. Image Video Comm. Storage Tech.
2451 (1995) 90–101
18. BT.: 500-11: Methodology for the subjective assessment of the quality of television
pictures International Telecommuncation Union, Geneva, Switzerland (2002)
19. LIVE video quality assessment databases: ( />20. Wang, Z., Bovik, A.C., Sheikh, H.R., Simoncelli, E.P.: Image quality assessment:
From error visibility to structural similarity. IEEE Tran. Image Proc. 13 (2004)
600–612
21. Yan, W., Kankanhalli, M.: Detection and removal of lighting & shaking artifacts
in home videos. Proc. ACM Conf. Mult. (2002) 107–116
22. Dai, Z., Wu, Y.: Where Are Focused Places of a Photo? Lec. Notes. in Comp. Sci.
4781 (2007) 73
23. Hasler, D., Susstrunk, S., GmbH, L., Steinfurt, G.: Measuring colourfulness in
natural images. SPIE/IS&T Hum. Vis. Elec. Img. 5007 (2003) 87–95
24. Cohen-Or, D., Sorkine, O., Gal, R., Leyvand, T., Xu, Y.: Color harmonization.
Pro c. ACM SIGGRAPH 25 (2006) 624–630
25. Li, C., Chen, T.: Aesthetic Visual Quality Assessment of Paintings. IEEE Jnl. Sel.
Top. Sig. Proc. 3 (2009) 236–252
26. Wang, Z., Sheikh, H.R., Bovik, A.C.: No-reference perceptual quality assessment
of JPEG compressed images. IEEE Intl. Conf. Image Proc. 1 (2002) 477–480
27. Richardson, I.: H. 264 and MPEG-4 video compression: video coding for next-
generation multimedia. John Wiley & Sons Inc (2003)
28. Freeman, M.: The image. revised edn. William Collins Sons & Co Ltd (1990)
29. Vapnik, V.: The Nature of Statistical Learning Theory. Springer Verlag (2000)
30. Chang, C., Lin, C.: LIBSVM: a library for support vector machines.
cjlin/libsvm/ (2001)