Which Aesthetic Has the Greatest Effect on Human Understanding? pdf
Bạn đang xem bản rút gọn của tài liệu. Xem và tải ngay bản đầy đủ của tài liệu tại đây (908.54 KB, 14 trang )
Which Aesthetic Has the Greatest Effect
on Human Understanding?
Helen Purchase
Department of Computer Science and Electrical Engineering,
The University of Queensland, Australia
Abstract. In the creation of graph drawing algorithms and systems,
designers claim that by producing layouts that optimise certain aesthetic
qualities, the graphs are easier to understand. Such aesthetics include
maximise symmetry, minimise edge crosses
and
minimise bends.
A previous study aimed to validate these claims with respect to three
aesthetics, using paper-based experiments [11]. The study reported here
is superior in many ways: five aesthetics are considered, attempts are
made to place a priority order on the relative importance of the aesthet-
ics, the experiments are run on-line, and the ease of understanding the
drawings is measured in time, as well as in the number of errors. In addi-
tion, greater consideration is given to the possible effect of confounding
factors in the graph drawings.
The results indicate that reducing the number of edge crosses is by far
the most important aesthetic, while minimising the number of bends and
maximising symmetry have a lesser effect. The effects of maximising the
minimum angle between edges leaving a node and of fixing edges and
nodes to an orthogonal grid are not statistically significant.
This work is important since it helps to demonstrate to algorithm and
system designers the aesthetic qualities most important for aiding human
understanding, the most appropriate compromises to make when there
is a conflict in aesthetics, and consequently, how to build more effective
systems.
1 Introduction
Automatic graph drawing algorithms produce a diagram which represents an
underlying graph structure. The aim of the layout process is to depict relational
information in a form that makes it easier to read, understand and use. Designers
of such algorithms ensure that certain aesthetics are optimised, and claim that by
doing do, the resultant graph drawing helps the human reader to understand and
remember the information embodied in the graph. Examples of these aesthetics
include:
symmetry
(where possible, a symmetrical view of the graph should be
displayed [5, 10]),
minimise edge crosses
(the number of edge crosses in the
display should be minimised [6]), and
minimise bends
(the total number of bends
in polyline edges should be minimised [13, 15]).
249
It is important that human experiments be performed on these aesthetics, so
that, rather than judging an algorithm by its computational efficiency in con-
forming to these aesthetics, the aesthetics themselves can be judged with respect
to how much they assist human comprehension. Many application domains may
make use of automatic graph layout algorithms in order to display relational
data in a holistic form: e.g. entity relationship diagrams [1], object oriented de-
sign diagrams [4], social networks [3]. If the designers of automatic graph layout
algorithms are to claim that their algorithms will illuminate the information em-
bodied therein, it is important that they know that the aesthetic basis for their
work is sound.
Many algorithms consider more than one aesthetic in their attempt to create
an illuminating graph drawing. For this reason, although the individual aesthet-
ics themselves are important, often it is the combination or prioritisation of the
aesthetics that is most useful. Algorithm designers may need to compromise
between more than one aesthetic. For example, in the creation of a particular
drawing, minimising the number of crosses may also result in a decrease in sym-
metry. The knowledge that minimising the number of crosses is of more benefit
to understandability than maximising symmetry [11], means that an appropriate
compromise can be made.
The previous study performed preliminary paper-based experiments on the
human understanding of graph drawings to determine whether three aesthetic
criteria (crosses, bends and symmetry) did indeed assist with the understanding
of the underlying graph structure. While the hypotheses were confirmed in the
case of crosses and bends, there was not enough evidence to either support or
reject the symmetry hypothesis.
In this experiment, five aesthetics were considered; there are therefore five
primary hypotheses:
- Bends (b):
Increasing the number of edge bends in a graph drawing decreases the un-
derstandability of the graph.
- Crosses
(c):
Increasing the number of edge crosses in a graph drawing decreases the
understandability of the graph.
-
Angles (In):
Maximising the minimum angle between edges leaving the nodes in a graph
drawing increases the understandability of the graph.
-
Orthogonality (o):
Fixing nodes and edges to an orthogonal grid increases the understandability
of the graph.
-
Symmetry (s):
Increasing the symmetry displayed in a graph increases the understandability
of the graph.
250
Briefly, the experiment entailed subjects answering questions about a num-
ber of different drawings of the same graph. Each drawing was drawn such that
it varied the aesthetics under consideration in a fixed manner: for example, one
drawing had a large number of crosses, while another had less. Measurements
were taken of both the number of errors made and the time taken to answer the
questions. Using statistical tests, the five primary hypotheses associated with the
five different aesthetics under consideration were proved or disproved. In addi-
tion, both for the set of "easy" drawings as well as the set of "difficult" drawings,
Tukey's WSD pairwise comparison procedure was then used to determine if there
were significant understandability priorities between the aesthetics.
Experiments were run online to study these five aesthetics, and the results
indicate that crosses is by far the most important aesthetic. Bends and sym-
metry have a lesser effect, and maximising the minimum angle and maximising
orthogonality have no significant effect at all. This paper describes the nature of
the on-line system used for the experiments and the experimental methodology
(the graph drawings, experiment and the data), and presents and discusses the
results.
2 The Experiment
2.1 Definition
There are two ways in which understandability may be measured. A purely rela-
tional method measures the etticiency and accuracy with which people can read
a graph structure and answer questions about it. Such graph-theoretic questions
need to be generic and application-independent, and may include questions of the
form "What is the shortest path from node A to node B?" A more application-
specific method would rather consider a graph interpretation task: in this case
it is more appropriate that the effectiveness of the graph drawing is measured
within the context in which the application-specific graph is usually used. Thus,
instead of eliciting answers to specific questions asked about the graph itself, it is
more suitable to look at whether the graph has assisted the user in accomplishing
a particular application task. Suitable questions for this approach would include
(in the area of software engineering) "What object classes would be affected by
changing the external interface to class X?"
In this experiment, the relational reading of a graph drawing is considered,
leaving the interpretive consideration of aesthetics for a later study. The ques-
tions that are used in this experiment to measure relational understandability
are:
- How long is the shortest path between two given nodes?
-
What is the minimum number of nodes that must be removed in order to
disconnect two given nodes such that there is no path between them?
- What is the minimum number of edges that must be removed in order to
disconnect two given nodes such that there is no path between them?
251
2.2 Scope
A preliminary, more limited, study [11] reported comparable conclusions to those
reported here. The study reported here improves on this previous study in a
number of important ways, greatly increasing the validity and relevance of the
results:
- Metric definitions: New metrics for all five aesthetics have been defined
[12]. These are all scaled to lie between 0 and 1, where 0 represents an
amount of the aesthetic that it is assumed makes the drawing
difficult
to
read (e.g. not much orthogonality), while 1 represents an amount of the
aesthetic that it is assumed makes the drawing
easy
to read (e.g. not many
crosses). A new metric for symmetry has been defined, which more closely
represents perceptual symmetry than the one used previously. It takes into
account both global and local symmetries, weighting them by their a~'ea, and
also considers the effects of crosses and bends on perceptual symmetry.
- Presentation medium: The experiments are performed online using an
experimental system especially designed and implemented for experiments
like these. This means that the understandability of the graph drawings is
tested using a more valid medium: automatic graph layout algorithms by
definition make use of a computer, with the results displayed on a screen,
rather than on paper. Experiments where subjects read graph drawings on
a screen are therefore more valid than similar paper-based experiments.
- Dependent variables: The use of the online system enables two dependent
variables to be recorded: the time taken for the subject to answer the question
(the "reaction time"), as well as the correctness of the answer. This enables
analysis to be performed on two measures of understanding.
- Confounding factors: In the drawings that vary a particular aesthetic, it
is important that the values of the other four aesthetics are kept constant,
to ensure that there is no confbunding of variables. It is difficult, and in
some cases impossible, to use the extremes of 0 or 1 as the constant value
for the other four aesthetics: for example, a metric value of 0 for the bend
aesthetic would imply a maximum possible number of bends; a metric value
of 1 for minimum angle aesthetic would mean that
all
nodes in the drawing
have the optimum angles between its edges (impossible for any cyclic graph).
For this reason, a "neutral range" was defined for each aesthetic (based on
perception), and for the drawings which varied a particular aesthetic, values
of the other four aesthetics were kept within these specified ranges.
- Location of nodes: The questions that are asked about the drawings refer
to nodes that are highlighted in black on the screen, to distinguish them from
the other nodes. The relevant nodes are therefore obvious to the subjects, and
the time measured for the subject to answer the question does not include
additional time taken for locating the important nodes. The previous study
referred to the nodes by labels [11].
252
2.3 The Online System
Experiments were run online. Each subject interacted with a unique experi-
mental program. These programs were created by a system designed and im-
plemented for the purposes of running experiments relating to graph drawings
(called SAGE). The main features of SAGE are:
- Flexibility: so that SAGE can be used for further graph-drawing experimen-
tation, each experiment is specified with an external contents file.
- Randomness: the ordering of graph drawings, their orientation, the ordering
of the questions, and the selection of node-pairs for the questions are all able
to be randomised.
- Graph and question flexibility: the graph drawings and questions used are
defined in separate files, and are easily changed. 1
-
Completeness: all the interface features required for each graph drawing
display are provided and specified in the contents file: text, pictures, input
fields, pushbuttons.
- Robustness: SAGE can withstand the unexpected input of a novice user, and
efficiently and correctly represents the experiment as defined in the contents
file.
- Analysable data: the results for each subject are generated automatically as
a list of the time between the display of each drawing and question and the
entry of an answer, the answer itself, and its correctness.
2.4 The Graphs
The graph for this experiment was carefully designed so that node-pairs could
be identified which gave a suitable range of values for the three questions. Thus,
a set of node-pairs was defined that would give correct answers to the first
question (the shortest path) of either 2, 3, 4 or 5; a set of node-pairs was defined
that would give correct, answers to the second question (the number of nodes to
remove) of either 1 or 2; and a set of node-pairs was defined that would give
correct answers to the third question (the number of edges to remove) of either
1, 2 or 3. The graph has 16 nodes and 28 edges.
New metric formulae (all lying within the range 0 to 1) were defined for this
experiment, including a more extensive definition of symmetry [12]. Ten experi-
mental graphs were created, two for each of the aesthetics (representing a strong
or weak presence of the aesthetic). For convenience, the graph drawings are called
after the aesthetic that they consider (b, e, m, o, s), and + or - depending on
the strength of the aesthetic: + indicates a high aesthetic value (i.e. assumed
to be easy to read), and - indicates a low aesthetic value (i.e. assumed to be
1 The graph drawings are in GRAPHED format [8], and the questions are in Ascii.
253
difficult to read). Thus, the s+ drawing has a symmetry metric value closer to
1 than the s- drawing.
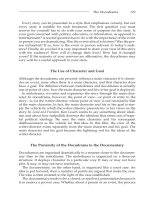
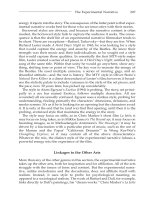
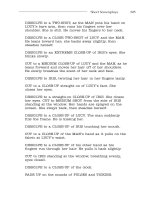
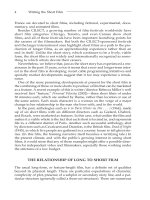
Figures 1 and 2 show the ten graph drawings, and their associated metric
values. Note that because of the nature of the aesthetics, the metrics cannot be
sensibly compared over the aesthetic dimension. Thus, while c- has a cross-less
value of 0.87, In- has a value of 0.16; s+ has a symmetry value of 0.96, o+ has
an orthogonality value of 0.46. This variation is due to the metric definitions
and distributions: it does not affect the results, as the important feature is the
variation of the values
within
the aesthetic dimension. 2
Due to the careful manipulation of aesthetics that was required, some of these
drawings may look strangely awkward (e.g. b-, In-). As the aim was to consider
the effect of the individual aesthetics (rather than drawings that may feasibly be
produced by layout algorithms, or that have been purposefully drawn "neatly"),
the artificial nature of some of the drawings was both intentional and necessary.
2.5 Experimental Methodology
The structure of the experiment was similar to the previous paper-based prelim-
inary investigation [11]. The contents file used by SAGE defined experimental
programs of the following form:
1. A brief description of graphs, and definitions of the terms
node, edge, path,
and
path length
were presented, followed by an explanation of the three
questions that the subjects were required to answer about the experimental
graphs. A simple example graph drawing, with the three questions and their
correct answers, was shown. At this stage, the subjects were asked if they
had any questions about graphs in general, or about the experiment. It was
important to ensure that all the subjects knew what was expected of them.
2. The three questions were asked of six "practise" graph drawings, to famil-
iarise the subjects with the nature of graph drawings and the questions, and
to ensure that they were comfortable with the task, before tackling the ex-
perimental graphs. The subjects were not told that these graph drawings
were not experimental.
3. A "filler" task which engaged the subjects' mind on a small problem unre-
lated to graphs was presented. This ensured that their performance on the
subsequent experimental graphs was not affected by any follow-on effect from
the practise graphs. A simple logic puzzle, designed to take approximately 1
minute, was used.
4. The ten experimental graph drawings were each displayed three times, once
for each question. The order of presentation of the drawings and the questions
was random, as was the orientation of the drawings.
2 The metric definitions give more detail on the extremes of the metric values [12].
254
graph bend-less cross-less minangle orthog sym
b+ 0.96 0.97 0.38 0.27 0.75
b- 0.47 0.99 0.44 0.28 0.71
c+ ~ 0.82 1 0.46 0.33 D.63
c- 0.87 0.88 0.35 0.29 [}.84
m-t- 0.71 0.98 0.62 0.22 0.74
m- ~ 0.82 0.98 0.16 0.26 0.79
Fig. 1. Six of the ten experimental graph drawings, and their aesthetic values.
255
graph bend-less cross-less minangle orthog sym
o+ ~ 0.82 0.98 0.42 0.46 0.73
o- 0.82 0,98 0.41 0.21 0,68
s+ ~ 0.77 0.99 0.57 0.29 0.96
s- ~ 0.87 0.99 0.44 0.25 0.00
Fig. 2. Four of the ten experimental graph drawings, and their aesthetic values.
The questions themselves were randomised too: although the same three
questions were asked of each drawing, the pair of nodes chosen for each
question was randomly selected from a list of node-pairs (as defined in an
external question file). This ensured that any variability in the data could
not be explained away by the varying difficulty of the questions. The two
relevant nodes for each question were highlighted in black on the screen,
ensuring that reaction time did not include time taken to locate the nodes.
The subjects typed their answers to the questions: the time taken for their
answer, and the correctness of the answer, was recorded.
The experiment was therefore controlled for the questions and the graphs,
the independent variable was the value of the aesthetics in each drawing, and
the two dependent variables were the time taken to answer the questions, and
the number of errors made for each drawing.
256
A within-subjects analysis method was used in order to reduce any vari-
ability that may have been attributable to the difference between the subjects
(e.g. age, experience). Any learning effect was minimised by the large number
of graphs used in the experiment, the inclusion of the practise graphs, and the
randomisation of the ordering of the graph drawings.
55 second-year computer science students at The University of Queensland
took part in the experiment, for a reward of $10. For each subject and for each
drawing, the total number of errors was recorded, as well as the total time taken
to answer all three questions.
3 Results
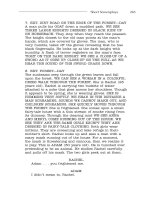
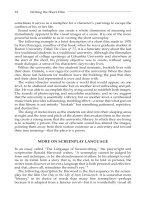
The average number of errors and the average reaction time for the ten experi-
mental graph drawings are shown in both tabular and chart form in Fig. 3.
3.1 Testing the Five Individual Hypotheses
To test the five primary hypotheses, one for each aesthetic, first the significance of
the effects of the level of diffÉculty (the q-/- dimension) needed to be confirmed.
After this confirmation that the q-/- dimension had indeed affected the error
and reaction time data collected, each individual aesthetic was then tested for
its contribution to this overall effect. This analysis was performed for both errors
and reaction time.
Results. The 2x5 within-subject analysis of variance showed that: 3
- The main effect of the level of difficulty (the q-/- dimension) was
significant
for both errors
(F1,54=14.89,a=.05)
and reaction time (F1,54=40.67,a=.05).
-
The simple effect of the bends metric was
significant
for errors
(F1,54=14.49,a=.O1)
but only
approaches significance
for reaction time
(F1,54=5.84,a=.01).
- The simple effect of the
crosses
metric was
significant
for both errors
(F1,54=24.25,a=.01), and reaction time (FL54=87.98,a=.01).
-
The simple effect of the minimum angle metric was
not significant
for both
errors (F],54=0.09,NS) and reaction time (F1,54=3.05,NS).
- The simple effect of the orthogonality metric was
not significant
for both
errors (F1,54=0.00,NS) and reaction time (F1,54=l.44,NS).
- The simple effect of the symmetry metric was
not significant
for errors
(F1,54=O.O9,NS),
but was
significant
for reaction time
(F1,54=7.57,a=.01).
3 The statistical analysis used here is a standard ANOVA analysis [9], based on the
critical values of the F distribution: a is the level of significance, and results that are
not significant are indicated by NS.
257
b+ b- c+ c- m+ m- o+ o- s+ s-
errors 0.24 0.53 0.29 0.80 0.36 0.38 3.36 0.36 0.29 0.31
reaction time 67.18 81.40 66,39 139.78 76.55 68.17 71,3776.71 55.58 67.74
0
&
e~
<
0.9
0.8
0.7
0.6
0.5
0.4
0.3
0.2
0.1
0
M
b+b-
1
C+ C-
m+m-
o+o-
l
S+ S-
14C
13C
-~ 12(
Q
o
N 11(
o
~ 90
©
N 80
< 70
60
50
b+b- c+c-
It1
m+m-
O+ O-
S+
S-
Fig. 3. The average reaction time and average number of errors for each graph drawing.
3.2 Prioritising the Aesthetics
To determine the relative effect of the aesthetics, and attempt to place a prior-
ity ordering on their importance, both the set of + drawings and the set of -
drawings needed to be tested for the overall effect of the aesthetics. Those sets
of drawings for which the effect of the aesthetics were significant were then sub-
ject to a ~hkey's pairwise comparison [9] to determine which aesthetics differed
significantly from one another.
258
Results. The 2x5 within-subject analysis of variance showed that:
-
The main effect of the aesthetics dimension was
significant
for both errors
(F4,216=4.16,a'=.05) and reaction time (F4,216=28.49,a=.05).
The- drawings:
- The simple effects of the five different aesthetics were
significant
for the error
data (F4,216=9.60,a=.025).
The Tukey's WSD pairwise comparisons procedure showed that, for the er-
ror data, crosses were significantly different from all other aesthetics: for
bends (Fs,216=9.11,a=.05), minimum angle (F~,216=22.05,a=.05), orthog-
onality
(Fs,216=24.20,a=.05), symmetry (Fs,216=30.01,a=.05). There were
no other significant pairwise differences.
- The simple effects of the five different aesthetics were
significant
for reaction
time
(F4,216=50.89,a=.025).
The Tukey's WSD pairwise comparisons procedure showed that, for the re-
action time data, crosses were significantly different from all other aesthetics:
for bends (Fs,21e=95.09,a=.05), minimum angle (Fs,216=143.07,a=.05), or-
thogonality (Fs,~le=110.98,a=.05), symmetry (Fs,216=144.79,a=.05). There
were no other significant pairwise differences.
The -F drawings:
- The simple effects of the five different aesthetics were
not significant
for the
error data (F4,216=l.02,NS).
- The simple effects of the five different aesthetics were
significant
for the
reaction time data (JF4,216=4.68,a=.025).
The Tukey's WSD pairwise comparisons procedure showed that, for the re-
action time data, symmetry was significantly different from the minimum
angle (Fs,216=17.14,a=.05), and orthogonality
(F~,~lG=9.72,a=.05).
3.3 Analysis
The error chart in Fig. 3 shows that the average number of errors for the -
versions of the drawings (i.e., the "difficult" drawings) was greater than the
average number of errors tbr the -I- versions, in all cases except orthogonality
when the averages were the same. The statistical analysis shows that the level
of difficulty of the drawings was only significant for both bends and crosses.
The Tukey's pairwise comparison for the error data showed that the average
number of errors for the c- drawing was significantly greater than the errors in
the other - versions of the aesthetics, and that there were no significant pairwise
orderings for the -F drawings.
259
The reaction time chart in Fig. 3 shows that - versions of the bends, crosses,
orthogonality and symmetry drawings all took longer than the 4- versions. The
statistical analysis shows that the level of difficulty of the drawings was only
significant for both crosses and symmetry. The unexpected reversal of average
reaction time for the two minimum angle drawings is not significant, and can
therefore be attributed to chance.
The Tukey's pa~rwise comparison for the reaction time data showed that
the c- drawing took significantly more time than all the other - versions of the
aesthetics. In addition, the sT drawing took significantly less time than the
minimum angle m-t- and orthogonality o4- drawings.
3.4 Discussion
There is no doubt that the evidence is overwhelmingly in favour of crosses as
being the aesthetic that affects human relational graph reading the most, as
suggested by the results of the two Tukey pairwise comparison tests performed
on the - drawings. The effect of crosses was not noticeable, however, in the
4- drawings, implying that crosses are only more problematic than the other
aesthetics when there are a large number of them.
The results of the other aesthetics are more ambivalent: the bends and sym-
metry hypotheses were supported either for reaction time or errors, but not
both. Orthogonality and minimum angle had no effect on the subjects' rela-
tional graph reading at all. The Tukey test for the reaction time data for the 4-
drawings showed that symmetry took significantly less time than the minimum
angle and orthogonality, suggesting that symmetry only has a more positive
effect than the other aesthetics when it is at a maximum value.
An unusual result was that for the easy drawings, the different aesthetics
had no significant effect on the number of errors (even though there was an
effect on reaction time). This suggests that the subjects tended to give correct
answers on all aesthetics if the drawings were easy, but they used all the time
necessary, requiring different amounts of time for the different aesthetics. On
the other hand, for the difficult drawings, subjects took the amount of time
necessary (which differed for the different aesthetics), but the difficulty of the
drawings meant that the number of errors was also differentially affected for
different aesthetics.
In interpreting the above result, errors can be interpreted as a measure of
the amount of processing required to get the question right, while reaction time
can be interpreted as a measure the perceptual processing and comprehension
of the drawing.
260
Limitations. It is common knowledge that all experiments are limited by their
parameters, and that the results of any experiment should always be interpreted
with respect to the experimental limitations [7]: this is an inevitable consequence
of the controlled experimental method. These results can therefore only be inter-
preted within the context of the graph and tasks specified. There may also be a
generalisability restriction on the nature of the subjects, who were all computer
scientists: although as a within-subject analysis was performed, any variations
in expertise were controlled.
4 Conclusions
These aim of these empirical tests was to indicate to the designers of graph
drawing algorithms the most effective aesthetics to use from the point of view of
human reading of relational information. The results show that there is strong
evidence to support minimising crosses, and weaker evidence for minimising the
number of bends and maximising perceptual symmetry. Maximising the orthog-
onal structure of the drawing, and maximising the minimum angles between
edges leaving a node, appear to have little effect.
There is still much work to do in this area: this experiment has only con-
sidered the relational reading of graph drawings, and different results may be
forthcoming from experiments that require an interpretive reading of graph draw-
ings in the context of application domains. For example, testing the effect of the
different aesthetics when the graph drawings represent object-oriented design
diagrams or data-flow diagrams may produce different results.
In addition, another possible study could consider the relational understand-
ability of graph drawings generated by different layout algorithms which aim to
maximise the effect of particular aesthetics: it would be interesting to see whether
the results obtained from that experiment are compatible with the results of the
study reported here.
Acknowledgements
I am grateful to Robert Cohen (who assisted with the initial experimental defini-
tion), to Murray James (who designed and developed SAGE), to David Leonard
(who helped define and implement the aesthetic metrics), to Julie McCreddon
(who assisted extensively with the statistical analysis), and the Australian Re-
search Council~ which funded this work.
261
References
1. C. Batini, M. Talamo, and R. Tamassia. Computer aided layout of entity-
relationship diagrams.
Journal of Systems and Software,
4:163-173, 1984.
2. S. Bhanji, H.C. Purchase, R.F. Cohen, and M.I. James. Validating graph drawing
aesthetics: A pilot study. Tedmical Report 336, University of Queensland Depart-
ment of Computer Science, 1995.
3. J. Blyth, C. McGrath, and D. Krackhardt. The effect of graph layout on inference
from social network data. In F. Brandenburg, editor,
Proceedings of Graph Draw-
ing Symposium 1995.
Springer-Verlag, Passau, Germany, 1995. Lecture Notes in
Computer Science, 1027.
4. G. Booch.
Object-Oriented Design.
Benjamin-Cummings, 1990.
5. P. Eades. A heuristic for graph drawing.
Congressus Numerantium,
42:149-160,
1984.
6. D. Ferrari and L. Mezzalira. On drawing a graph with the minimum number of
crossings. Technical Report 69-11, Istituto di Elettrotecnica ed Elettronica, Po-
litecnico di Ivlilano, 1969.
7. R. Gottsdanker.
Experimenting in Psychology.
Prentice-Hall, 1978.
8. M. Himsolt. GRAPItED user manual. Universit/it Passau, 1990.
9. P.R. Hinton.
Statistics Explained.
Routledge, 1995.
10. R. Lipton, S. North, and J. Sandberg. A method for drawing graphs. In
Proc.
ACM Syrup. on Computational Geometry,
pages 153-160, 1985.
11. H.C. Purchase, R.F. Cohen, and M. James. An experimental study of the basis
for graph drawing algorithms.
A CM Journal of Experimental Algorithmics,
2(4),
1997.
12. H.C. Purchase and D. Leonard. Graph drawing aesthetic metrics. Technical Re-
port 361, University of Queensland Department of Computer Science, 1996.
13. R. Tamassia. On embedding a graph in the grid with the minimum number of
bends.
SIAM J. Computing,
16(3):421-444, 1987.
14. R. Tamassia, G. Di Battista, and C. Batini. Automatic graph drawing and read-
ability of diagrams.
IEEE Transactions on Systems, Man and Cybernetics,
SMC-
18(1):61-79, 1988.
15. H. Trickey. Drag: A graph drawing system. In
Proc. Int. Conf. on Electronic
Publishing,
pages 171-182. Cambridge University Press, 1988.