Báo cáo khoa học: "Optimising Information Presentation for Spoken Dialogue Systems" pdf
Bạn đang xem bản rút gọn của tài liệu. Xem và tải ngay bản đầy đủ của tài liệu tại đây (403.37 KB, 10 trang )
Proceedings of the 48th Annual Meeting of the Association for Computational Linguistics, pages 1009–1018,
Uppsala, Sweden, 11-16 July 2010.
c
2010 Association for Computational Linguistics
Optimising Information Presentation for Spoken Dialogue Systems
Verena Rieser
University of Edinburgh
Edinburgh, United Kingdom
Oliver Lemon
Heriot-Watt University
Edinburgh, United Kingdom
Xingkun Liu
Heriot-Watt University
Edinburgh, United Kingdom
Abstract
We present a novel approach to Informa-
tion Presentation (IP) in Spoken Dialogue
Systems (SDS) using a data-driven statis-
tical optimisation framework for content
planning and attribute selection. First we
collect data in a Wizard-of-Oz (WoZ) ex-
periment and use it to build a supervised
model of human behaviour. This forms
a baseline for measuring the performance
of optimised policies, developed from this
data using Reinforcement Learning (RL)
methods. We show that the optimised poli-
cies significantly outperform the baselines
in a variety of generation scenarios: while
the supervised model is able to attain up to
87.6% of the possible reward on this task,
the RL policies are significantly better in 5
out of 6 scenarios, gaining up to 91.5% of
the total possible reward. The RL policies
perform especially well in more complex
scenarios. We are also the first to show
that adding predictive “lower level” fea-
tures (e.g. from the NLG realiser) is im-
portant for optimising IP strategies accord-
ing to user preferences. This provides new
insights into the nature of the IP problem
for SDS.
1 Introduction
Work on evaluating SDS suggests that the Infor-
mation Presentation (IP) phase is the primary con-
tributor to dialogue duration (Walker et al., 2001),
and as such, is a central aspect of SDS design.
During this phase the system returns a set of items
(“hits”) from a database, which match the user’s
current search constraints. An inherent problem
in this task is the trade-off between presenting
“enough” information to the user (for example
helping them to feel confident that they have a
good overview of the search results) versus keep-
ing the utterances short and understandable.
In the following we show that IP for SDS can
be treated as a data-driven joint optimisation prob-
lem, and that this outperforms a supervised model
of human ‘wizard’ behaviour on a particular IP
task (presenting sets of search results to a user).
A similar approach has been applied to the
problem of Referring Expression Generation in di-
alogue (Janarthanam and Lemon, 2010).
1.1 Previous work on Information
Presentation in SDS
Broadly speaking, IP for SDS can be divided into
two main steps: 1) IP strategy selection and 2)
Content or Attribute Selection. Prior work has
presented a variety of IP strategies for structur-
ing information (see examples in Table 1). For ex-
ample, the SUMMARY strategy is used to guide the
user’s “focus of attention”. It draws the user’s at-
tention to relevant attributes by grouping the cur-
rent results from the database into clusters, e.g.
(Polifroni and Walker, 2008; Demberg and Moore,
2006). Other studies investigate a COMPARE strat-
egy, e.g. (Walker et al., 2007; Nakatsu, 2008),
while most work in SDS uses a RECOMMEND strat-
egy, e.g. (Young et al., 2007). In a previous proof-
of-concept study (Rieser and Lemon, 2009) we
show that each of these strategies has its own
strengths and drawbacks, dependent on the partic-
ular context in which information needs to be pre-
sented to a user. Here, we will also explore pos-
sible combinations of the strategies, for example
SUMMARY followed by RECOMMEND, e.g. (Whittaker
et al., 2002), see Figure 1.
Prior work on Content or Attribute Selection
has used a “Summarize and Refine” approach (Po-
lifroni and Walker, 2008; Polifroni and Walker,
2006; Chung, 2004). This method employs utility-
based attribute selection with respect to how each
attribute (e.g. price or food type in restaurant
1009
search) of a set of items helps to narrow down
the user’s goal to a single item. Related work ex-
plores a user modelling approach, where attributes
are ranked according to user preferences (Dem-
berg and Moore, 2006; Winterboer et al., 2007).
Our data collection (see Section 3) and training en-
vironment incorporate these approaches.
The work in this paper is the first to ap-
ply a data-driven method to this whole decision
space (i.e. combinations of Information Presenta-
tion strategies as well as attribute selection), and to
show the utility of both lower-level features (e.g.
from the NLG realiser) and higher-level features
(e.g. from Dialogue Management) for this prob-
lem. Previous work has only focused on individual
aspects of the problem (e.g. how many attributes
to generate, or when to use a SUMMARY), using a
pipeline model for SDS with DM features as input,
and where NLG has no knowledge of lower level
features (e.g. behaviour of the realiser). In Section
4.3 we show that lower level features significantly
influence users’ ratings of IP strategies. In the fol-
lowing we use a Reinforcement Learning (RL) as a
statistical planning framework (Sutton and Barto,
1998) to explore the contextual features for mak-
ing these decisions, and propose a new joint opti-
misation method for IP strategies combining con-
tent structuring and attribute selection.
2 NLG as planning under uncertainty
We follow the overall framework of NLG as plan-
ning under uncertainty (Lemon, 2008; Rieser and
Lemon, 2009; Lemon, 2010), where each NLG ac-
tion is a sequential decision point, based on the
current dialogue context and the expected long-
term utility or “reward” of the action. Other re-
cent approaches describe this task as planning, e.g.
(Koller and Petrick, 2008), or as contextual de-
cision making according to a cost function (van
Deemter, 2009), but not as a statistical planning
problem, where uncertainty in the stochastic envi-
ronment is explicitly modelled. Below, we apply
this framework to Information Presentation strate-
gies in SDS using Reinforcement Learning, where
the example task is to present a set of search results
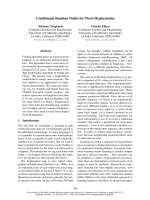
(e.g. restaurants) to users. In particular, we con-
sider 7 possible policies for structuring the content
(see Figure 1): Recommending one single item,
comparing two items, summarising all of them,
or ordered combinations of those actions, e.g. first
summarise all the retrieved items and then recom-
mend one of them. The IP module has to decide
which action to take next, how many attributes to
mention, and when to stop generating.
Figure 1: Possible Information Presentation struc-
tures (X=stop generation)
3 Wizard-of-Oz data collection
In an initial Wizard-of-Oz (WoZ) study, we asked
humans (our “wizards”) to produce good IP ac-
tions in different dialogue contexts, when interact-
ing in spoken dialogues with other humans (the
“users”), who believed that they were talking to an
automated SDS. The wizards were experienced re-
searchers in SDS and were familiar with the search
domain (restaurants in Edinburgh). They were in-
structed to select IP structures and attributes for
NLG so as to most efficiently allow users to find a
restaurant matching their search constraints. They
also received prior training on this task.
The task for the wizards was to decide which
IP structure to use next (see Section 3.2 for a
list of IP strategies to choose from), which at-
tributes to mention (e.g. cuisine, price range, lo-
cation, food quality, and/or service quality), and
whether to stop generating, given varying num-
bers of database matches, varying prompt reali-
sations, and varying user behaviour. Wizard ut-
terances were synthesised using a state-of-the-art
text-to-speech engine. The user speech input was
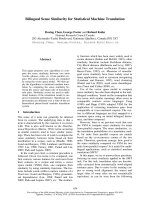
delivered to the wizard using Voice Over IP. Figure
2 shows the web-based interface for the wizard.
3.1 Experimental Setup and Data collection
We collected 213 dialogues with 18 subjects and 2
wizards (Liu et al., 2009). Each user performed a
total of 12 tasks, where no task set was seen twice
by any one wizard. The majority of users were
from a range of backgrounds in a higher educa-
tion institute, in the age range 20-30, native speak-
ers of English, and none had prior experience of
1010
Figure 2: Wizard interface. [A:] The wizard selects attribute values as specified by the user’s query. [B:] The retrieved
database items are presented in an ordered list. We use a User Modelling approach for ranking the restaurants, see e.g. (Polifroni
and Walker, 2008). [C:] The wizard then chooses which strategy and which attributes to generate next, by clicking radio buttons.
The attribute/s specified in the last user query are pre-selected by default. The strategies can only be combined in the orders as
specified in Figure 1. [D:] An utterance is automatically generated by the NLG realiser every time the wizard selects a strategy,
and is displayed in an intermediate text panel. [E:] The wizard can decide to add the generated utterance to the final output
panel or to start over again. The text in the final panel is sent to the user via TTS, once the wizard decides to stop generating.
Strategy Example utterance
SUMMARY no
UM
I found 26 restaurants, which have Indian cuisine. 11 of the restaurants are in the expensive price
range. Furthermore, 10 of the restaurants are in the cheap price range and 5 of the restaurants
are in the moderate price range.
SUMMARY UM 26 restaurants meet your query. There are 10 restaurants which serve Indian food and are in the
cheap price range. There are also 16 others which are more expensive.
COMPARE by
Item
The restaurant called Kebab Mahal is an Indian restaurant. It is in the cheap price range. And
the restaurant called Saffrani, which is also an Indian restaurant, is in the moderate price range.
COMPARE by
Attribute
The restaurant called Kebab Mahal and the restaurant called Saffrani are both Indian restaurants.
However, Kebab Mahal is in the cheap price range while Saffrani is moderately priced.
RECOMMEND The restaurant called Kebab Mahal has the best overall quality amongst the matching restau-
rants. It is an Indian restaurant, and it is in the cheap price range.
Table 1: Example realisations, generated when the user provided cuisine=Indian, and where the
wizard has also selected the additional attribute price for presentation to the user.
Spoken Dialogue Systems. After each task the
user answered a questionnaire on a 6 point Lik-
ert scale, regarding the perceived generation qual-
ity in that task. The wizards’ IP strategies were
highly ranked by the users on average (4.7), and
users were able to select a restaurant in 98.6% of
the cases. No significant difference between the
wizards was observed.
The data contains 2236 utterances in total: 1465
wizard utterances and 771 user utterances. We au-
tomatically extracted 81 features (e.g #sentences,
#DBhits, #turns, #ellipsis)
1
from the XML logfiles
after each dialogue. Please see (Rieser et al., 2009)
1
The full corpus and list of features is available at
/>for more details.
3.2 NLG Realiser
In the Wizard-of-Oz environment we implemented
a NLG realiser for the chosen IP structures and
attribute choices, in order to realise the wizards’
choices in real time. This generator is based on
data from the stochastic sentence planner SPaRKy
(Stent et al., 2004). We replicated the variation ob-
served in SPaRKy by analysing high-ranking ex-
ample outputs (given the highest possible score
by the SPaRKy judges) and implemented the vari-
ance using dynamic sentence generation. The real-
isations vary in sentence aggregation, aggregation
operators (e.g. ‘and’, period, or ellipsis), contrasts
1011
(e.g. ‘however’, ‘on the other hand’) and referring
expressions (e.g. ‘it’, ‘this restaurant’) used. The
length of an utterance also depends on the num-
ber of attributes chosen, i.e. the more attributes the
longer the utterance. All of these variations were
logged.
In particular, we realised the following IP strate-
gies (see examples in Table 1):
• SUMMARY of all matching restaurants with
or without a User Model (UM), following
(Polifroni and Walker, 2008). The approach
using a UM assumes that the user has cer-
tain preferences (e.g. cheap) and only tells
him about the relevant items, whereas the
approach with no UM lists all the matching
items.
• COMPARE the top 2 restaurants by Item (i.e.
listing all the attributes for the first item and
then for the other) or by Attribute (i.e. di-
rectly comparing the different attribute val-
ues).
• RECOMMEND the top-ranking restaurant (ac-
cording to UM).
Note that there was no discernible pattern in
the data about the wizards’ decisions between
the UM/no UM and the byItem/byAttribute ver-
sions of the strategies. In this study we will
therefore concentrate on the higher level decisions
(SUMMARY vs. COMPARE vs. RECOMMEND) and model
these different realisations as noise in the realiser.
3.3 Supervised Baseline strategy
We analysed the WoZ data to explore the best-
rated strategies (the top scoring 50%, n = 205)
that were employed by humans for this task. Here
we used a variety of Supervised Learning meth-
ods to create a model of the highly rated wizard
behaviour. Please see (Rieser et al., 2009) for fur-
ther details. The best performing method was Rule
Induction (JRip).
2
The model achieved an accu-
racy of 43.19% which is significantly (p < .001)
better than the majority baseline of always choos-
ing SUMMARY (34.65%).
3
The resulting rule set is
shown in Figure 3.
2
The WEKA implementation of (Cohen, 1995)’s RIPPER.
3
Note that the low accuracy is due to data sparsity and
diverse behaviour of the wizards. However, in (Rieser et al.,
2009) we show that this model is significantly different from
the policy learned using the worse scoring 50%.
IF (dbHits <= 9)& (prevNLG = summary):
THEN nlgStrategy=compare;
IF (dbHits = 1):
THEN nlgStrategy= Recommend;
IF(prevNLG=summaryRecommend)&(dbHits>=10):
THEN nlgStrategy= Recommend;
ELSE nlgStrategy=summary;
Figure 3: Rules learned by JRip for the wizard
model (‘dbHits’= number of database matches,
‘prevNLG’= previous NLG action)
The features selected by this model were only
“high-level” features, i.e. the input (previous ac-
tion, number of database hits) that an IP module
receives as input from a Dialogue Manager (DM).
We further analysed the importance of different
features using feature ranking and selection meth-
ods (Rieser et al., 2009), finding that the human
wizards in this specific setup did not pay signifi-
cant attention to any lower level features, e.g. from
surface realisation, although the generated output
was displayed to them (see Figure 2).
Nevertheless, note that the supervised model
achieves up to 87.6% of the possible reward on
this task, as we show in Section 5.2, and so can
be considered a serious baseline against which to
measure performance. Below, we will show that
Reinforcement Learning (RL) produces a signifi-
cant improvement over the strategies present in the
original data, especially in cases where RL has ac-
cess to “lower level” features of the context.
4 The Simulation / Learning
Environment
Here we “bootstrap” a simulated training environ-
ment from the WoZ data, following (Rieser and
Lemon, 2008).
4.1 User Simulations
User Simulations are commonly used to train
strategies for Dialogue Management, see for ex-
ample (Young et al., 2007). A user simulation for
NLG is very similar, in that it is a predictive model
of the most likely next user act.
4
However, this
NLG predicted user act does not actually change
the overall dialogue state (e.g. by filling slots) but
it only changes the generator state. In other words,
4
Similar to the internal user models applied in recent
work on POMDP (Partially Observable Markov Decision
Process) dialogue managers (Young et al., 2007; Henderson
and Lemon, 2008; Gasic et al., 2008) for estimation of user
act probabilities.
1012
the NLG user simulation tells us what the user is
most likely to do next, if we were to stop generat-
ing now.
We are most interested in the following user re-
actions:
1. select: the user chooses one of the pre-
sented items, e.g. “Yes, I’ll take that one.”.
This reply type indicates that the Informa-
tion Presentation was sufficient for the user
to make a choice.
2. addInfo: The user provides more at-
tributes, e.g. “I want something cheap.”. This
reply type indicates that the user has more
specific requests, which s/he wants to specify
after being presented with the current infor-
mation.
3. requestMoreInfo: The user asks for
more information, e.g. “Can you recommend
me one?”, “What is the price range of the
last item?”. This reply type indicates that the
system failed to present the information the
user was looking for.
4. askRepeat: The user asks the system to
repeat the same message again, e.g. “Can you
repeat?”. This reply type indicates that the
utterance was either too long or confusing for
the user to remember, or the TTS quality was
not good enough, or both.
5. silence: The user does not say anything.
In this case it is up to the system to take ini-
tiative.
6. hangup: The user closes the interaction.
We build user simulations using n-gram mod-
els of system (s) and user (u) acts, as first
introduced by (Eckert et al., 1997). In or-
der to account for data sparsity, we apply dif-
ferent discounting (“smoothing”) techniques in-
cluding back-off, using the CMU Statistical Lan-
guage Modelling toolkit (Clarkson and Rosen-
feld, 1997). We construct a bi-gram model
5
for the users’ reactions to the system’s IP struc-
ture decisions (P (a
u,t
|IP
s,t
)), and a tri-gram
(i.e. IP structure + attribute choice) model for
predicting user reactions to the system’s com-
bined IP structure and attribute selection deci-
sions: P (a
u,t
|IP
s,t
, attributes
s,t
).
5
Where a
u,t
is the predicted next user action at time t,
IP
s,t
was the system’s Information Presentation action at t,
and attributes
s,t
is the attributes selected by the system at t.
We evaluate the performance of these models
by measuring dialogue similarity to the original
data, based on the Kullback-Leibler (KL) diver-
gence, as also used by, e.g. (Cuay
´
ahuitl et al.,
2005; Jung et al., 2009; Janarthanam and Lemon,
2009). We compare the raw probabilities as ob-
served in the data with the probabilities generated
by our n-gram models using different discounting
techniques for each context, see table 2. All the
models have a small divergence from the origi-
nal data (especially the bi-gram model), suggest-
ing that they are reasonable simulations for train-
ing and testing NLG policies.
The absolute discounting method for the bi-
gram model is most dissimilar to the data, as is the
WittenBell method for the tri-gram model, i.e. the
models using these discounting methods have the
highest KL score. The best performing methods
(i.e. most similar to the original data), are linear
discounting for the bi-gram model and GoodTur-
ing for the tri-gram. We use the most similar user
models for system training, and the most dissimi-
lar user models for testing NLG policies, in order
to test whether the learned policies are robust and
adaptive to unseen dialogue contexts.
discounting method bi-gram US tri-gram US
WittenBell 0.086 0.512
GoodTuring 0.086 0.163
absolute 0.091 0.246
linear 0.011 0.276
Table 2: Kullback-Leibler divergence for the dif-
ferent User Simulations (US)
4.2 Database matches and “Focus of
attention”
An important task of Information Presentation is
to support the user in choosing between all the
available items (and ultimately in selecting the
most suitable one) by structuring the current infor-
mation returned from the database, as explained in
Section 1.1. We therefore model the user’s “fo-
cus of attention” as a feature in our learning ex-
periments. This feature reflects how the differ-
ent IP strategies structure information with dif-
ferent numbers of attributes. We implement this
shift of the user’s focus analogously to discover-
ing the user’s goal in Dialogue Management: ev-
ery time the predicted next user act is to add in-
1013
formation (addInfo), we infer that the user is
therefore only interested in a subset of the previ-
ously presented results and so the system will fo-
cus on this new subset of database items in the rest
of the generated utterance. For example, the user’s
focus after the SUMMARY (with UM) in Table 1 is
DBhits = 10, since the user is only interested in
cheap, Indian places.
4.3 Data-driven Reward function
The reward/evaluation function is constructed
from the WoZ data, using a stepwise linear regres-
sion, following the PARADISE framework (Walker
et al., 2000). This model selects the features
which significantly influenced the users’ ratings
for the NLG strategy in the WoZ questionnaire.
We also assign a value to the user’s reactions
(valueUserReaction), similar to optimising task
success for DM (Young et al., 2007). This reflects
the fact that good IP strategies should help the
user to select an item (valueUserReaction =
+100) or provide more constraints addInfo
(valueUserReaction = ±0), but the user should
not do anything else (valueU serReaction =
−100). The regression in equation 1 (R
2
=
.26) indicates that users’ ratings are influenced by
higher level and lower level features: Users like to
be focused on a small set of database hits (where
#DBhits ranges over [1-100]), which will enable
them to choose an item (valueUserReaction),
while keeping the IP utterances short (where
#sentence is in the range [2-18]):
Reward = (−1.2) × #DBhits (1)
+(.121) × valueUserReaction
−(1.43) × #sentence
Note that the worst possible reward for an NLG
move is therefore (−1.20 ×100) −(.121× 100)−
(18 × 1.43) = −157.84. This is achieved by pre-
senting 100 items to the user in 18 sentences
6
, in
such a way that the user ends the conversation un-
successfully. The top possible reward is achieved
in the rare cases where the system can immedi-
ately present 1 item to the user using just 2 sen-
tences, and the user then selects that item, i.e. Re-
ward = −(1.20 ×1)+(.121× 100)−(2×1.43) =
8.06
6
Note that the maximum possible number of sentences
generated by the realizer is 18 for the full IP sequence SUM-
MARY+COMPARE+RECOMMEND using all the attributes.
5 Reinforcement Learning experiments
We now formulate the problem as a Markov De-
cision Process (MDP), where states are NLG di-
alogue contexts and actions are NLG decisions.
Each state-action pair is associated with a transi-
tion probability, which is the probability of mov-
ing from state s at time t to state s
at time t+1 af-
ter having performed action a when in state s. This
transition probability is computed by the environ-
ment model (i.e. the user simulation and realiser),
and explicitly captures the uncertainty in the gen-
eration environment. This is a major difference
to other non-statistical planning approaches. Each
transition is also associated with a reinforcement
signal (or “reward”) r
t+1
describing how good the
result of action a was when performed in state s.
The aim of the MDP is to maximise long-term ex-
pected reward of its decisions, resulting in a policy
which maps each possible state to an appropriate
action in that state.
We treat IP as a hierarchical joint optimisation
problem, where first one of the IP structures (1-
3) is chosen and then the number of attributes is
decided, as shown in Figure 4. At each genera-
tion step, the MDP can choose 1-5 attributes (e.g.
cuisine, price range, location, food quality, and/or
service quality). Generation stops as soon as the
user is predicted to select an item, i.e. the IP task
is successful. (Note that the same constraint is op-
erational for the WoZ baseline.)
ACTION:
IP:
SUMMARY
COMPARE
RECOMMEND
attr: 1-5
STATE:
attributes:
1-15
sentence:
2-18
dbHitsFocus:
1-100
userSelect:
0,1
userAddInfo:
0,1
userElse:
0,1
Figure 4: State-Action space for the RL-NLG
problem
States are represented as sets of NLG dia-
logue context features. The state space comprises
“lower-level” features about the realiser behaviour
(two discrete features representing the number of
attributes and sentences generated so far) and three
binary features representing the user’s predicted
next action, as well as “high-level” features pro-
1014
vided by the DM (e.g. current database hits in the
user’s focus (dbHitsFocus)). We trained the
policy using the SHARSHA algorithm (Shapiro and
Langley, 2002) with linear function approximation
(Sutton and Barto, 1998), and the simulation envi-
ronment described in Section 4. The policy was
trained for 60,000 iterations.
5.1 Experimental Set-up
We compare the learned strategies against the WoZ
baseline as described in Section 3.3. For attribute
selection we choose a majority baseline (randomly
choosing between 3 or 4 attributes) since the at-
tribute selection models learned by Supervised
Learning on the WoZ data didn’t show significant
improvements.
For training, we used the user simulation model
most similar to the data, see Section 4.1. For
testing, we test with the different user simulation
model (the one which is most dissimilar to the
data).
We first investigate how well IP structure (with-
out attribute choice) can be learned in increas-
ingly complex generation scenarios. A genera-
tion scenario is a combination of a particular kind
of NLG realiser (template vs. stochastic) along
with different levels of variation introduced by cer-
tain features of the dialogue context. In general,
the stochastic realiser introduces more variation
in lower level features than the template-based re-
aliser. The Focus model introduces more varia-
tion with respect to #DBhits and #attributes as de-
scribed in Section 4.2. We therefore investigate
the following cases:
1.1. IP structure choice, Template realiser:
Predicted next user action varies according to
the bi-gram model (P (a
u,t
|IP
s,t
)); Number
of sentences and attributes per IP strategy is
set by defaults, reflecting a template-based
realiser.
1.2. IP structure choice, Stochastic realiser:
IP structure where number of attributes per
NLG turn is given at the beginning of each
episode (e.g. set by the DM); Sentence gen-
eration according to the SPaRKy stochastic
realiser model as described in Section 3.2.
We then investigate different scenarios for
jointly optimising IP structure (IPS) and attribute
selection (Attr) decisions.
2.1. IPS+Attr choice, Template realiser:
Predicted next user action varies according
to tri-gram (P (a
u,t
|IP
s,t
, attributes
s,t
))
model; Number of sentences per IP structure
set to default.
2.2. IPS+Attr choice, Template realiser+Focus model:
Tri-gram user simulation with Template re-
aliser and Focus of attention model with
respect to #DBhits and #attributes as
described in section 4.2.
2.3. IPS+Attr choice, Stochastic realiser: Tri-
gram user simulation with sentence/attribute
relationship according to Stochastic realiser
as described in Section 3.2.
2.4. IPS+Attr choice, Stochastic realiser+Focus:
i.e. the full model = Predicted next user ac-
tion varies according to tri-gram model+
Focus of attention model + Sentence/attribute
relationship according to stochastic realiser.
5.2 Results
We compare the average final reward (see Equa-
tion 1) gained by the baseline against the trained
RL policies in the different scenarios for each
1000 test runs, using a paired samples t-test. The
results are shown in Table 3. In 5 out of 6 scenar-
ios the RL policy significantly (p < .001) outper-
forms the supervised baseline. We also report on
the percentage of the top possible reward gained
by the individual policies, and the raw percentage
improvement of the RL policy. Note that the best
possible (100%) reward can only be gained in rare
cases (see Section 4.3).
The learned RL policies show that lower level
features are important in gaining significant im-
provements over the baseline. The more complex
the scenario, the harder it is to gain higher rewards
for the policies in general (as more variation is in-
troduced), but the relative improvement in rewards
also increases with complexity: the baseline does
not adapt well to the variations in lower level fea-
tures whereas RL learns to adapt to the more chal-
lenging scenarios.
7
An overview of the range of different IP strate-
gies learned for each setup can be found in Table 4.
Note that these strategies are context-dependent:
the learner chooses how to proceed dependent on
7
Note, that the baseline does reasonably well in scenarios
with variation introduced by only higher level features (e.g.
scenario 2.2).
1015
Scenario
Wizard Baseline
average Reward
RL average Reward
RL % - Baseline %
= % improvement
1.1 -15.82(±15.53) -9.90***(±15.38) 89.2% - 85.6%= 3.6%
1.2 -19.83(±17.59) -12.83***(±16.88) 87.4% - 83.2%= 4.2%
2.1 -12.53(±16.31) -6.03***(±11.89) 91.5% - 87.6%= 3.9%
2.2 -14.15(±16.60) -14.18(±18.04) 86.6% - 86.6%= 0.0%
2.3 -17.43(±15.87) -9.66***(±14.44) 89.3% - 84.6%= 4.7%
2.4 -19.59(±17.75) -12.78***(±15.83) 87.4% - 83.3%= 4.1%
Table 3: Test results for 1000 dialogues, where *** denotes that the RL policy is significantly (p < .001)
better than the Baseline policy.
the features in the state space at each generation
step.
Scenario strategies learned
1.1
RECOMMEND
COMPARE
COMPARE+RECOMMEND
SUMMARY
SUMMARY+COMPARE
SUMMARY+RECOMMEND
SUMMARY+COMPARE+RECOMMEND.
1.2
RECOMMEND
COMPARE
COMPARE+RECOMMEND
SUMMARY
SUMMARY+COMPARE
SUMMARY+RECOMMEND
SUMMARY+COMPARE+RECOMMEND.
2.1
RECOMMEND(5)
SUMMARY(2)
SUMMARY(2)+COMPARE(4)
SUMMARY(2)+COMPARE(1)
SUMMARY(2)+COMPARE(4)+RECOMMEND(5)
SUMMARY(2)+COMPARE(1)+RECOMMEND(5)
2.2
RECOMMEND(5)
SUMMARY(4)
SUMMARY(4)+RECOMMEND(5)
2.3
RECOMMEND(2)
SUMMARY(1)
SUMMARY(1)+COMPARE(4)
SUMMARY(1)+COMPARE(1)
SUMMARY(1)+COMPARE(4)+RECOMMEND(2)
2.4
RECOMMEND(2)
SUMMARY(2)
SUMMARY(2)+COMPARE(4)
SUMMARY(2)+RECOMMEND(2)
SUMMARY(2)+COMPARE(4)+RECOMMEND(2)
SUMMARY(2)+COMPARE(1)+RECOMMEND(2)
Table 4: RL strategies learned for the different sce-
narios, where (n) denotes the number of attributes
generated.
For example, the RL policy for scenario 1.1
learned to start with a SUMMARY if the initial num-
ber of items returned from the database is high
(>30). It will then stop generating if the user is
predicted to select an item. Otherwise, it contin-
ues with a RECOMMEND. If the number of database
items is low, it will start with a COMPARE and then
continue with a RECOMMEND, unless the user selects
an item. Also see Table 4. Note that the WoZ strat-
egy behaves as described in Figure 3.
In addition, the RL policy for scenario 1.2
learns to adapt to a more complex scenario:
the number of attributes requested by the DM
and produced by the stochastic sentence re-
aliser. It learns to generate the whole sequence
(SUMMARY+COMPARE+RECOMMEND) if #attributes is
low (<3), because the overall generated utterance
(final #sentences) is still relatively short. Other-
wise the policy is similar to the one for scenario
1.1.
The RL policies for jointly optimising IP strat-
egy and attribute selection learn to select the num-
ber of attributes according to the generation sce-
narios 2.1-2.4. For example, the RL policy learned
for scenario 2.1 generates a RECOMMEND with 5 at-
tributes if the database hits are low (<13). Oth-
erwise, it will start with a SUMMARY using 2 at-
tributes. If the user is predicted to narrow down
his focus after the SUMMARY, the policy continues
with a COMPARE using 1 attribute only, otherwise it
helps the user by presenting 4 attributes. It then
continues with RECOMMEND(5), and stops as soon
as the user is predicted to select one item.
The learned policy for scenario 2.1 generates
5.85 attributes per NLG turn on average (i.e. the
cumulative number of attributes generated in the
whole NLG sequence, where the same attribute
may be repeated within the sequence). This strat-
egy primarily adapts to the variations from the user
simulation (tri-gram model). For scenario 2.2 the
average number of attributes is higher (7.15) since
the number of attributes helps to narrow down the
user’s focus via the DBhits/attribute relationship
specified in section 4.2. For scenario 2.3 fewer
attributes are generated on average (3.14), since
here the number of attributes influences the sen-
tence realiser, i.e. fewer attributes results in fewer
sentences, but does not impact the user’s focus.
In scenario 2.4 all the conditions mentioned above
influence the learned policy. The average number
of attributes selected is still low (3.19).
In comparison, the average (cumulative) num-
1016
ber of attributes for the WoZ baseline is 7.10. The
WoZ baseline generates all the possible IP struc-
tures (with 3 or 4 attributes) but is restricted to use
only “high-level” features (see Figure 3). By beat-
ing this baseline we show the importance of the
“lower-level” features. Nevertheless, this wizard
policy achieves up to 87.6% of the possible reward
on this task, and so can be considered a serious
baseline against which to measure performance.
The only case (scenario 2.2) where RL does not
improve significantly over the baseline is where
lower level features do not play an important role
for learning good strategies: scenario 2.2 is only
sensitive to higher level features (DBhits).
6 Conclusion
We have presented a new data-driven method for
Information Presentation (IP) in Spoken Dialogue
Systems using a statistical optimisation frame-
work for content structure planning and attribute
selection. This work is the first to apply a data-
driven optimisation method to the IP decision
space, and to show the utility of both lower-level
and higher-level features for this problem.
We collected data in a Wizard-of-Oz (WoZ)
experiment and showed that human “wizards”
mostly pay attention to ‘high-level’ features from
Dialogue Management. The WoZ data was used
to build statistical models of user reactions to
IP strategies, and a data-driven reward function
for Reinforcement Learning (RL). We show that
lower level features significantly influence users’
ratings of IP strategies. We compared a model of
human behaviour (the ‘human wizard baseline’)
against policies optimised using Reinforcement
Learning, in a variety of scenarios. Our optimised
policies significantly outperform the IP structuring
and attribute selection present in the WoZ data, es-
pecially when performing in complex generation
scenarios which require adaptation to, e.g. number
of database results, utterance length, etc. While
the human wizards were able to attain up to 87.6%
of the possible reward on this task, the RL poli-
cies are significantly better in 5 out of 6 scenarios,
gaining up to 91.5% of the total possible reward.
We have also shown that adding predictive
“lower level” features, e.g. from the NLG realiser
and a user reaction model, is important for learn-
ing optimal IP strategies according to user pref-
erences. Future work could include the predicted
TTS quality (Boidin et al., 2009) as a feature.
We are now working on testing the learned poli-
cies with real users, outside of laboratory condi-
tions, using a restaurant-guide SDS, deployed as a
VOIP service. Previous work in SDS has shown
that results for Dialogue Management obtained
with simulated users are able to transfer to eval-
uations with real users (Lemon et al., 2006).
This methodology provides new insights into
the nature of the IP problem, which has previously
been treated as a module following dialogue man-
agement with no access to lower-level context fea-
tures. The data-driven planning method applied
here promises a significant upgrade in the perfor-
mance of generation modules, and thereby of Spo-
ken Dialogue Systems in general.
Acknowledgments
The research leading to these results has received
funding from the European Community’s Seventh
Framework Programme (FP7/2007-2013) under
grant agreement no. 216594 (CLASSiC project
www.classic-project.org) and from the
EPSRC, project no. EP/G069840/1.
References
Cedric Boidin, Verena Rieser, Lonneke van der Plas,
Oliver Lemon, and Jonathan Chevelu. 2009. Pre-
dicting how it sounds: Re-ranking alternative in-
puts to TTS using latent variables (forthcoming). In
Proc. of Interspeech/ICSLP, Special Session on Ma-
chine Learning for Adaptivity in Spoken Dialogue
Systems.
Grace Chung. 2004. Developing a flexible spoken dia-
log system using simulation. In Proc. of the Annual
Meeting of the Association for Computational Lin-
guistics (ACL).
P.R. Clarkson and R. Rosenfeld. 1997. Statisti-
cal Language Modeling Using the CMU-Cambridge
Toolkit. In Proc. of ESCA Eurospeech.
William W. Cohen. 1995. Fast effective rule induction.
In Proceedings of the 12th International Conference
on Machine Learning (ICML).
Heriberto Cuay
´
ahuitl, Steve Renals, Oliver Lemon, and
Hiroshi Shimodaira. 2005. Human-computer dia-
logue simulation using hidden markov models. In
Proc. of the IEEE workshop on Automatic Speech
Recognition and Understanding (ASRU).
Vera Demberg and Johanna D. Moore. 2006. Infor-
mation presentation in spoken dialogue systems. In
Proceedings of EACL.
1017
W. Eckert, E. Levin, and R. Pieraccini. 1997. User
modeling for spoken dialogue system evaluation. In
Proc. of the IEEE workshop on Automatic Speech
Recognition and Understanding (ASRU).
M. Gasic, S. Keizer, F. Mairesse, J. Schatzmann,
B. Thomson, and S. Young. 2008. Training and
Evaluation of the HIS POMDP Dialogue System in
Noise. In Proc. of SIGdial Workshop on Discourse
and Dialogue.
James Henderson and Oliver Lemon. 2008. Mixture
Model POMDPs for Efficient Handling of Uncer-
tainty in Dialogue Management. In Proc. of ACL.
Srinivasan Janarthanam and Oliver Lemon. 2009. A
Two-tier User Simulation Model for Reinforcement
Learning of Adaptive Referring Expression Genera-
tion Policies. In Proc. of SIGdial.
Srini Janarthanam and Oliver Lemon. 2010. Learn-
ing to adapt to unknown users: Referring expression
generation in spoken dialogue systems. In Proceed-
ings of ACL.
Sangkeun Jung, Cheongjae Lee, Kyungduk Kim, Min-
woo Jeong, and Gary Geunbae Lee. 2009. Data-
driven user simulation for automated evaluation of
spoken dialog systems. Computer, Speech & Lan-
guage, 23:479–509.
Alexander Koller and Ronald Petrick. 2008. Experi-
ences with planning for natural language generation.
In ICAPS.
Oliver Lemon, Kallirroi Georgila, and James Hender-
son. 2006. Evaluating Effectiveness and Portabil-
ity of Reinforcement Learned Dialogue Strategies
with real users: the TALK TownInfo Evaluation. In
IEEE/ACL Spoken Language Technology.
Oliver Lemon. 2008. Adaptive Natural Language
Generation in Dialogue using Reinforcement Learn-
ing. In Proceedings of SEMdial.
Oliver Lemon. 2010. Learning what to say and how to
say it: joint optimization of spoken dialogue man-
agement and Natural Language Generation. Com-
puter, Speech & Language, to appear.
Xingkun Liu, Verena Rieser, and Oliver Lemon. 2009.
A wizard-of-oz interface to study information pre-
sentation strategies for spoken dialogue systems. In
Proc. of the 1st International Workshop on Spoken
Dialogue Systems.
Crystal Nakatsu. 2008. Learning contrastive connec-
tives in sentence realization ranking. In Proc. of
SIGdial Workshop on Discourse and Dialogue.
Joseph Polifroni and Marilyn Walker. 2006. Learning
database content for spoken dialogue system design.
In Proc. of the IEEE/ACL workshop on Spoken Lan-
guage Technology (SLT).
Joseph Polifroni and Marilyn Walker. 2008. Inten-
sional Summaries as Cooperative Responses in Di-
alogue Automation and Evaluation. In Proceedings
of ACL.
Verena Rieser and Oliver Lemon. 2008. Learn-
ing Effective Multimodal Dialogue Strategies from
Wizard-of-Oz data: Bootstrapping and Evaluation.
In Proc. of ACL.
Verena Rieser and Oliver Lemon. 2009. Natural Lan-
guage Generation as Planning Under Uncertainty for
Spoken Dialogue Systems. In Proc. of EACL.
Verena Rieser, Xingkun Liu, and Oliver Lemon. 2009.
Optimal Wizard NLG Behaviours in Context. Tech-
nical report, Deliverable 4.2, CLASSiC Project.
Dan Shapiro and P. Langley. 2002. Separating skills
from preference: Using learning to program by re-
ward. In Proc. of the 19th International Conference
on Machine Learning (ICML).
Amanda Stent, Rashmi Prasad, and Marilyn Walker.
2004. Trainable sentence planning for complex in-
formation presentation in spoken dialog systems. In
Association for Computational Linguistics.
R. Sutton and A. Barto. 1998. Reinforcement Learn-
ing. MIT Press.
Kees van Deemter. 2009. What game theory can do
for NLG: the case of vague language. In 12th Eu-
ropean Workshop on Natural Language Generation
(ENLG).
Marilyn A. Walker, Candace A. Kamm, and Diane J.
Litman. 2000. Towards developing general mod-
els of usability with PARADISE. Natural Language
Engineering, 6(3).
M. Walker, R. Passonneau, and J. Boland. 2001. Quan-
titative and qualitative evaluation of DARPA Com-
municator spoken dialogue systems. In Proc. of
the Annual Meeting of the Association for Compu-
tational Linguistics (ACL).
Marilyn Walker, Amanda Stent, Franc¸ois Mairesse, and
Rashmi Prasad. 2007. Individual and domain adap-
tation in sentence planning for dialogue. Journal of
Artificial Intelligence Research (JAIR), 30:413–456.
Steve Whittaker, Marilyn Walker, and Johanna Moore.
2002. Fish or Fowl: A Wizard of Oz evaluation
of dialogue strategies in the restaurant domain. In
Proc. of the International Conference on Language
Resources and Evaluation (LREC).
Andi Winterboer, Jiang Hu, Johanna D. Moore, and
Clifford Nass. 2007. The influence of user tailoring
and cognitive load on user performance in spoken
dialogue systems. In Proc. of the 10th International
Conference of Spoken Language Processing (Inter-
speech/ICSLP).
SJ Young, J Schatzmann, K Weilhammer, and H Ye.
2007. The Hidden Information State Approach to
Dialog Management. In ICASSP 2007.
1018