Báo cáo khoa học: "Optimizing Question Answering Accuracy by Maximizing Log-Likelihood" pot
Bạn đang xem bản rút gọn của tài liệu. Xem và tải ngay bản đầy đủ của tài liệu tại đây (131.19 KB, 5 trang )
Proceedings of the ACL 2010 Conference Short Papers, pages 236–240,
Uppsala, Sweden, 11-16 July 2010.
c
2010 Association for Computational Linguistics
Optimizing Question Answering Accuracy by Maximizing Log-Likelihood
Matthias H. Heie, Edward W. D. Whittaker and Sadaoki Furui
Department of Computer Science
Tokyo Institute of Technology
Tokyo 152-8552, Japan
{heie,edw,furui}@furui.cs.titech.ac.jp
Abstract
In this paper we demonstrate that there
is a strong correlation between the Ques-
tion Answering (QA) accuracy and the
log-likelihood of the answer typing com-
ponent of our statistical QA model. We
exploit this observation in a clustering al-
gorithm which optimizes QA accuracy by
maximizing the log-likelihood of a set of
question-and-answer pairs. Experimental
results show that we achieve better QA ac-
curacy using the resulting clusters than by
using manually derived clusters.
1 Introduction
Question Answering (QA) distinguishes itself
from other information retrieval tasks in that the
system tries to return accurate answers to queries
posed in natural language. Factoid QA limits it-
self to questions that can usually be answered with
a few words. Typically factoid QA systems em-
ploy some form of question type analysis, so that
a question such as What is the capital of Japan?
will be answered with a geographical term. While
many QA systems use hand-crafted rules for this
task, such an approach is time-consuming and
doesn’t generalize well to other languages. Ma-
chine learning methods have been proposed, such
as question classification using support vector ma-
chines (Zhang and Lee, 2003) and language mod-
eling (Merkel and Klakow, 2007). In these ap-
proaches, question categories are predefined and a
classifier is trained on manually labeled data. This
is an example of supervised learning. In this pa-
per we present an unsupervised method, where we
attempt to cluster question-and-answer (q-a) pairs
without any predefined question categories, hence
no manually class-labeled questions are used.
We use a statistical QA framework, described in
Section 2, where the system is trained with clusters
of q-a pairs. This framework was used in several
TREC evaluations where it placed in the top 10
of participating systems (Whittaker et al., 2006).
In Section 3 we show that answer accuracy is
strongly correlated with the log-likelihood of the
q-a pairs computed by this statistical model. In
Section 4 we propose an algorithm to cluster q-a
pairs by maximizing the log-likelihood of a dis-
joint set of q-a pairs. In Section 5 we evaluate the
QA accuracy by training the QA system with the
resulting clusters.
2 QA system
In our QA framework we choose to model only
the probability of an answer A given a question Q,
and assume that the answer A depends on two sets
of features: W = W (Q) and X = X(Q):
P (A|Q) = P (A|W, X), (1)
where W represents a set of |W | features describ-
ing the question-type part of Q such as who, when,
where, which, etc., and X is a set of features
which describes the “information-bearing” part of
Q, i.e. what the question is actually about and
what it refers to. For example, in the questions
Where is Mount Fuji? and How high is Mount
Fuji?, the question type features W differ, while
the information-bearing features X are identical.
Finding the best answer
ˆ
A involves a search over
all A for the one which maximizes the probability
of the above model, i.e.:
ˆ
A = arg max
A
P (A|W, X). (2)
Given the correct probability distribution, this
will give us the optimal answer in a maximum
likelihood sense. Using Bayes’ rule, assuming
uniform P (A) and that W and X are indepen-
dent of each other given A, in addition to ignoring
P (W, X) since it is independent of A, enables us
to rewrite Eq. (2) as
236
ˆ
A = arg max
A
P (A | X)
retrieval
model
· P (W | A)
filter
model
. (3)
2.1 Retrieval Model
The retrieval model P (A|X) is essentially a lan-
guage model which models the probability of an
answer sequence A given a set of information-
bearing features X = {x
1
, . . ., x
|X|
}. This set
is constructed by extracting single-word features
from Q that are not present in a stop-list of high-
frequency words. The implementation of the re-
trieval model used for the experiments described
in this paper, models the proximity of A to fea-
tures in X. It is not examined further here;
see (Whittaker et al., 2005) for more details.
2.2 Filter Model
The question-type feature set W = {w
1
, . . . , w
|W |
}
is constructed by extracting n-tuples (n = 1, 2, . . .)
such as where, in what and when were from the
input question Q. We limit ourselves to extracting
single-word features. The 2522 most frequent
words in a collection of example questions are
considered in-vocabulary words; all other words
are out-of-vocabulary words, and substituted with
UNK.
Modeling the complex relationship between
W and A directly is non-trivial. We there-
fore introduce an intermediate variable C
E
=
{c
1
, . . . , c
|C
E
|
}, representing a set of classes of
example q-a pairs. In order to construct these
classes, given a set E = {t
1
, . . . , t
|E|
} of ex-
ample q-a pairs, we define a mapping function
f : E → C
E
which maps each example q-a pair t
j
for j = 1 . . . |E| into a particular class f(t
j
) = c
e
.
Thus each class c
e
may be defined as the union of
all component q-a features from each t
j
satisfy-
ing f(t
j
) = c
e
. Hence each class c
e
constitutes a
cluster of q-a pairs. Finally, to facilitate modeling
we say that W is conditionally independent of A
given c
e
so that,
P (W | A) =
|C
E
|
e=1
P (W | c
e
W
) · P (c
e
A
| A), (4)
where c
e
W
and c
e
A
refer to the subsets of question-
type features and example answers for the class c
e
,
respectively.
P (W | c
e
W
) is implemented as trigram langu-
age models with backoff smoothing using absolute
discounting (Huang et al., 2001).
Due to data sparsity, our set of example q-a
pairs cannot be expected to cover all the possi-
ble answers to questions that may ever be asked.
We therefore employ answer class modeling rather
than answer word modeling by expanding Eq. (4)
as follows:
P (W | A) =
|C
E
|
e=1
P (W | c
e
W
)·
|K
A
|
a=1
P (c
e
A
| k
a
)P (k
a
| A),
(5)
where k
a
is a concrete class in the set of |K
A
|
answer classes K
A
. These classes are generated
using the Kneser-Ney clustering algorithm, com-
monly used for generating class definitions for
class language models (Kneser and Ney, 1993).
In this paper we restrict ourselves to single-
word answers; see (Whittaker et al., 2005) for the
modeling of multi-word answers. We estimate
P (c
e
A
| k
A
) as
P (c
e
A
| k
A
) =
f(k
A
, c
e
A
)
|C
E
|
g=1
f(k
A
, c
g
A
)
, (6)
where
f(k
A
, c
e
A
) =
∀i:i∈c
e
A
δ(i ∈ k
A
)
|c
e
A
|
, (7)
and δ(·) is a discrete indicator function which
equals 1 if its argument evaluates true and 0 if
false.
P (k
a
| A) is estimated as
P (k
a
| A) =
1
∀j:j∈K
a
δ(A ∈ j)
. (8)
3 The Relationship between Mean
Reciprocal Rank and Log-Likelihood
We use Mean Reciprocal Rank (MRR) as our
metric when evaluating the QA accuracy on a set
of questions G = {g
1
g
|G|
}:
MRR =
|G|
i=1
1/R
i
|G|
, (9)
237
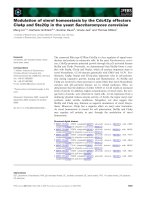
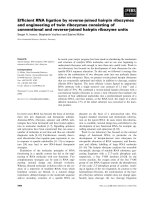
0.15
0.16
0.17
0.18
0.19
0.2
0.21
0.22
0.23
-1.18 -1.16 -1.14 -1.12
MRR
LL
ρ = 0.86
Figure 1: MRR vs. LL (average per q-a pair) for
100 random cluster configurations.
where R
i
is the rank of the highest ranking correct
candidate answer for g
i
.
Given a set D = (d
1
d
|D|
) of q-a pairs disjoint
from the q-a pairs in C
E
, we can, using Eq. (5),
calculate the log-likelihood as
LL =
|D|
d=1
log P(W
d
|A
d
)
=
|D|
d=1
log
|C
E
|
e=1
P (W
d
| c
e
W
)·
|K
A
|
a=1
P (c
e
A
| k
a
)P (k
a
| A
d
).
(10)
To examine the relationship between M RR and
LL, we randomly generate configurations C
E
,
with a fixed cluster size of 4, and plot the result-
ing MRR and LL, computed on the same data set
D, as data points in a scatter plot, as seen in Fig-
ure 1. We find that LL and MRR are strongly
correlated, with a correlation coefficient ρ = 0.86.
This observation indicates that we should be
able to improve the answer accuracy of the QA
system by optimizing the LL of the filter model
in isolation, similar to how, in automatic speech
recognition, the LL of the language model can
be optimized in isolation to improve the speech
recognition accuracy (Huang et al., 2001).
4 Clustering algorithm
Using the observation that LL is correlated with
MRR on the same data set, we expect that opti-
mizing LL on a development set (LL
dev
) will also
improve MRR on an evaluation set (MRR
eval
).
Hence we propose the following greedy algorithm
to maximize LL
dev
:
init: c
1
∈ C
E
contains all training pairs |E|
while improvement > threshold do
best
LL
dev
← −∞
for all j = 1 |E| do
original
cluster = f(t
j
)
Take t
j
out of f(t
j
)
for e = −1, 1 |C
E
|, |C
E
| + 1 do
Put t
j
in c
e
Calculate LL
dev
if LL
dev
> best
LL
dev
then
best
LL
dev
← LL
dev
best
cluster ← e
best
pair ← j
end if
Take t
j
out of c
e
end for
Put t
j
back in original
cluster
end for
Take t
best
pair
out of f(t
best pair
)
Put t
best
pair
into c
best cluster
end while
In this algorithm, c
−1
indicates the set of train-
ing pairs outside the cluster configuration, thus ev-
ery training pair will not necessarily be included
in the final configuration. c
|C|+1
refers to a new,
empty cluster, hence this algorithm automatically
finds the optimal number of clusters as well as the
optimal configuration of them.
5 Experiments
5.1 Experimental Setup
For our data sets, we restrict ourselves to questions
that start with who, when or where. Furthermore,
we only use q-a pairs which can be answered with
a single word. As training data we use questions
and answers from the Knowledge-Master collec-
tion
1
. Development/evaluation questions are the
questions from TREC QA evaluations from TREC
2002 to TREC 2006, the answers to which are to
be retrieved from the AQUAINT corpus. In total
we have 2016 q-a pairs for training and 568 ques-
tions for development/evaluation. We are able to
retrieve the correct answer for 317 of the devel-
opment/evaluation questions, thus the theoretical
upper bound for our experiments is an answer ac-
curacy of MRR = 0.558.
Accuracy is evaluated using 5-fold (rotating)
cross-validation, where in each fold the TREC
QA data is partitioned into a development set of
1
/>238
Configuration LL
eval
MRR
eval
#clusters
manual -1.18 0.262 3
all-in-one -1.32 0.183 1
one-in-each -0.87 0.263 2016
automatic -0.24 0.281 4
Table 1: LL
eval
(average per q-a pair) and
MRR
eval
(over all held-out TREC years), and
number of clusters (median of the cross-evaluation
folds) for the various configurations.
4 years’ data and an evaluation set of one year’s
data. For each TREC question the top 50 doc-
uments from the AQUAINT corpus are retrieved
using Lucene
2
. We use the QA system described
in Section 2 for QA evaluation. Our evaluation
metric is MRR
eval
, and LL
dev
is our optimiza-
tion criterion, as motivated in Section 3.
Our baseline system uses manual clusters.
These clusters are obtained by putting all who q-a
pairs in one cluster, all when pairs in a second and
all where pairs in a third. We compare this baseline
with using clusters resulting from the algorithm
described in Section 4. We run this algorithm until
there are no further improvements in LL
dev
. Two
other cluster configurations are also investigated:
all q-a pairs in one cluster (all-in-one), and each q-
a pair in its own cluster (one-in-each). The all-in-
one configuration is equivalent to not using the fil-
ter model, i.e. answer candidates are ranked solely
by the retrieval model. The one-in-each configura-
tion was shown to perform well in the TREC 2006
QA evaluation (Whittaker et al., 2006), where it
ranked 9th among 27 participants on the factoid
QA task.
5.2 Results
In Table 1, we see that the manual clusters (base-
line) achieves an M RR
eval
of 0.262, while the
clusters resulting from the clustering algorithm
give an MRR
eval
of 0.281, which is a relative
improvement of 7%. This improvement is sta-
tistically significant at the 0.01 level using the
Wilcoxon signed-rank test. The one-in-each clus-
ter configuration achieves an MRR
eval
of 0.263,
which is not a statistically significant improvement
over the baseline. The all-in-one cluster configura-
tion (i.e. no filter model) has the lowest accuracy,
with an MRR
eval
of 0.183.
2
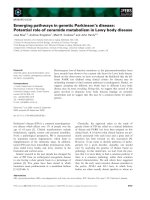
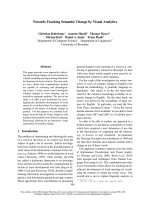
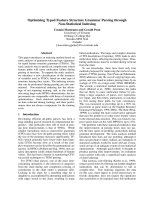
/>-1.4
-1.2
-1
-0.8
-0.6
-0.4
-0.2
0
0 400 800 1200 1600 2000
0.16
0.18
0.2
0.22
0.24
0.26
0.28
0.3
0.32
LL
MRR
# iterations
LL
dev
MRR
dev
(a) Development set, 4 year’s TREC.
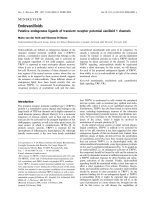
-1.4
-1.2
-1
-0.8
-0.6
-0.4
-0.2
0
0 400 800 1200 1600 2000
0.16
0.18
0.2
0.22
0.24
0.26
0.28
0.3
0.32
LL
MRR
# iterations
LL
eval
MRR
eval
(b) Evaluation set, 1 year’s TREC.
Figure 2: MRR and LL (average per q-a pair)
vs. number of algorithm iterations for one cross-
validation fold.
6 Discussion
Manual inspection of the automatically derived
clusters showed that the algorithm had constructed
configurations where typically who, when and
where q-a pairs were put in separate clusters, as in
the manual configuration. However, in some cases
both who and where q-a pairs occurred in the same
cluster, so as to better answer questions like Who
won the World Cup?, where the answer could be a
country name.
As can be seen from Table 1, there are only 4
clusters in the automatic configuration, compared
to 2016 in the one-in-each configuration. Since
the computational complexity of the filter model
described in Section 2.2 is linear in the number of
clusters, a beneficial side effect of our clustering
procedure is a significant reduction in the compu-
tational requirement of the filter model.
In Figure 2 we plot LL and MRR for one of
the cross-validation folds over multiple iterations
(the while loop) of the clustering algorithm in Sec-
239
tion 4. It can clearly be seen that the optimization
of LL
dev
leads to improvement in MRR
eval
, and
that LL
eval
is also well correlated with M RR
eval
.
7 Conclusions and Future Work
In this paper we have shown that the log-likelihood
of our statistical model is strongly correlated with
answer accuracy. Using this information, we have
clustered training q-a pairs by maximizing log-
likelihood on a disjoint development set of q-a
pairs. The experiments show that with these clus-
ters we achieve better QA accuracy than using
manually clustered training q-a pairs.
In future work we will extend the types of ques-
tions that we consider, and also allow for multi-
word answers.
Acknowledgements
The authors wish to thank Dietrich Klakow for his
discussion at the concept stage of this work. The
anonymous reviewers are also thanked for their
constructive feedback.
References
[Huang et al.2001] Xuedong Huang, Alex Acero and
Hsiao-Wuen Hon. 2001. Spoken Language Pro-
cessing. Prentice-Hall, Upper Saddle River, NJ,
USA.
[Kneser and Ney1993] Reinhard Kneser and Hermann
Ney. 1993. Improved Clustering Techniques for
Class-based Statistical Language Modelling. Pro-
ceedings of the European Conference on Speech
Communication and Technology (EUROSPEECH).
[Merkel and Klakow2007] Andreas Merkel and Diet-
rich Klakow. 2007. Language Model Based Query
Classification. Proceedings of the European Confer-
ence on Information Retrieval (ECIR).
[Whittaker et al.2005] Edward Whittaker, Sadaoki Fu-
rui and Dietrich Klakow. 2005. A Statistical Clas-
sification Approach to Question Answering using
Web Data. Proceedings of the International Con-
ference on Cyberworlds.
[Whittaker et al.2006] Edward Whittaker, Josef Novak,
Pierre Chatain and Sadaoki Furui. 2006. TREC
2006 Question Answering Experiments at Tokyo In-
stitute of Technology. Proceedings of The Fifteenth
Text REtrieval Conference (TREC).
[Zhang and Lee2003] Dell Zhang and Wee Sun Lee.
2003. Question Classification using Support Vec-
tor Machines. Proceedings of the Special Interest
Group on Information Retrieval (SIGIR).
240