Báo cáo khoa học: "Hunting for the Black Swan: Risk Mining from Text" doc
Bạn đang xem bản rút gọn của tài liệu. Xem và tải ngay bản đầy đủ của tài liệu tại đây (297.71 KB, 6 trang )
Proceedings of the ACL 2010 System Demonstrations, pages 54–59,
Uppsala, Sweden, 13 July 2010.
c
2010 Association for Computational Linguistics
Hunting for the Black Swan: Risk Mining from Text
Jochen L. Leidner and Frank Schilder
Thomson Reuters Corporation
Research & Development
610 Opperman Drive, St. Paul, MN 55123 USA
Abstract
In the business world, analyzing and dealing with
risk permeates all decisions and actions. However,
to date, risk identification, the first step in the risk
management cycle, has always been a manual activ-
ity with little to no intelligent software tool support.
In addition, although companies are required to list
risks to their business in their annual SEC filings
in the USA, these descriptions are often very high-
level and vague.
In this paper, we introduce Risk Mining, which is
the task of identifying a set of risks pertaining to a
business area or entity. We argue that by combining
Web mining and Information Extraction (IE) tech-
niques, risks can be detected automatically before
they materialize, thus providing valuable business
intelligence.
We describe a system that induces a risk taxonomy
with concrete risks (e.g., interest rate changes) at its
leaves and more abstract risks (e.g., financial risks)
closer to its root node. The taxonomy is induced
via a bootstrapping algorithms starting with a few
seeds. The risk taxonomy is used by the system as
input to a risk monitor that matches risk mentions in
financial documents to the abstract risk types, thus
bridging a lexical gap. Our system is able to au-
tomatically generate company specific “risk maps”,
which we demonstrate for a corpus of earnings re-
port conference calls.
1 Introduction
Any given human activity with a particular in-
tended outcome is bound to face a non-zero like-
lihood of failure. In business, companies are ex-
posed to market risks such as new competitors,
disruptive technologies, change in customer at-
titudes, or a changes in government legislation
that can dramatically affect their profitability or
threaten their business model or mode of opera-
tion. Therefore, any tool to assist in the elicita-
tion of otherwise unforeseen risk factors carries
tremendous potential value.
However, it is very hard to identify risks ex-
haustively, and some types (commonly referred
to as the unknown unknowns) are especially elu-
sive: if a known unknown is the established knowl-
edge that important risk factors are known, but it is
unclear whether and when they become realized,
then an unknown unknown is the lack of aware-
ness, in practice or in principle, of circumstances
that may impact the outcome of a project, for ex-
ample. Nassim Nicholas Taleb calls these “black
swans” (Taleb, 2007).
Companies in the US are required to disclose
a list of potential risks in their annual Form 10-K
SEC fillings in order to warn (potential) investors,
and risks are frequently the topic of conference
phone calls about a company’s earnings. These
risks are often reported in general terms, in par-
ticular, because it is quite difficult to pinpoint the
unknown unknown, i.e. what kind of risk is con-
cretely going to materialize. On the other hand,
there is a stream of valuable evidence available on
the Web, such as news messages, blog entries, and
analysts’ reports talking about companies’ perfor-
mance and products. Financial analysts and risk
officers in large companies have not enjoyed any
text analytics support so far, and risk lists devised
using questionnaires or interviews are unlikely to
be exhaustive due to small sample size, a gap
which we aim to address in this paper.
To this end, we propose to use a combination
of Web Mining (WM) and Information Eextrac-
tion (IE) to assist humans interested in risk (with
respect to an organization) and to bridge the gap
between the general language and concrete risks.
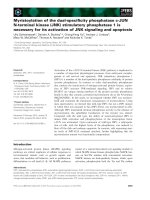
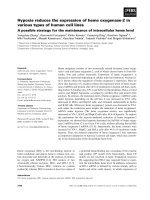
We describe our system, which is divided in two
main parts: (a) an offline Risk Miner that facili-
tates the risk identification step of the risk manage-
ment process, and an online (b) Risk Monitor that
supports the risk monitoring step (cf. Figure 2). In
addition, a Risk Mapper can aggregate and visu-
alize the evidence in the form of a risk map. Our
risk mining algorithm combines Riloff hyponym
patterns with recursive Web pattern bootstrapping
and a graph representation.
We do not know of any other implemented end-
to-end system for computer-assisted risk identifi-
cation/visualization using text mining technology.
54
2 Related Work
Financial IE. IE systems have been applied to the
financial domain on Message Understanding Con-
test (MUC) like tasks, ranging from named en-
tity tagging to slot filling in templates (Costantino,
1992).
Automatic Knowledge Acquisition. (Hearst,
1992) pioneered the pattern-based extraction of
hyponyms from corpora, which laid the ground-
work for subsequent work, and which included ex-
traction of knowledge from to the Web (e.g. (Et-
zioni et al., 2004)). To improve precision was the
mission of (Kozareva et al., 2008), which was de-
signed to extract hyponymy, but they did so at the
expense of recall, using longer dual anchored pat-
terns and a pattern linkage graph. However, their
method is by its very nature unable to deal with
low-frequency items, and their system does not
contain a chunker, so only single term items can
be extracted. De Saenger et al. (De Saeger et al.,
2008) describe an approach that extracts instances
of the “trouble” or “obstacle” relations from the
Web in the form of pairs of fillers for these bi-
nary relations. Their approach, which is described
for the Japanese language, uses support vector ma-
chine learning and relies on a Japanese syntac-
tic parser, which permits them to process nega-
tion. In contrast, and unlike their method, we pur-
sue a more general, open-ended search process,
which does not impose as much a priori knowl-
edge. Also, they create a set of pairs, whereas our
approach creates a taxonomy tree as output. Most
importantly though, our approach is not driven by
frequency, and was instead designed to work es-
pecially with rare occurrences in mind to permit
“black swan”-type risk discovery.
Correlation of Volatility and Text. (Kogan et al.,
2009) study the correlation between share price
volatility, a proxy for risk, and a set of trigger
words occurring in 60,000 SEC 10-K filings from
1995-2006. Since the disclosure of a company’s
risks is mandatory by law, SEC reports provide
a rich source. Their trigger words are selected a
priori by humans; in contrast, risk mining as ex-
ercised in this paper aims to find risk-indicative
words and phrases automatically.
Kogan and colleagues attempt to find a regres-
sion model using very simple unigram features
based on whole documents that predicts volatility,
whereas our goal is to automatically extract pat-
terns to be used as alerts.
Speculative Language & NLP. Light et al. (Light
et al., 2004) found that sub-string matching of
14 pre-defined string literals outperforms an SVM
classifier using bag-of-words features in the task
of speculative language detection in medical ab-
stracts. (Goldberg et al., 2009) are concerned with
automatic recognition of human wishes, as ex-
pressed in human notes for Year’s Eve. They use a
bi-partite graph-based approach, where one kind
of node (content node) represents things people
wish for (“world peace”) and the other kind of
node (template nodes) represent templates that ex-
tract them (e.g. “I wish for ___”). Wishes
can be seen as positive Q, in our formalization.
3 Data
We apply the mined risk extraction patterns to a
corpus of financial documents. The data originates
from the StreetEvents database and was kindly
provided to us by Starmine, a Thomson Reuters
company. In particular, we are dealing with 170k
earning calls transcripts, a text type that contains
monologue (company executives reporting about
their company’s performance and general situa-
tion) as well as dialogue (in the form of ques-
tions and answers at the end of each conference
call). Participants typically include select business
analysts from investment banks, and the calls are
published afterwards for the shareholders’ bene-
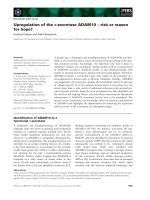
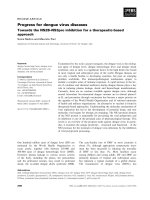
fits. Figure 1 shows some example excerpts. We
randomly took a sample of N=6,185 transcripts to
use them in our risk alerting experiments.
1
4 Method
4.1 System
The overall system is divided into two core parts:
(a) Risk Mining and (b) Risk Monitoring (cf. Fig-
ure 2). For demonstration purposes, we add a (c)
Risk Mapper, a visualization component. We de-
scribe how a variety of risks can be identified given
a normally very high-level description of risks,
as one can find in earnings reports, other finan-
cial news, or the risk section of 10-K SEC filings.
Starting with rather abstract descriptions such as
operational risks and hyponym-inducing pattern
"< RISK > such as *", we use the Web to
mine pages from which we can harvest additional,
1
We could also use this data for risk mining, but did not
try this due to the small size of the dataset compared to the
Web.
55
CEO: As announced last evening, during our third quarter, we will take the difficult but necessary step to seize [cease]
manufacturing at our nearly 100 year old Pennsylvania House casegood plant in Lewisburg, Pennsylvania as well as the nearby
Pennsylvania House dining room chair assembly facility in White Deer. Also, the three Lewisburg area warehouses will be
consolidated as we assess the logistical needs of the casegood group’s existing warehouse operations at an appropriate time in the
future to minimize any disruption of service to our customers. This will result in the loss of 425 jobs or approximately 15% of the
casegood group’s current employee base.
Analyst: Okay, so your comments – and I guess I don’t know – I can figure out, as you correctly helped me through, what
dollar contribution at GE. I don’t know the net equipment sales number last quarter and this quarter. But it sounded like from
your comments that if you exclude these fees, that equipment sales were probably flattish. Is that fair to say?
CEO: We’re not breaking out the origination fee from the equipment fee, but I think in total, I would say flattish to slightly up.
Figure 1: Example sentences from the earnings conference call dataset. Top: main part. Bottom: Q&A.
and eventually more concrete, candidates, and re-
late them to risk types via a transitive chain of bi-
nary IS-A relations. Contrary to the related work,
we use a base NP chunker and download the full
pages returned by the search engine rather than
search snippets in order to be able to extract risk
phrases rather than just terms, which reduces con-
textual ambiguity and thus increases overall preci-
sion. The taxonomy learning method described in
the following subsection determines a risk taxon-
omy and new risks patterns.
Web Miner
Taxonomy
Inducer
Seed Patterns
"* <RISK> such
as *"
Search Engine Web Pages
Business
Reports
Risk Alerting
Notification
Risk
Taxonomy
Risk Mining
for
Risk Identification
Information Extraction
for
Risk Monitoring
Figure 2: The risk mining and monitoring system
architecture
The second part of the system, the Risk Mon-
itor, takes the risks from the risk taxonomy and
uses them for monitoring financial text streams
such as news, SEC filings, or (in our use case)
earnings reports. Using this, an analyst is then able
to identify concrete risks in news messages and
link them to the high-level risk descriptions. He
or she may want to identify operational risks such
as fraud for a particular company, for instance.
The risk taxonomy can also derive further risks
in this category (e.g., faulty components, brakes)
for exploration and drill-down analysis. Thus,
news reports about faulty breaks in (e.g. Toyota)
or volcano outbreaks (e.g. Iceland) can be directly
linked to the risk as stated in earnings reports or
security filings.
Our Risk Miner and Risk Monitor are imple-
mented in Perl, with the graph processing of the
taxonomy implemented in SWI-Prolog, whereas
the Risk Mapper exists in two versions, a static
image generator for R
2
and, alternatively, an in-
teractive Web page (DHTML, JavaScript, and us-
ing Google’s Chart API). We use the Yahoo Web
search API.
4.2 Taxonomy induction method
Using frequency to compute confidence in a pat-
tern does not work for risk mining, however, be-
cause mention of particular risks might be rare. In-
stead of frequency based indicators (n-grams, fre-
quency weights), we rely on two types of struc-
tural confidence validation, namely (a) previously
identified risks and (b) previously acquired struc-
tural patterns. Note, however, that we can still use
PageRank, a popularity-based graph algorithm,
because multiple patterns might be connected to
a risk term or phrase, even in the absence of fre-
quency counts for each (i.e., we interpret popular-
ity as having multiple sources of support).
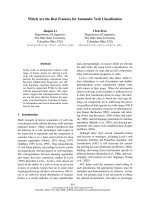
1. Risk Candidate Extraction Step. The first
step is used to extract a list of risks based on high
precision patterns. However, it has been shown
that the use of such patterns (e.g., such as) quickly
lead to an decrease in precision. Ideally, we want
to retrieve specific risks by re-applying the the ex-
tract risk descriptions:
2
56
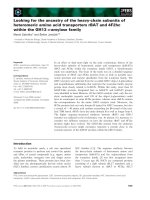
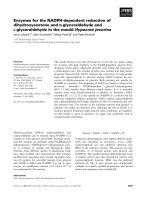
Figure 3: A sample IS-A and Pattern network with
sample PageRank scores.
(a) Take a seed, instantiate "< SEED > such
as *" pattern with seed, extract candidates:
Input: risks
Method: apply pattern "< SEED > such
as < INSTANCE > ", where
< SEED > = risks
Output: list of instances (e.g., faulty compo-
nents)
(b) For each candidate from the list of instances,
we find a set of additional candidate hy-
ponyms.
Input: faulty components
Method: apply pattern "< SEED > such
as < INSTANCE > ", where
< SEED > = faulty components
Output: list of instances (e.g., brake)
2. Risk Validation. Since the Risk Candidate
extraction step will also find many false positives,
we need to factor in information that validates that
the extracted risk is indeed a risk. We do this by
constructing a possible pattern containing this new
risk.
(a) Append "* risks" to the output of 1(b) in
order to make sure that the candidate occurs
in a risk context.
Input: brake(s)
Pattern: "brake(s) * risk(s)"
Output: a list of patterns (e.g., minimize
such risks, raising the risk)
(b) extract new risk pattern by substituting the
risk candidate with < RISK > ; creating a
limited number of variations
Input: list of all patterns mined from step 2
(a)
Method: create more pattern variations,
such as "< RISK > minimize such
risks", "raising the risk
of < RISK > " etc.
Output: list of new potential risks (e.g., de-
flation), but also many false positives
(e.g., way, as in The best way to mini-
mize such risks).
In order to benefit from any human observations
of system errors in future runs, we also extended
the system so as to read in a partial list of pre-
defined risks at startup time, which can guide the
risk miner; while technically different from active
learning, this approach was somewhat inspired by
it (but our feedback is more loose).
3. Constructing Risk Graph. We have now
reached the point where we constructed a graph
with risks and patterns. Risks are connected via
IS-A links; risks and patterns are connected via
PATTERN links. Note that there are links from
risks to patterns and from patterns to risks; some
risks back-pointed by a pattern may actually not
be a risk (e.g., people). However, this node is also
not connected to a more abstract risk node and
will therefore have a low PageRank score. Risks
that are connected to patterns that have a high au-
thority (i.e., pointing to by many other links) are
highly ranked within PageRank (Figure 3). The
risk black Swan, for example, has only one pat-
tern it occurs in, but this pattern can be filled by
many other risks (e.g., fire, regulations). Hence,
the PageRank score of the black swan is high sim-
ilar to well known risks, such as fraud.
4.3 Risk alerting method
We compile the risk taxonomy into a trie automa-
ton, and create a second trie for company names
from the meta-data of our corpus. The Risk Mon-
itor reads the two tries and uses the first to de-
tect mentions of risks in the earning reports and
the second one to tag company names, both using
case-insensitive matching for better recall. Op-
tionally, we can use Porter stemming during trie
construction and matching to trade precision for
even higher recall, but in the experiments reported
here this is not used. Once a signal term or phrase
matches, we look up its risk type in a hash table,
take a note of the company that the current earn-
ings report is about, and increase the frequency
57
liquidity IS-A financial risks
credit IS-A financial risks
direct risks IS-A financial risks
fraud IS-A financial risks
irregular activity IS-A operational risks
process failure IS-A operational risks
human error IS-A operational risks
labor strikes IS-A operational risks
customer acceptance IS-A IT market risks
interest rate changes IS-A capital market risks
uncertainty IS-A market risks
volatility IS-A mean reverting market risks
copyright infringement IS-A legal risks
negligence IS-A other legal risks
an unfair dismissal IS-A the legal risks
Sarbanes IS-A legal risks
government changes IS-A global political risks
crime IS-A Social and political risks
state intervention IS-A political risks
terrorist acts IS-A geopolitical risks
earthquakes IS-A natural disaster risks
floods IS-A natural disaster risks
global climate change IS-A environmental risks
severe and extreme weather IS-A environmental risks
internal cracking IS-A any technological risks
GM technologies IS-A tech risks
scalability issues IS-A technology risks
viruses IS-A the technical risks
Figure 4: Selected financial risk tuples after Web
validation.
count for this company; risk type tuple, which
we use for graphic rendering purposes.
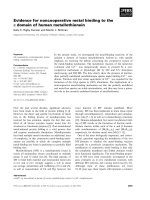
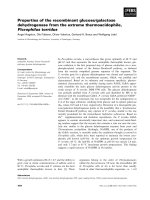
4.4 Risk mapping method
To demonstrate the method presented here, we cre-
ated a visualization that displays a risk map, which
is a two dimensional table showing companies and
the types of risk they are facing, together with bub-
ble sizes proportional to the number of alerts that
the Risk Monitor could discover in the corpus. The
second option also permits the user to explore the
detected risk mentions per company and by risk
type.
5 Results
From the Web mining process, we obtain a set
of pairs (Figure 4), from which the taxonomy is
constructed. In one run with only 12 seeds (just
the risk type names with variants), we obtained a
taxonomy with 280 validated leave nodes that are
connected transitively to the risks root node.
Our resulting system produces visualizations
we call “risk maps”, because they graphically
present the extracted risk types in aggregated
form. A set of risk types can be selected for pre-
sentation as well as a set of companies of interest.
A risk map display is then generated using either
R (Figure 5) or an interactive Web page, depend-
ing on the user’s preference.
Qualitative error analysis. We inspected the
output of the risk miner and observed the follow-
Figure 5: An Example Risk Map.
ing classes of issues: (a) chunker errors: if phrasal
boundaries are placed at the wrong position, the
taxonomy will include wrong relations. For exam-
ple, deictic determiners such as “this” were a prob-
lem (e.g. that IS-A indirect risks) be-
fore we introduced a stop word filter that discards
candidate tuples that contain no content words.
Another prominent example is “short term” in-
stead of the correct “short term risk”; (b) seman-
tic drift
3
: due to polysemy, words and phrases
can denote risk and non-risk meanings, depend-
ing on context. Talking about risks even a spe-
cific pattern such as “such as” [sic] is used by au-
thors to induce a variety of perspectives on the
topic of risk, and after several iterations negative
effects of type (a) errors compound; (c) off-topic
relations: the seeds are designed to induce a tax-
onomy specific to risk types. As a side effect,
many (correct or incorrect) irrelevant relations
are learned, e.g. credit and debit cards
is-a money transfer. We currently dis-
card these by virtue of ignoring all relations not
transitively connected with the root node risks,
so no formalized domain knowledge is required;
(d) overlap: the concept space is divided up dif-
ferently by different writers, both on the Web
and in the risk management literature, and this
is reflected by multiple category membership of
many risks (e.g. is cash flow primarily an oper-
ational risk or a financial risk?). Currently, we
do not deal with this phenomenon automatically;
(e) redundant relations: at the time of writing, we
do not cache all already extracted and validated
risks/non-risks. This means there is room for im-
provement w.r.t. runtime, because we make more
Web queries than strictly necessary. While we
have not evaluated this system yet, we found by in-
3
to use a term coined by Andy Lauriston
58
specting the output that our method is particularly
effective for learning natural disasters and med-
ical conditions, probably because they are well-
covered by news sites and biomedical abstracts on
the Web. We also found that some classes contain
more noise than others, for example operational
risk was less precise than financial risk, proba-
bly due to the lesser specificity of the former risk
type.
6 Summary, Conclusions & Future Work
Summary of Contributions.
In this paper, we introduced the task of risk min-
ing, which produces patterns that are useful in an-
other task, risk alerting. Both tasks provide com-
putational assistance to risk-related decision mak-
ing in the financial sector. We described a special-
purpose algorithm for inducing a risk taxonomy
offline, which can then be used online to analyze
earning reports in order to signal risks. In do-
ing so, we have addressed two research questions
of general relevance, namely how to extract rare
patterns, for which frequency-based methods fail,
and how to use the Web to bridge the vocabulary
gap, i.e. how to match up terms and phrases in
financial news prose with the more abstract lan-
guage typically used in talking about risk in gen-
eral.
We have described an implemented demonstrator
system comprising an offline risk taxonomy miner,
an online risk alerter and a visualization compo-
nent that creates visual risk maps by company and
risk type, which we have applied to a corpus of
earnings call transcripts.
Future Work. Extracted negative and also pos-
itive risks can be used in many applications, rang-
ing from e-mail alerts to determinating credit rat-
ings. Our preliminary work on risk maps can be
put on a more theoretical footing (Hunter, 2000).
After studying further how output of risk alert-
ing correlates
4
with non-textual signals like share
price, risk detection signals could inform human
or trading decisions.
Acknowledgments. We are grateful to Khalid Al-Kofahi,
Peter Jackson and James Powell for supporting this work.
Thanks to George Bonne, Ryan Roser, and Craig D’Alessio
at Starmine, a Thomson Reuters company, for sharing the
StreetEvents dataset with us, and to David Rosenblatt for dis-
cussions and to Jack Conrad for feedback on this paper.
4
Our hypothesis is that risk patterns can outperform bag
of words (Kogan et al., 2009).
References
Marco Costantino. 1992. Financial information extrac-
tion using pre-defined and user-definable templates in the
LOLITA system. Proceedings of the Fifteenth Interna-
tional Conference on Computational Linguistics (COL-
ING 1992), vol. 4, pages 241–255.
Stijn De Saeger, Kentaro Torisawa, and Jun’ichi Kazama.
2008. Looking for trouble. In Proceedings of the 22nd
International Conference on Computational Linguistics
(COLING 2008), pages 185–192, Morristown, NJ, USA.
Association for Computational Linguistics.
Oren Etzioni, Michael J. Cafarella, Doug Downey, Stanley
Kok, Ana-Maria Popescu, Tal Shaked, Stephen Soderland,
Daniel S. Weld, and Alexander Yates. 2004. Web-scale
information extraction in KnowItAll: preliminary results.
In Stuart I. Feldman, Mike Uretsky, Marc Najork, and
Craig E. Wills, editors, Proceedings of the 13th interna-
tional conference on World Wide Web (WWW 2004), New
York, NY, USA, May 17-20, 2004, pages 100–110. ACM.
Andrew B. Goldberg, Nathanael Fillmore, David Andrzejew-
ski, Zhiting Xu, Bryan Gibson, and Xiaojin Zhu. 2009.
May all your wishes come true: A study of wishes and
how to recognize them. In Proceedings of Human Lan-
guage Technologies: The 2009 Annual Conference of the
North American Chapter of the Association for Compu-
tational Linguistics, pages 263–271, Boulder, Colorado,
June. Association for Computational Linguistics.
Marti Hearst. 1992. Automatic acquisition of hyponyms
from large text corpora. In Proceedings of the Fourteenth
International Conference on Computational Linguistics
(COLING 1992).
Anthony Hunter. 2000. Ramification analysis using causal
mapping. Data and Knowledge Engineering, 32:200–227.
Shimon Kogan, Dimitry Levin, Bryan R. Routledge, Jacob S.
Sagi, and Noah A. Smith. 2009. Predicting risk from
financial reports with regression. In Proceedings of the
Joint International Conference on Human Language Tech-
nology and the Annual Meeting of the North American
Chapter of the Association for Computational Linguistics
(HLT-NAACL).
Zornitsa Kozareva, Ellen Riloff, and Eduard Hovy. 2008.
Semantic class learning from the web with hyponym pat-
tern linkage graphs. In Proceedings of ACL-HLT, pages
1048–1056, Columbus, OH, USA. Association for Com-
putational Linguistics.
Marc Light, Xin Ying Qiu, and Padmini Srinivasan. 2004.
The language of bioscience: Facts, speculations, and state-
ments in between. In BioLINK 2004: Linking Biological
Literature, Ontologies and Databases, pages 17–24. ACL.
Nassim Nicholas Taleb. 2007. The Black Swan: The Impact
of the Highly Improbable. Random House.
59