Báo cáo khoa học: "Assessing Dialog System User Simulation Evaluation Measures Using Human Judges" ppt
Bạn đang xem bản rút gọn của tài liệu. Xem và tải ngay bản đầy đủ của tài liệu tại đây (451.96 KB, 8 trang )
Proceedings of ACL-08: HLT, pages 622–629,
Columbus, Ohio, USA, June 2008.
c
2008 Association for Computational Linguistics
Assessing Dialog System User Simulation Evaluation Measures Using
Human Judges
Hua Ai
University of Pittsburgh
Pittsburgh PA, 15260, USA
Diane J. Litman
University of Pittsburgh
Pittsburgh, PA 15260, USA
Abstract
Previous studies evaluate simulated dialog
corpora using evaluation measures which can
be automatically extracted from the dialog
systems’ logs. However, the validity of these
automatic measures has not been fully proven.
In this study, we first recruit human judges
to assess the quality of three simulated dia-
log corpora and then use human judgments
as the gold standard to validate the conclu-
sions drawn from the automatic measures. We
observe that it is hard for the human judges
to reach good agreement when asked to rate
the quality of the dialogs from given perspec-
tives. However, the human ratings give con-
sistent ranking of the quality of simulated cor-
pora generated by different simulation mod-
els. When building prediction models of hu-
man judgments using previously proposed au-
tomatic measures, we find that we cannot reli-
ably predict human ratings using a regression
model, but we can predict human rankings by
a ranking model.
1 Introduction
User simulation has been widely used in different
phases in spoken dialog system development. In
the system development phase, user simulation is
used in training different system components. For
example, (Levin et al., 2000) and (Scheffler, 2002)
exploit user simulations to generate large corpora
for using Reinforcement Learning to develop dia-
log strategies, while (Chung, 2004) implement user
simulation to train the speech recognizer and under-
standing components.
While user simulation is considered to be more
low-cost and time-efficient than experiments with
human subjects, one major concern is how well the
state-of-the-art user simulations can mimic human
user behaviors and how well they can substitute for
human users in a variety of tasks. (Schatzmann
et al., 2005) propose a set of evaluation measures
to assess the quality of simulated corpora. They
find that these evaluation measures are sufficient
to discern simulated from real dialogs. Since this
multiple-measure approach does not offer a easily
reportable statistic indicating the quality of a user
simulation, (Williams, 2007) proposes a single mea-
sure for evaluating and rank-ordering user simula-
tions based on the divergence between the simulated
and real users’ performance. This new approach also
offers a lookup table that helps to judge whether an
observed ordering of two user simulations is statisti-
cally significant.
In this study, we also strive to develop a prediction
model of the rankings of the simulated users’ per-
formance. However, our approach use human judg-
ments as the gold standard. Although to date there
are few studies that use human judges to directly as-
sess the quality of user simulation, we believe that
this is a reliable approach to assess the simulated
corpora as well as an important step towards devel-
oping a comprehensive set of user simulation evalu-
ation measures. First, we can estimate the difficulty
of the task of distinguishing real and simulated cor-
pora by knowing how hard it is for human judges to
reach an agreement. Second, human judgments can
be used as the gold standard of the automatic evalua-
tion measures. Third, we can validate the automatic
622
measures by correlating the conclusions drawn from
the automatic measures with the human judgments.
In this study, we recruit human judges to assess
the quality of three user simulation models. Judges
are asked to read the transcripts of the dialogs be-
tween a computer tutoring system and the simula-
tion models and to rate the dialogs on a 5-point scale
from different perspectives. Judges are also given
the transcripts between human users and the com-
puter tutor. We first assess human judges’ abilities
in distinguishing real from simulated users. We find
that it is hard for human judges to reach good agree-
ment on the ratings. However, these ratings give
consistent ranking on the quality of the real and the
simulated user models. Similarly, when we use pre-
viously proposed automatic measures to predict hu-
man judgments, we cannot reliably predict human
ratings using a regression model, but we can consis-
tently mimic human judges’ rankings using a rank-
ing model. We suggest that this ranking model can
be used to quickly assess the quality of a new simu-
lation model without manual efforts by ranking the
new model against the old models.
2 Related Work
A lot of research has been done in evaluating differ-
ent components of Spoken Dialog Systems as well
as overall system performance. Different evaluation
approaches are proposed for different tasks. Some
studies (e.g., (Walker et al., 1997)) build regression
models to predict user satisfaction scores from the
system log as well as the user survey. There are also
studies that evaluate different systems/system com-
ponents by ranking the quality of their outputs. For
example, (Walker et al., 2001) train a ranking model
that ranks the outputs of different language genera-
tion strategies based on human judges’ rankings. In
this study, we build both a regression model and a
ranking model to evaluate user simulation.
(Schatzmann et al., 2005) summarize some
broadly used automatic evaluation measures for user
simulation and integrate several new automatic mea-
sures to form a comprehensive set of statistical eval-
uation measures. The first group of measures inves-
tigates how much information is transmitted in the
dialog and how active the dialog participants are.
The second group of measures analyzes the style of
the dialog and the last group of measures examines
the efficiency of the dialogs. While these automatic
measures are handy to use, these measures have not
been validated by humans.
There are well-known practices which validate
automatic measures using human judgments. For
example, in machine translation, BLEU score (Pa-
pineni et al., 2002) is developed to assess the quality
of machine translated sentences. Statistical analysis
is used to validate this score by showing that BLEU
score is highly correlated with the human judgment.
In this study, we validate a subset of the automatic
measures proposed by (Schatzmann et al., 2005) by
correlating the measures with human judgments. We
follow the design of (Linguistic Data Consortium,
2005) in obtaining human judgments. We call our
study an assessment study.
3 System and User Simulation Models
In this section, we describe our dialog system (IT-
SPOKE) and the user simulation models which
we use in the assessment study. ITSPOKE is
a speech-enabled Intelligent Tutoring System that
helps students understand qualitative physics ques-
tions. In the system, the computer tutor first presents
a physics question and the student types an essay
as the answer. Then, the tutor analyzes the essay
and initiates a tutoring dialog to correct misconcep-
tions and to elicit further explanations. A corpus
of 100 tutoring dialogs was collected between 20
college students (solving 5 physics problems each)
and the computer tutor, yielding 1388 student turns.
The correctness of student answers is automatically
judged by the system and kept in the system’s logs.
Our previous study manually clustered tutor ques-
tions into 20 clusters based on the knowledge (e.g.,
acceleration, Newton’s 3rd Law) that is required to
answer each question (Ai and Litman, 2007).
We train three simulation models from the real
corpus: the random model, the correctness model,
and the cluster model. All simulation models gener-
ate student utterances on the word level by picking
out the recognized student answers (with potential
speech recognition errors) from the human subject
experiments with different policies. The random
model (ran) is a simple unigram model which ran-
domly picks a student’s utterance from the real cor-
623
pus as the answer to a tutor’s question, neglecting
which question it is. The correctness model (cor)
is designed to give a correct/incorrect answer with
the same probability as the average of real students.
For each tutor’s question, we automatically compute
the average correctness rate of real student answers
from the system logs. Then, a correct/incorrect an-
swer is randomly chosen from the correct/incorrect
answer sets for this question. The cluster model
(clu) tries to model student learning by assuming
that a student will have a higher chance to give a
correct answer to the question of a cluster in which
he/she mostly answers correctly before. It computes
the conditional probability of whether a student an-
swer is correct/incorrect given the content of the tu-
tor’s question and the correctness of the student’s an-
swer to the last previous question that belongs to the
same question cluster. We also refer to the real stu-
dent as the real student model (real) in the paper.
We hypothesize that the ranking of the four student
models (from the most realistic to the least) is: real,
clu, cor, and ran.
4 Assessment Study Design
4.1 Data
We decided to conduct a middle-scale assessment
study that involved 30 human judges. We conducted
a small pilot study to estimate how long it took a
judge to answer all survey questions (described in
Section 4.2) in one dialog because we wanted to con-
trol the length of the study so that judges would not
have too much cognitive load and would be consis-
tent and accurate on their answers. Based on the pi-
lot study, we decided to assign each judge 12 dialogs
which took about an hour to complete. Each dialog
was assigned to two judges. We used three out of the
five physics problems from the original real corpus
to ensure the variety of dialog contents while keep-
ing the corpus size small. Therefore, the evaluation
corpus consisted of 180 dialogs, in which 15 dialogs
were generated by each of the 4 student models on
each of the 3 problems.
4.2 Survey Design
4.2.1 Survey questions
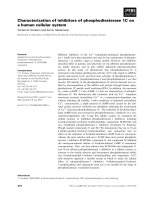
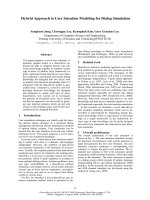
We designed a web survey to collect human judg-
ments on a 5-point scale on both utterance and di-
Figure 1: Utterance level questions.
alog levels. Each dialog is separated into pairs of
a tutor question and the corresponding student an-
swer. Figure 1 shows the three questions which
are asked for each tutor-student utterance pair. The
three questions assess the quality of the student an-
swers from three aspects of Grice’s Maxim (Grice,
1975): Maxim of Quantity (u QNT), Maxim of Rel-
evance (u RLV), and Maxim of Manner (u MNR).
We do not include the Maxim of Quality because in
our task domain the correctness of the student an-
swers depends largely on students’ physics knowl-
edge, which is not a factor we would like to consider
when evaluating the realness of the students’ dialog
behaviors.
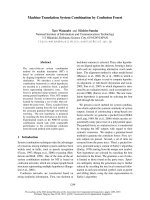
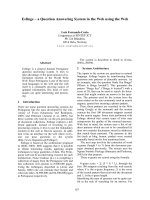
In Figure 2, we show the three dialog level ques-
tions which are asked at the end of each dialog.
The first question (d TUR) is a Turing test type of
question which aims to obtain an impression of the
student’s overall performance. The second ques-
tion (d QLT) assesses the dialog quality from a
tutoring perspective. The third question (d PAT)
sets a higher standard on the student’s performance.
Unlike the first two questions which ask whether
the student “looks” good, this question further asks
whether the judges would like to partner with the
particular student.
4.2.2 Survey Website
We display one tutor-student utterance pair and
the three utterance level questions on each web page.
After the judges answer the three questions, he/she
will be led to the next page which displays the next
pair of tutor-student utterances in the dialog with
the same three utterance level questions. The judge
624
Figure 2: Dialog level questions.
reads through the dialog in this manner and answers
all utterance level questions. At the end of the di-
alog, three dialog level questions are displayed on
one webpage. We provide a textbox under each di-
alog level question for the judge to type in a brief
explanation on his/her answer. After the judge com-
pletes the three dialog level questions, he/she will be
led to a new dialog. This procedure repeats until the
judge completes all of the 12 assigned dialogs.
4.3 Assessment Study
30 college students are recruited as human judges
via flyers. Judges are required to be native speak-
ers of American English to make correct judgments
on the language use and fluency of the dialog. They
are also required to have taken at least one course
on Newtonian physics to ensure that they can under-
stand the physics tutoring dialogs and make judg-
ments about the content of the dialogs. We follow
the same task assigning procedure that is used in
(Linguistic Data Consortium, 2005) to ensure a uni-
form distribution of judges across student models
and dialogs while maintaining a random choice of
judges, models, and dialogs. Judges are instructed to
work as quickly as comfortably possible. They are
encouraged to provide their intuitive reactions and
not to ponder their decisions.
5 Assessment Study Results
In the initial analysis, we observe that it is a difficult
task for human judges to rate on the 5-point scale
and the agreements among the judges are fairly low.
Table 1 shows for each question, the percentages of
d TUR d QLT d PAT u QNT u RLV u MNR
22.8% 27.8% 35.6% 39.2% 38.4% 38.7%
Table 1: Percent agreements on 5-point scale
pairs of judges who gave the same ratings on the 5-
point scale. For the rest of the paper, we collapse
the “definitely” types of answers with its adjacent
“probably” types of answers (more specifically, an-
swer 1 with 2, and 4 with 5). We substitute scores 1
and 2 with a score of 1.5, and scores 4 and 5 with a
score of 4.5. A score of 3 remains the same.
5.1 Inter-annotator agreement
Table 2 shows the inter-annotator agreements on the
collapsed 3-point scale. The first column presents
the question types. In the first row, “diff” stands
for the differences between human judges’ ratings.
The column “diff=0” shows the percent agreements
on the 3-point scale. We can see the improvements
from the original 5-point scale when comparing with
Table 1. The column “diff=1” shows the percentages
of pairs of judges who agree with each other on a
weaker basis in that one of the judges chooses “can-
not tell”. The column “diff=2” shows the percent-
ages of pairs of judges who disagree with each other.
The column “Kappa” shows the un-weighted kappa
agreements and the column “Kappa*” shows the lin-
ear weighted kappa. We construct the confusion ma-
trix for each question to compute kappa agreements.
Table 3 shows the confusion matrix for d TUR. The
first three rows of the first three columns show the
counts of judges’ ratings on the 3-point scale. For
example, the first cell shows that there are 20 cases
where both judges give 1.5 to the same dialog. When
calculating the linear weighted kappa, we define the
distances between the adjacent categories to be one
1
.
Note that we randomly picked two judges to rate
each dialog so that different dialogs are rated by dif-
ferent pairs of judges and one pair of judges only
worked on one dialog together. Thus, the kappa
agreements here do not reflect the agreement of one
pair of judges. Instead, the kappa agreements show
the overall observed agreement among every pair of
1
We also calculated the quadratic weighted kappa in which
the distances are squared and the kappa results are similar to the
linear weighted ones. For calculating the two weighted kappas,
see for details.
625
Q diff=0 diff=1 diff=2 Kappa Kappa*
d TUR 35.0% 45.6% 19.4% 0.022 0.079
d QLT 46.1% 28.9% 25.0% 0.115 0.162
d PAT 47.2% 30.6% 22.2% 0.155 0.207
u QNT 66.8% 13.9% 19.3% 0.377 0.430
u RLV 66.6% 17.2% 16.2% 0.369 0.433
u MNR 67.5% 15.4% 17.1% 0.405 0.470
Table 2: Agreements on 3-point scale
score=1.5 score=3 score=4.5 sum
score=1.5 20 26 20 66
score=3 17 11 19 47
score=4.5 15 20 32 67
sum 52 57 71 180
Table 3: Confusion Matrix on d TUR
judges controlling for the chance agreement.
We observe that human judges have low agree-
ment on all types of questions, although the agree-
ments on the utterance level questions are better
than the dialog level questions. This observation
indicates that assessing the overall quality of sim-
ulated/real dialogs on the dialog level is a difficult
task. The lowest agreement appears on d TUR.
We investigate the low agreements by looking into
judges’ explanations on the dialog level questions.
21% of the judges find it hard to rate a particular
dialog because that dialog is too short or the stu-
dent utterances mostly consist of one or two words.
There are also some common false beliefs among
the judges. For example, 16% of the judges think
that humans will say longer utterances while 9% of
the judges think that only humans will admit the ig-
norance of an answer.
5.2 Rankings of the models
In Table 4, the first column shows the name of the
questions; the second column shows the name of
the models; the third to the fifth column present the
percentages of judges who choose answer 1 and 2,
can’t tell, and answer 4 and 5. For example, when
looking at the column “1 and 2” for d TUR, we
see that 22.2% of the judges think a dialog by a
real student is generated probably or definitely by
a computer; more judges (25.6%) think a dialog by
the cluster model is generated by a computer; even
more judges (32.2%) think a dialog by the correct-
ness model is generated by a computer; and even
Question model 1 and 2 can’t tell 4 and 5
d TUR
real 22.2% 28.9% 48.9%
clu 25.6% 31.1% 43.3%
cor 32.2% 26.7% 41.1%
ran 51.1% 28.9% 20.0%
d QLT
real 20.0% 10.0% 70.0%
clu 21.1% 20.0% 58.9%
cor 24.4% 15.6% 60.0%
ran 60.0% 18.9% 21.1%
d PAT
real 28.9% 21.1% 50.0%
clu 41.1% 17.8% 41.1%
cor 43.3% 18.9% 37.8%
ran 82.2% 14.4% 3.4%
Table 4: Rankings on Dialog Level Questions
more judges (51.1%) think a dialog by the random
model is generated by a computer. When looking at
the column “4 and 5” for d TUR, we find that most
of the judges think a dialog by the real student is
generated by a human while the fewest number of
judges think a dialog by the random model is gen-
erated by a human. Given that more human-like is
better, both rankings support our hypothesis that the
quality of the models from the best to the worst is:
real, clu, cor, and ran. In other words, although it is
hard to obtain well-agreed ratings among judges, we
can combine the judges’ ratings to produce the rank-
ing of the models. We see consistent ranking orders
on d QLT and d PAT as well, except for a disorder
of cluster and correctness model on d QLT indicated
by the underlines.
When comparing two models, we can tell which
model is better from the above rankings. Neverthe-
less, we also want to know how significant the dif-
ference is. We use t-tests to examine the significance
of differences between every two models. We aver-
age the two human judges’ ratings to get an aver-
aged score for each dialog. For each pair of models,
we compare the two groups of the averaged scores
for the dialogs generated by the two models using
2-tail t-tests at the significance level of p < 0.05.
In Table 5, the first row presents the names of the
models in each pair of comparison. Sig means that
the t-test is significant after Bonferroni correction;
question mark (?) means that the t-test is signifi-
cant before the correction, but not significant after-
wards, we treat this situation as a trend; not means
that the t-test is not significant at all. The table shows
626
real- real- real- ran- ran- cor-
ran cor clu cor clu clu
d TUR sig not not sig sig not
d QLT sig not not sig sig not
d PAT sig ? ? sig sig not
u QNT sig not not sig sig not
u RLV sig not not sig sig not
u MNR sig not not sig sig not
Table 5: T-Tests Results
that only the random model is significantly different
from all other models. The correctness model and
the cluster model are not significantly different from
the real student given the human judges’ ratings, nei-
ther are the two models significantly different from
each other.
5.3 Human judgment accuracy on d TUR
We look further into d TUR in Table 4 because it is
the only question that we know the ground truth. We
compute the accuracy of human judgment as (num-
ber of ratings 4&5 on real dialogs + number of rat-
ings of 1&2 on simulated dialogs)/(2*total number
of dialogs). The accuracy is 39.44%, which serves
as further evidence that it is difficult to discern hu-
man from simulated users directly. A weaker accu-
racy is calculated to be 68.35% when we treat “can-
not tell” as a correct answer as well.
6 Validating Automatic Measures
Since it is expensive to use human judges to rate
simulated dialogs, we are interested in building pre-
diction models of human judgments using auto-
matic measures. If the prediction model can re-
liably mimic human judgments, it can be used to
rate new simulation models without collecting hu-
man ratings. In this section, we use a subset of the
automatic measures proposed in (Schatzmann et al.,
2005) that are applicable to our data to predict hu-
man judgments. Here, the human judgment on each
dialog is calculated as the average of the two judges’
ratings. We focus on predicting human judgments
on the dialog level because these ratings represent
the overall performance of the student models. We
use six high-level dialog feature measures including
the number of student turns (Sturn), the number of
tutor turns (Tturn), the number of words per stu-
dent turn (Swordrate), the number of words per tu-
tor turn (Twordrate), the ratio of system/user words
per dialog (WordRatio), and the percentage of cor-
rect answers (cRate).
6.1 The Regression Model
We use stepwise multiple linear regression to model
the human judgments using the set of automatic fea-
tures we listed above. The stepwise procedure au-
tomatically selects measures to be included in the
model. For example, d TUR is predicted as 3.65 −
0.08 ∗ W ordRatio − 3.21 ∗ Swordrate, with an
R-square of 0.12. The prediction models for d QLT
and d PAT have similar low R-square values of 0.08
and 0.17, respectively. This result is not surprising
because we only include the surface level automatic
measures here. Also, these measures are designed
for comparison between models instead of predic-
tion. Thus, in Section 6.2, we build a ranking model
to utilize the measures in their comparative manner.
6.2 The Ranking Model
We train three ranking models to mimic human
judges’ rankings of the real and the simulated stu-
dent models on the three dialog level questions using
RankBoost, a boosting algorithm for ranking ((Fre-
und et al., 2003), (Mairesse et al., 2007)). We briefly
explain the algorithm using the same terminologies
and equations as in (Mairesse et al., 2007), by build-
ing the ranking model for d TUR as an example.
In the training phase, the algorithm takes as input
a group of dialogs that are represented by values of
the automatic measures and the human judges’ rat-
ings on d TUR. The RankBoost algorithm treats the
group of dialogs as ordered pairs:
T = {(x, y)| x, y are two dialog samples,
x has a higher human rated score than y }
Each dialog x is represented by a set of m indica-
tor functions h
s
(x) (1 ≤ s ≤ m). For example:
h
s
(x) =
1 if WordRatio(x) ≥ 0.47
0 otherwise
Here, the threshold of 0.47 is calculated by Rank-
Boost. α is a parameter associated with each indi-
cator function. For each dialog, a ranking score is
627
calculated as:
F (x) =
s
α
s
h
s
(x) (1)
In the training phase, the human ratings are used
to set α by minimizing the loss function:
LOSS =
1
|T |
(x,y )∈T
eval(F(x) ≤ F(y)) (2)
The eval function returns 0 if (x, y) pair is ranked
correctly, and 1 otherwise. In other words, LOSS
score is the percentage of misordered pairs where
the order of the predicted scores disagree with the
order indicated by human judges. In the testing
phase, the ranking score for every dialog is cal-
culated by Equation 1. A baseline model which
ranks dialog pairs randomly produces a LOSS of 0.5
(lower is better).
While LOSS indicates how many pairs of dialogs
are ranked correctly, our main focus here is to rank
the performance of the four student models instead
of individual dialogs. Therefore, we propose another
Averaged Model Ranking (AMR) score. AMR is
computed as the sum of the ratings of all the dialogs
generated by one model averaged by the number of
the dialogs. The four student models are then ranked
based on their AMR scores. The chance to get the
right ranking order of the four student models by
random guess is 1/(4!).
Table 6 shows a made-up example to illustrate the
two measures. real 1 and real 2 are two dialogs gen-
erated by the real student model; ran 1 and ran 2
are two dialogs by the random model. The second
and third column shows the human-rated score as the
gold standard and the machine-predicted score in the
testing phase respectively. The LOSS in this exam-
ple is 1/6, because only the pair of real 2 and ran 1
is misordered out of all the 6 possible pair combina-
tions. We then compute the AMR of the two models.
According to human-rated scores, the real model is
scored 0.75 (=(0.9+0.6)/2) while the random model
is scored 0.3. When looking at the predicted scores,
the real model is scored 0.65, which is also higher
than the random model with a score of 0.4. We thus
conclude that the ranking model ranks the two stu-
dent models correctly according to the overall rating
measure. We use both LOSS and AMR to evaluate
the ranking models.
Dialog Human-rated Score Predicted Score
real 1 0.9 0.9
real 2 0.6 0.4
ran 1 0.4 0.6
ran 2 0.2 0.2
Table 6: A Made-up Example of the Ranking Model
Cross Validation d TUR d QLT d PAT
Regular 0.176 0.155 0.151
Minus-one-model 0.224 0.180 0.178
Table 7: LOSS scores for Regular and Minus-one-model
(during training) Cross Validations
First, we use regular 4-fold cross validation where
we randomly hold out 25% of the data for testing
and train on the remaining 75% of the data for 4
rounds. Both the training and the testing data consist
of dialogs equally distributed among the four student
models. However, since the practical usage of the
ranking model is to rank a new model against sev-
eral old models without collecting additional human
ratings, we further test the algorithm by repeating
the 4 rounds of testing while taking turns to hold out
the dialogs from one model in the training data, as-
suming that model is the new model that we do not
have human ratings to train on. The testing corpus
still consists of dialogs from all four models. We call
this approach the minus-one-model cross validation.
Table 7 shows the LOSS scores for both cross val-
idations. Using 2-tailed t-tests, we observe that the
ranking models significantly outperforms the ran-
dom baseline in all cases after Bonferroni correction
(p < 0.05). When comparing the two cross vali-
dation results for the same question, we see more
LOSS in the more difficult minus-one-model case.
However, the LOSS scores do not offer a direct
conclusion on whether the ranking model ranks the
four student models correctly or not. To address
this question, we use AMR scores to re-evaluate all
cross validation results. Table 8 shows the human-
rated and predicted AMR scores averaged over four
rounds of testing on the regular cross validation re-
sults. We see that the ranking model gives the
same rankings of the student models as the human
judges on all questions. When applying AMR on
the minus-one-model cross validation results, we see
similar results that the ranking model reproduces hu-
628
real clu cor ran
human predicted human predicted human predicted human predicted
d TUR 0.68 0.62 0.65 0.59 0.63 0.52 0.51 0.49
d QLT 0.75 0.71 0.71 0.63 0.69 0.61 0.48 0.50
d PAR 0.66 0.65 0.60 0.60 0.58 0.57 0.31 0.32
Table 8: AMR Scores for Regular Cross Validation
man judges’ rankings. Therefore, we suggest that
the ranking model can be used to evaluate a new
simulation model by ranking it against several old
models. Since our testing corpus is relatively small,
we would like to confirm this result on a large corpus
and on other dialog systems in the future.
7 Conclusion and Future Work
Automatic evaluation measures are used in evaluat-
ing simulated dialog corpora. In this study, we inves-
tigate a set of previously proposed automatic mea-
sures by comparing the conclusions drawn by these
measures with human judgments. These measures
are considered as valid if the conclusions drawn by
these measures agree with human judgments. We
use a tutoring dialog corpus with real students, and
three simulated dialog corpora generated by three
different simulation models trained from the real
corpus. Human judges are recruited to read the di-
alog transcripts and rate the dialogs by answering
different utterance and dialog level questions. We
observe low agreements among human judges’ rat-
ings. However, the overall human ratings give con-
sistent rankings on the quality of the real and sim-
ulated user models. Therefore, we build a ranking
model which successfully mimics human judgments
using previously proposed automatic measures. We
suggest that the ranking model can be used to rank
new simulation models against the old models in or-
der to assess the quality of the new model.
In the future, we would like to test the ranking
model on larger dialog corpora generated by more
simulation models. We would also want to include
more automatic measures that may be available in
the richer corpora to improve the ranking and the
regression models.
Acknowledgments
This work is supported by NSF 0325054. We thank
J. Tereault, M. Rotaru, K. Forbes-Riley and the
anonymous reviewers for their insightful sugges-
tions, F. Mairesse for helping with RankBoost, and
S. Silliman for his help in the survey experiment.
References
H. Ai and D. Litman. 2007. Knowledge Consistent User
Simulations for Dialog Systems. In Proc. of Inter-
speech 2007.
G. Chung. 2004. Developing a Flexible Spoken Dialog
System Using Simulation. In Proc. of ACL 04.
Y. Freund, R. Iyer, R.E. Schapire, and Y. Singer. 2003.
An Efficient Boosting Algorithm for Combining Pref-
erences. Journal of Machine Learning Research.
H. P. Grice 1975. Logic and Conversation. Syntax and
Semantics III: Speech Acts, 41-58.
E. Levin, R. Pieraccini, and W. Eckert. 2000. A Stochas-
tic Model of Human-Machine Interaction For learning
Dialog Strategies. IEEE Trans. On Speech and Audio
Processing, 8(1):11-23.
Linguistic Data Consortium. 2005. Linguistic Data An-
notation Specification: Assessment of Fluency and Ad-
equacy in Translations.
F. Mairesse, M. Walker, M. Mehl and R. Moore. 2007.
Using Linguistic Cues for the Automatic Recognition
of Personality in Conversation and Text. Journal of
Artificial Intelligence Research, Vol 30, pp 457-501.
K.A. Papineni, S. Roukos, R.T. Ward, and W-J. Zhu.
2002. Bleu: A Method for Automatic Evaluation of
Machine Translation. In Proc. of 40th ACL.
J. Schatzmann, K. Georgila, and S. Young. 2005. Quan-
titative Evaluation of User Simulation Techniques for
Spoken Dialog Systems. In Proc. of 6th SIGdial.
K. Scheffler. 2002. Automatic Design of Spoken Dialog
Systems. Ph.D. diss., Cambridge University.
J. D. Williams. 2007. A Method for Evaluating and Com-
paring User Simulations: The Cramer-von Mises Di-
vergence. Proc IEEE Workshop on Automatic Speech
Recognition and Understanding (ASRU).
M. Walker, D. Litman, C. Kamm, and A. Abella. 1997.
PARADISE: A Framework for Evaluating Spoken Dia-
log Agents. In Proc. of ACL 97.
M. Walker, O. Rambow, and M. Rogati. 2001. SPoT: A
Trainable Sentence Planner. In Proc. of NAACL 01.
629