Báo cáo khoa học: "Syntax is from Mars while Semantics from Venus! Insights from Spectral Analysis of Distributional Similarity Networks" ppt
Bạn đang xem bản rút gọn của tài liệu. Xem và tải ngay bản đầy đủ của tài liệu tại đây (206.66 KB, 4 trang )
Proceedings of the ACL-IJCNLP 2009 Conference Short Papers, pages 245–248,
Suntec, Singapore, 4 August 2009.
c
2009 ACL and AFNLP
Syntax is from Mars while Semantics from Venus!
Insights from Spectral Analysis of Distributional Similarity Networks
Chris Biemann
Microsoft/Powerset, San Francisco
Monojit Choudhury
Microsoft Research Lab India
Animesh Mukherjee
Indian Institute of Technology Kharagpur, India
Abstract
We study the global topology of the syn-
tactic and semantic distributional similar-
ity networks for English through the tech-
nique of spectral analysis. We observe that
while the syntactic network has a hierar-
chical structure with strong communities
and their mixtures, the semantic network
has several tightly knit communities along
with a large core without any such well-
defined community structure.
1 Introduction
Syntax and semantics are two tightly coupled, yet
very different properties of any natural language
– as if one is from “Mars” and the other from
“Venus”. Indeed, this exploratory work shows that
the distributional properties of syntax are quite dif-
ferent from those of semantics. Distributional hy-
pothesis states that the words that occur in the
same contexts tend to have similar meanings (Har-
ris, 1968). Using this hypothesis, one can define a
vector space model for words where every word
is a point in some n-dimensional space and the
distance between them can be interpreted as the
inverse of the semantic or syntactic similarity be-
tween their corresponding distributional patterns.
Usually, the co-occurrence patterns with respect to
the function words are used to define the syntactic
context, whereas that with respect to the content
words define the semantic context. An alternative,
but equally popular, visualization of distributional
similarity is through graphs or networks, where
each word is represented as nodes and weighted
edges indicate the extent of distributional similar-
ity between them.
What are the commonalities and differences be-
tween the syntactic and semantic distributional
patterns of the words of a language? This study is
an initial attempt to answer this fundamental and
intriguing question, whereby we construct the syn-
tactic and semantic distributional similarity net-
work (DSN) and analyze their spectrum to un-
derstand their global topology. We observe that
there are significant differences between the two
networks: the syntactic network has well-defined
hierarchical community structure implying a sys-
tematic organization of natural classes and their
mixtures (e.g., words which are both nouns and
verbs); on the other hand, the semantic network
has several isolated clusters or the so called tightly
knit communities and a core component that lacks
a clear community structure. Spectral analysis
also reveals the basis of formation of the natu-
ral classes or communities within these networks.
These observations collectively point towards a
well accepted fact that the semantic space of nat-
ural languages has extremely high dimension with
no clearly observable subspaces, which makes the-
orizing and engineering harder compared to its
syntactic counterpart.
Spectral analysis is the backbone of several
techniques, such as multi-dimensional scaling,
principle component analysis and latent semantic
analysis, that are commonly used in NLP. In re-
cent times, there have been some work on spec-
tral analysis of linguistic networks as well. Belkin
and Goldsmith (2002) applied spectral analysis to
understand the struture of morpho-syntactic net-
works of English words. The current work, on
the other hand, is along the lines of Mukherjee et
al. (2009), where the aim is to understand not only
the principles of organization, but also the global
topology of the network through the study of the
spectrum. The most important contribution here,
however, lies in the comparison of the topology
of the syntactic and semantic DSNs, which, to the
best of our knowledge, has not been explored pre-
viously.
245
2 Network Construction
The syntactic and semantic DSNs are constructed
from a raw text corpus. This work is restricted to
the study of English DSNs only
1
.
Syntactic DSN: We define our syntactic net-
work in a similar way as previous works in unsu-
pervised parts-of-speech induction (cf. (Sch
¨
utze,
1995; Biemann, 2006)): The most frequent 200
words in the corpus (July 2008 dump of English
Wikipedia) are used as features in a word window
of ±2 around the target words. Thus, each target
word is described by an 800-dimensional feature
vector, containing the number of times we observe
one of the most frequent 200 words in the respec-
tive positions relative to the target word. In our
experiments, we collect data for the most frequent
1000 and 5000 target words, arguing that all syn-
tactic classes should be represented in those. A
similarity measure between target words is defined
by the cosine between the feature vectors. The
syntactic graph is formed by inserting the target
words as nodes and connecting nodes with edge
weights equal to their cosine similarity if this sim-
ilarity exceeds a threshold t = 0.66.
Semantic DSN: The construction of this net-
work is inspired by (Lin, 1998). Specifically,
we parsed a dump of English Wikipedia (July
2008) with the XLE parser (Riezler et al., 2002)
and extracted the following dependency relations
for nouns: Verb-Subject, Verb-Object, Noun-
coordination, NN-compound, Adj-Mod. These
lexicalized relations act as features for the nouns.
Verbs are recorded together with their subcatego-
rization frame, i.e. the same verb lemmas in dif-
ferent subcat frames would be treated as if they
were different verbs. We compute log-likelihood
significance between features and target nouns (as
in (Dunning, 1993)) and keep only the most signif-
icant 200 features per target word. Each feature f
gets a feature weight that is inversely proportional
to the logarithm of the number of target words it
applies on. The similarity of two target nouns is
then computed as the sum of the feature weights
they share. For our analysis, we restrict the graph
to the most frequent 5000 target common nouns
and keep only the 200 highest weighted edges per
target noun. Note that the degree of a node can
1
As shown in (Nath et al., 2008), the basic structure
of these networks are insensitive to minor variations in the
parameters (e.g., thresholds and number of words) and the
choice of distance metric.
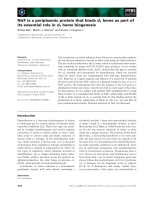
Figure 1: The spectrum of the syntactic and se-
mantic DSNs of 1000 nodes.
still be larger than 200 if this node is contained in
many 200 highest weighted edges of other target
nouns.
3 Spectrum of DSNs
Spectral analysis refers to the systematic study of
the eigenvalues and eigenvectors of a network. Al-
though here we study the spectrum of the adja-
cency matrix of the weighted networks, it is also
quite common to study the spectrum of the Lapla-
cian of the adjacency matrix (see for example,
Belkin and Goldsmith (2002)). Fig. 1 compares
the spectrum of the syntactic and semantic DSNs
with 1000 nodes, which has been computed as fol-
lows. First, the 1000 eigenvalues of the adjacency
matrix are sorted in descending order. Then we
compute the spectral coverage till the ith eigen-
value by adding the squares of the first i eigenval-
ues and normalizing it by the sum of the squares
of all the eigenvalues - a quantity also known as
the Frobenius norm of the matrix.
We observe that for the semantic DSN the first
10 eigenvalues cover only 40% of the spectrum
and the first 500 together make up 75% of the
spectrum. On the other hand, for the syntactic
DSN, the first 10 eigenvalues cover 75% of the
spectrum while the first 20 covers 80%. In other
words, the structure of the syntactic DSN is gov-
erned by a few (order of 10) significant principles,
whereas that of the semantic DSN is controlled by
a large number of equally insignificant factors.
The aforementioned observation has the fol-
lowing alternative, but equivalent interpretations:
(a) the syntactic DSN can be clustered in lower
dimensions (e.g., 10 or 20) because, most of
the rows in the matrix can be approximately ex-
pressed as a linear combination of the top 10 to 20
246
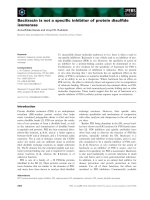
Figure 2: Plot of corpus frequency based rank vs.
eigenvector centrality of the words in the DSNs of
5000 nodes.
eigenvectors. Furthermore, the graceful decay of
the eigenvalues of the syntactic DSN implies the
existence of a hierarchical community structure,
which has been independently verified by Nath et
al. (2008) through analysis of the degree distribu-
tion of such networks; and (b) a random walk con-
ducted on the semantic DSN will have a high ten-
dency to drift away very soon from the semantic
class of the starting node, whereas in the syntactic
DSN, the random walk is expected to stay within
the same syntactic class for a long time. There-
fore, it is reasonable to advocate that characteriza-
tion and processing of syntatic classes is far less
confusing than that of the semantic classes – a fact
that requires no emphasis.
4 Eigenvector Analysis
The first eigenvalue tells us to what extent the
rows of the adjacency matrix are correlated and
therefore, the corresponding eigenvector is not a
dimension pointing to any classificatory basis of
the words. However, as we shall see shortly, the
other eigenvectors corresponding to the signifi-
cantly high eigenvalues are important classifica-
tory dimensions.
Fig 2 shows the plot of the first eigenvector
component (aka eigenvector centrality) of a word
versus its rank based on the corpus frequency. We
observe that the very high frequency (i.e., low
rank) nodes in both the networks have low eigen-
vector centrality, whereas the medium frequency
nodes display a wide range of centrality values.
However, the most striking difference between the
networks is that while in the syntactic DSN the
centrality values are approximately normally dis-
tributed for the medium frequency words, the least
frequent words enjoy the highest centrality for the
semantic DSN. Furthermore, we observe that the
most central nodes in the semantic DSN corre-
spond to semantically unambiguous words of sim-
ilar nature (e.g., deterioration, abandonment, frag-
mentation, turmoil). This indicates the existence
of several “tightly knit communities consisting of
not so high frequency words” which pull in a sig-
nificant fraction of the overall centrality. Since
the high frequency words are usually polysemous,
they on the other hand form a large, but non-
cliqueish structure at the core of the network with
a few connections to the tightly knit communities.
This is known as the tightly knit community ef-
fect (TKC effect) that renders very low central-
ity values to the “truly” central nodes of the net-
work (Lempel and Moran, 2000). The structure
of the syntactic DSN, however, is not governed by
the TKC effect to such an extreme extent. Hence,
one can expect to easily identify the natural classes
of the syntactic DSN, but not its semantic counter-
part.
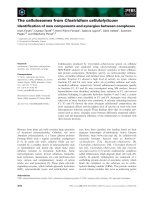
In fact, this observation is further corroborated
by the higher eigenvectors. Fig. 3 shows the plot
of the second eigenvector component versus the
fourth one for the two DSNs consisting of 5000
words. It is observed that for the syntactic net-
work, the words get neatly clustered into two sets
comprised of words with the positive and negative
second eigenvector components. The same plot
for the semantic DSN shows that a large number of
words have both the components close to zero and
only a few words stand out on one side of the axes
– those with positive second eigenvector compo-
nent and those with negative fourth eigenvector
component. In essence, none of these eigenvec-
tors can neatly classify the words into two sets –
a trend which is observed for all the higher eigen-
vectors (we conducted experiments for up to the
twentieth eigenvector).
Study of the individual eignevectors further re-
veals that the nodes with either the extreme pos-
itive or the extreme negative components have
strong linguistic correlates. For instance, in the
syntactic DSN, the two ends of the second eigen-
247
Figure 3: Plot of the second vs. fourth eigenvector
components of the words in the DSNs.
vector correspond to nouns and adjectives; one of
the ends of the fourth, fifth, sixth and the twelfth
eigenvectors respectively correspond to location
nouns, prepositions, first names and initials, and
verbs. In the semantic DSN, one of the ends of
the second, third, fourth and tenth eigenvectors
respectively correspond to professions, abstract
terms, food items and body parts. One would ex-
pect that the higher eigenvectors (say the 50
th
one)
would show no clear classificatory basis for the
syntactic DSN, while for the semantic DSN those
could be still associated with prominent linguistic
correlates.
5 Conclusion and Future Work
Here, we presented some initial investigations into
the nature of the syntactic and semantic DSNs
through the method of spectral analysis, whereby
we could observe that the global topology of the
two networks are significantly different in terms
of the organization of their natural classes. While
the syntactic DSN seems to exhibit a hierarchi-
cal structure with a few strong natural classes and
their mixtures, the semantic DSN is composed of
several tightly knit small communities along with
a large core consisting of very many smaller ill-
defined and ambiguous sets of words. To visual-
ize, one could draw an analogy of the syntactic
and semantic DSNs respectively to “crystalline”
and “amorphous” solids.
This work can be furthered in several directions,
such as, (a) testing the robustness of the findings
across languages, different network construction
policies, and corpora of different sizes and from
various domains; (b) clustering of the words on the
basis of eigenvector components and using them in
NLP applications such as unsupervised POS tag-
ging and WSD; and (c) spectral analysis of Word-
Net and other manually constructed ontologies.
Acknowledgement
CB and AM are grateful to Microsoft Research
India, respectively for hosting him while this re-
search was conducted, and financial support.
References
M. Belkin and J. Goldsmith 2002. Using eigenvec-
tors of the bigram graph to infer morpheme identity.
In Proceedings of the ACL-02 Workshop on Morpho-
logical and Phonological Learning, pages 4147, As-
sociation for Computational Linguistics.
Chris Biemann 2006. Unsupervised part-of-speech
tagging employing efficient graph clustering. In
Proceedings of the COLING/ACL-06 Student Re-
search Workshop.
Ted Dunning 1993. Accurate methods for the statis-
tics of surprise and coincidence. In Computational
Linguistics 19, 1, pages 61–74
Z.S. Harris 1968. Mathematical Structures of Lan-
guage. Wiley, New York.
R. Lempel and S. Moran 2000. The stochastic ap-
proach for link-structure analysis (SALSA) and the
TKC effect. In Computer Networks, 33, pages 387-
401
Dekang Lin 1998. Automatic retrieval and clustering
of similar words. In Proceedings of COLING’98.
Animesh Mukherjee, Monojit Choudhury and Ravi
Kannan 2009. Discovering Global Patterns in Lin-
guistic Networks through Spectral Analysis: A Case
Study of the Consonant Inventories. In The Pro-
ceedings of EACL 2009, pages 585-593.
Joydeep Nath, Monojit Choudhury, Animesh Mukher-
jee, Christian Biemann and Niloy Ganguly 2008.
Unsupervised parts-of-speech induction for Bengali.
In The Proceedings of LREC’08, ELRA.
S. Riezler, T.H. King, R.M. Kaplan, R. Crouch, J.T.
Maxwell, M. Johnson 2002. Parsing the Wall Street
Journal using a lexical-functional grammar and dis-
criminative estimation techniques. In Proceedings
of the 40th Annual Meeting of the ACL, pages 271-
278.
Hinrich Sch
¨
utze 1995. Distributional part-of-speech
tagging. In Proceedings of EACL, pages 141-148.
248