Rupture process of the 2014 orkney earthquake, South Africa
Bạn đang xem bản rút gọn của tài liệu. Xem và tải ngay bản đầy đủ của tài liệu tại đây (560.03 KB, 7 trang )
Journal of Marine Science and Technology; Vol. 17, No. 4B; 2017: 75-81
DOI: 10.15625/1859-3097/17/4B/12995
/>
RUPTURE PROCESS OF THE 2014 ORKNEY
EARTHQUAKE, SOUTH AFRICA
Okubo Makoto1*, Artur Cichowicz2, Hiroshi Ogasawara2,3,
Osamu Murakami4, Shigeki Horiuchi5
1
Kochi University, Japan
JICA-JST SATREPS, South Africa
3
Ritsumeikan University, Japan
4
Association for the Development of Earthquake Prediction, Japan
5
Home Seismometer Corporation, Japan
*
E-mail:
2
Received: 9-11-2017
ABSTRACT: An earthquake has occurred at 10:22:33 UT on 5 August 2014 in the Klerksdorp
district, the North West province of South Africa. Its hypocenter is located beneath an Orkney town,
where more than 10 gold mines exist. The Council for Geoscience (CGS) in South Africa reported
that the magnitude and depth was M L5.5 and 4.7 km, respectively. CGS has been operating 17
surface seismic acceleration stations with 10 km interval in average, and obtained continuous
acceleration seismograms through the time of the earthquake and following aftershocks. Using these
seismograms, we analyzed the mainshock rupture process of this earthquake. Analyzing these
seismograms, we found the ‘initial rupture’ with a Richter scale approximately 4 has occurred 0.3
sec before mainshock. Furthermore, by applying detailed aftershock distribution analysis, we found
most of aftershocks occurred surrounding upper and southern part of mainshock rupture area,
including initial rupture hypocenter. In order to understand detailed rupture process of this event, we
surveyed for strong motion generating area (SMGA) of mainshock by applying Isochrones
backprojection method (IBM) to the mainshock S wave waveforms. SMGA distribution seems to
fill the vacant space of the aftershock distribution and initial rupture’s hypocenter. And we also
found that a horizontal layered seismic vacancy exists between aftershocks with gold mine
blastings. This fact implies mainshock rupture did not extent up to gold mine.
Keywords: Aftershock distribution, isochrones backprojection method, multiple rupture, strong
motion generating area, tectonic earthquake.
INTRODUCTION
2014 Orkney earthquake (ML5.5) has
occurred beneath the Orkney town, Klerksdorp
district in the North West province, located at
south-westward of the Pretoria, capital of the
Republic of South Africa (fig. 1). This town
has more than 10 gold mines whose vertical
mining shafts reaches to 3.6 km below the
ground surface (BGS). Global CMT website [1]
summarized this earthquake information that
PDEW origin time was 10:22:34.00UT, 5th
Aug 2014, and its hypocenter was located at
26.99°S, 26.71°E, depth 5 km, with magnitude
MS 5.4, and also reported CMT origin time was
10:22:36.20, and its hypocenter of centroid was
at 26.83°S, 26.79°E, depth 12 km with MW 5.5.
CMT solution implies that fault mechanism of
75
Okubo Makoto, Artur Cichowicz,…
Orkney earthquake is NNW trending right
lateral strike fault (see also fig. 1). According
to this summary, origin time and hypocenter
depth is quite different with PDEW and CMT.
However, these differences seem to be caused
by the hypocenter estimation method. PDEW,
which is the Preliminary Determination of
Epicenters [2], used tele-seismic phase arrival
times and their amplitude, on the other hand,
CMT, centroid moment tensor solution, used
broadband waveforms of body-waves. Council
for Geoscience (CGS), National Institute of the
Republic of South Africa, reports hypocenter
depth and magnitude of the earthquake, 5 km
and ML5.5, respectively [3]. Fortunately, CGS
had established and been operating seismic
network with ground acceleration seismographs
around the Orkney town (see small upper-left
column of fig. 1) as project ‘Observational
Studies in South African Mines to Mitigate
Seismic Risks’ of JICA-JST SATREPS [4].
CGS's hypocentral information estimation used
this network seismograms data. This dense
seismograph network above on hypocenter will
provide us enough seismograms to understand
earthquake rupture process, in spite of the fact
that its magnitude is not so large and depth is
quite shallow. In this paper, using these
seismograms we will clarify the rupture process
of the 2014 Orkney earthquake to understand
the relationships among mainshock hypocenter
and its strong ground motion area distribution,
and aftershock distribution.
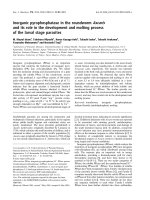
We will show a map of the Republic of
South Africa (SA) in background. Star shows
the epicenter of the 2014 Orkney earthquake by
Global CMT (2014), and CMT solution is also
shown at lower right. Upper-left small map
shows close-up view around the epicenter,
which near Orkney town located southwestwards from the Pretoria, capital of SA.
Epicenter of aftershocks, which occurred
within following 12 hours after mainshock, are
shown by cross, in this map. Furthermore,
ground acceleration seismographs network,
which has been established by CGS, are shown
by invert triangles with station codes.
76
Fig. 1. Epicenters of the 2014 Orkney
earthquake and aftershocks
ANALYSES
We checked all seismograms of the
mainshock at first, because for shallow depth
earthquake with strong motions, waveforms
are sometimes saturated and/or unstable. 16
ground acceleration seismograms are shown in
fig. 2. We used these seismograms for
following analyses, identification for phase
arrivals, hypocenter determination, estimation
of magnitude, and search for strong motion
generating area. Unfortunately, at two
stations, KDGC and WDF, their seismograms
are unstable and saturated its amplitude before
S wave arrival, thus we could use these
stations only for hypocenter determination. By
50 times magnified to waveform amplitude
near P-wave arrival (gray colored) for all
seismograms, we can find small amplitude
variation approximately 0.2 - 0.4 seconds
before mainshock's P wave arrival in vertical
component. Additionally, their differences of
arrival times seemed to be varied with their
azimuth. We carefully picked up two pairs of
P- and S- wave arrival times from
mainshock’s seismograms, by using WIN
system [5]. These pairs of phase arrivals
indicate two slightly distant hypocenters, with
0.3 second differences of their origin time, by
applying hypoMH [6] hypocenter estimation.
Comparing P wave amplitudes of vertical
component in PNMR RCAS and VMBD
between main large rupture with the first small
Rupture process of the 2014 orkney earthquake,…
event, the first one called the ‘initial rupture’
has only approximately 1-2% amplitude for
each station.
Table 1. P-wave velocity structure for our analyses
VS (km/s)
Depth (km)
hypoMH
5.10
5.10
5.78
hypoDD
2.00
5.10
5.78
-3.0
Fig. 2. Seismograms of the 2014 Orkney
earthquake
Ground acceleration seismograms of
mainshock are shown. In order to identify
initial rupture phases, 50 times amplified
waveforms were overlaid below the original
waveforms of VRVW, MOAB, VRCP, VMBD,
RCAS and PNMR. Solid dots laid on each
seismogram indicate P- and S-phase arrival,
which we had picked up. Large and small dots
are corresponding to the initial rupture and
main rupture, respectively.
The 2014 Orkney earthquake's mainshock,
which includes the initial rupture and the main
rupture, and aftershock hypocenters had been
determined as absolutely and individually.
Next, we would like to understand the spatial
relationship of each hypocenter locations. We
applied
double-difference
hypocenter
relocation method, hypoDD [7] to initial- and
main
ruptures,
aftershock
hypocenter
distribution. Appling this analysis, we can
understand the distribution as relative locations
to the initial rupture’s hypocenter. CGS seismic
event catalogue, which had been determined
with
Horiuchi’s
automatic
hypocenter
determination method [8], has included 337
aftershocks between approximately a half day
until the end of 5 Aug. 2014. Using P- and S-
0.0
2.0
6.10
6.10
17.0
wave arrival time pairs of each event in CGS
catalogue and of the initial- and main ruptures,
we applied hypoDD program. In order to avoid
earthquake hypocenters being located above
surface (i.e. air focus), we introduced following
assumption for hypocenter relocation, quite
slow P-wave velocity at shallow layer (< 0 km
elevation, shown in table 1). After elimination
for some outlier aftershock events, we analyzed
247 events, 69680 P arrival time pairs and
59777 S arrival time pairs, by minimizing
weighted least squares using the method of
singular value decomposition (SVD). Finally,
143 events were relocated as relatively to the
hypocenter of the initial rupture of the 2014
Orkney earthquake. As the result, we obtained
that a hypocenter distribution which most of
aftershocks have been located on a plane with
NNW trended and slightly west inclined.
Furthermore, viewing in detail, almost all of
aftershocks have occurred at southern and
upper part of hypocenter of initial rupture. In
order to understand the reason for these
inhomogeneous aftershock distributions, in the
other words, aftershock vacancy of northern
and downward part of initial rupture, we will
try to estimate rupture process of this
earthquake. In general, in the case of not so
large Richter’s scale earthquake, detail of
rupture process is quite difficult to estimate.
Because the 2014 Orkney earthquake Richter's
scale is also not so large, in this study we will
combine some analyses, initial rupture
identification, aftershock distribution and
isochrones back projection (IBM) to estimate
rupture process.
In ordinary IBM analysis, we will
investigate locations that have large rupture
velocity on assumed fault plane by using S
wave amplitude time variation [9]. However,
for the case of not so larger earthquake, its
77
Okubo Makoto, Artur Cichowicz,…
rupture duration (c.f. Global CMT half
duration: 1.3 sec) and spatial rupture extension
(< 2 km) will be not enough for rupture
velocity distribution estimation. Therefore, we
only investigated the location of large
amplitude S wave generating around the initial
rupture hypocenter using with main rupture S
wave amplitude variation. We consider that this
distribution corresponds to the spatial strong
motion generating area (SMGA) distribution.
Practically, SMGA distribution will be masked
by main rupture's first S wave with mostly
maximum amplitude arrival. Therefore, we
assumed ideal S wave amplitude variation
(fig. 3), and we calculated ideal SMGA spatial
distribution by using this amplitude variation.
Finally, we applied deconvolution to these two
results calculated from observation and ideal
waveform. We can evaluate where excess S
wave amplitudes generated around the initial
rupture's hypocenter in this process.
Additionally, because we did not assume a fault
plane, we will be able to find SMGA
distribution off the fault plane, too. We used
the S-wave velocity of 3.25 km/s, which is
calculated from the P wave velocity
(5.78 km/s) corresponding to hypocenter depth
(2 - 17 km) and assumed Poisson's ratio (1.78)
for this IBM analysis. And we also assumed
rupture duration and velocity not to exceed the
Global CMT’s half duration (1.3 s) and 90 % of
S-wave velocity, respectively. We considered
grid size should not be shorter than observed
wavelength, 200 Hz S-wave wavelengths (~ 17
m), we defined grid size as 50 m. Relocated
hypocenters distribution and the SMGA spatial
distributions were shown in fig. 4. SMGA
distribution is spatially averaged, final spatial
resolution will be 250 m (5 by 5 grid average).
This grid length corresponds to the wavelength
of 15 Hz S wave variation.
Fig. 3. Hypothesis of the ideal S-wave amplitude variation for our IBM analysis
Seismogram, observed with the other
earthquake, (Obs. EW) and ideal S-wave
amplitude variation (Theo.) are shown as an
example. Maximum amplitude of ideal S-wave
appears at the same time on phase arrival, and
decays by time (e-t/2). On the other hand,
maximum amplitude of Obs. EW appearance
will be delayed with d from phase arrival. d
implies the spatial and temporal extension of
rupture from initial hypocenter. In spite of
without fault plane assumption, we can see a
78
SMGA distribution on and along the aftershock
distribution on a fault plane. In normal view to
fault plane fig. 4c, we can see the SMGA
distribution at (1) northward, (2) southward,
and (3) upper ward of initial rupture’s
hypocenter. And most of the aftershocks are
located at the edge of the southern (2) and
upper (3) SMGA distribution. Upper ward
SMGA (3) spatial extension is different from
two deeper distributions. Upper ward SMGA
(3) seemed not to extend until -1000 m, but (1)
Rupture process of the 2014 orkney earthquake,…
and (2) will reach 1500 m. 1500 m rupture
extension means until the end of the maximum
calculation grid.
Fig. 4. SMGA and aftershock distribution of the 2014 Orkney earthquake
We showed map view (a), view along the
fault plane (b), and view from normal to the
fault plane (c), which was estimated by
aftershock distribution (NNW trending and
west dipping). We masked initial rupture's
extended area as centered filled circle.
Aftershock hypocenters are shown by cross at
the place of relative to the initial rupture's
hypocenter and its size is proportional to its
Richter's scale. SMGA is indicated by grey
scaled circle; when becoming strong, its color
will change toward black.
DISCUSSIONS
We clarified that the 2014 Orkney
earthquake includes the initial- and mainruptures, their origin time difference is 0.3
second, by careful P- and S- phase arrival
picking. Main rupture's relative location
subsequent to initial rupture is 1.0 km distant
from initial one toward the north and slightly
deep. These facts imply quite fast rupture
velocity (>3.0 km/s). Thus, main rupture might
have been dynamically triggered by the initial
rupture's S waves. In order to trigger
dynamically such as in this case, we are
considering that tectonic stress around the
hypocenter should have been high.
From SMGA distribution, upper ward
rupture reached 1.0 km above the initial rupture
hypocenter. Initial rupture's hypocenter depth,
which we determined, is 3.9 km below the sea
level. Thus, this means that rupture extends to
2.9 km below the sea level. On the other hand,
this area mining is reaching 3.6 km below the
surface. Since Orkney town's altitude is 1000 m
to 1500 m, the deepest mining leaf will reach
2.6 - 2.1 km below the sea level. Therefore,
more than 500 m spatial gap exists, mining will
not affect the occurrence of the earthquake, we
considered. Additionally, ordinary mining
releases tectonic stress and makes smaller from
initial condition. High environment stress
condition around the hypocenter implied by high
rupture velocity is inconsistent with this feature.
Comparing with the maximum P wave
amplitudes in vertical component of each
stations for initial- and main ruptures, we could
see the initial rupture's seismic magnitude will
be approximately 1 / 50 times smaller than the
main rupture’s one. Therefore, Richter scale
magnitude of the initial rupture should be
smaller 1.2 (= log10(50/1.5)) than that of the
main rupture. On the other hand, we
determined the Richter's scale for main rupture
of the 2014 Orkney earthquake is M5.6
estimated with the maximum amplitude of
vertical component [10]. Watanabe's scaling
law was developed only for small or micro
seismic events, sometimes its absolute value
may be overestimated. However, their relative
magnitude is correct. Therefore, we considered
that the initial rupture of the 2014 Orkney
earthquake has approximately 4 as local
magnitude scales.
Applying double-difference hypocenter
relocation method, we obtained detailed
79
Okubo Makoto, Artur Cichowicz,…
aftershock distribution with most events located
on a NNW trending and slightly west inclined
plane. If we considered this plane as the fault
plane of the 2014 Orkney earthquake, this
plane is consistent with one of nodal planes that
are reported by Global CMT solution. Upper
part of aftershock distribution is located on a
different nearly horizontal plane. We think
these hypocenters corresponding to blastings
and mine induced earthquakes. It seems that the
vacancy of hypocenter between these
distributions, minings and aftershocks exists.
By this vacancy area existence, tectonic
earthquakes and mining earthquakes seem to be
separated. And no earthquake hypocenters were
determined around the initial rupture area.
Small amplitude SMGA distribution, which
is located off the plane, may be artifacts. These
distributions are quite limited and strength is
not high. Thus, we should mention to the
SMGA distributions (1), (2), and (3), only.
SMGA distributions (1), (2), and (3) are located
on the plane, especially, the location of SMGA
(1) is just corresponding to the main rupture’s
hypocenter. We consider that SMGA
distribution (1), at least one, should have to
exist on the 2014 Orkney earthquake
occurrence. SMGA distributions (2) and (3) are
corresponding to the vacancy of aftershock
distribution, however, some more evidences for
existence of SMGA distributions (2) and (3)
must be investigated in future study.
CONCLUSION
We clarified that the 2014 Orkney
earthquake is multiple earthquake, which
includes the initial- and main-ruptures. Their
origin time difference is only 0.3 second, and
main rupture hypocenter relative location is 1.0
km distant toward the north and slightly deep.
By comparison of the maximum P wave
amplitudes, we concluded that the initial
rupture of the earthquake has approximately
M~4. This earthquake has been followed by
many aftershocks, these distributions show a
fault plane, which is NNW trending and
slightly west dipping. Three strong motion
generating area (SMGA) distributions, which
are obtained by IBM analysis, are located on
the plane. Especially, one of the SMGA (1),
80
which is located northward, is corresponding to
the main rupture's hypocenter. Two remaining
SMGA distribution are corresponding to the
vacancy of aftershock distribution, however,
some more evidences for their existence will
have to be investigated in future study.
Finally, fast rupture velocity of this
earthquake, vacancy of upper area aftershock
distribution, and so on implied that this
earthquake is tectonic earthquake, not a mine
induced earthquake, we considered.
Acknowledgements: This paper was based on
the proceedings of the ASC2016 manuscript.
Travel budget to join VGP2017 was aided by
donation of the Association for the
Development of Earthquake Prediction. We
would like to thank the reviewers who pointed
out some mistakes and polished our paper.
Digital data, which we used in this study, of the
2014 Orkney earthquake is available from the
supplemental link of Moyer et al., (2017) [11].
REFERENCES
1. Global CMT, 2014. Global CMT Catalog,
accessed 31 Jul.
2017.
2. USGS, 2014. Global CMT Catalog,
ttp://earthquake.usgs.gov/data/pde.php,
accessed 31 Jul. 2017.
3. Okubo, M., Cichowicz, A., Birch, D.,
Ogasawara, H., Murakami, O., and
Horiuchi, S., 2016. Rupture Process of the
2014 ML5. 5 Orkney Earthquake, South
Africa. In AGU Fall Meeting Abstracts.
4. Okubo M., and Saiga, A., 2014. Source
dynamics of the Philippine Sea intra-slab
earthquakes - Isochron back projection
analysis for the 2011 eastern Mino
earthquake.
AOGS
2014
Meetings,
Sapporo, Japan 26 July - 1 August 2014,
SE15-D5-AM2-CA-013(SE15-A001).
5. Urabe, T., and Tsukada, S., 1992. WIN-A
workstation program for processing
waveform data from microearthquake
networks Fall MeetingSeismol. Soc. of Jpn.
Tsukuba.
6. Hirata, N., and Matsu’ura, M., 1987.
Maximum-likelihood
estimation
of
Rupture process of the 2014 orkney earthquake,…
hypocenter with origin time eliminated
using nonlinear inversion technique.
Physics of The Earth and Planetary
Interiors, 47, 50-61.
7. Waldhauser, F., and Ellsworth, W. L.,
2000. A double-difference earthquake
location algorithm: Method and application
to the northern Hayward fault, California.
Bulletin of the Seismological Society of
America, 90(6), 1353-1368.
8. Horiuchi, S., Negishi, H., Abe, K.,
Kamimura, A., and Fujinawa, Y., 2005. An
automatic
processing
system
for
broadcasting earthquake alarms. Bulletin of
the Seismological Society of America,
95(2), 708-718.
9. Pulido, N., Aoi, S., and Fujiwara, H., 2008.
Rupture process of the 2007 Notohanto
earthquake by using an isochrones backprojection method and K-NET/KiK-net
data. Earth, planets and space, 60(10),
1035-1040.
10. Watanabe, H., 1971. Determination of
earthquake magnitude at regional distance
in and near Japan. Zisin 2, 24, 189-200.
11. Moyer, P. A., Boettcher, M. S., Ellsworth,
W. L., Ogasawara, H., Cichowicz, A.,
Birch, D., and van Aswegen, G., 2017. Call
for Models-A Test Case for the Source
Inversion Validation: The 2014 ML 5.5
Orkney, South Africa, Earthquake.
Seismological Research Letters, 88(5),
1333-1338.
12. Ogasawara, H., Katsura, T., Hofmann, G.,
Yabe, Y., Nakatani, M., and Naoi, M.,
2014. In-situ monitoring of rock mass
response to mining in South African gold
mines using the Ishii strainmeters. In
Proceedings of the sixth South African rock
engineering symposium (pp. 21-34).
13. Wessel, P., and Smith, W. H., 1991. Free
software helps map and display data. Eos,
Transactions American Geophysical Union,
72(41), 441-446.
81