Báo cáo khoa học: "QARLA:A Framework for the Evaluation of Text Summarization Systems" pdf
Bạn đang xem bản rút gọn của tài liệu. Xem và tải ngay bản đầy đủ của tài liệu tại đây (679.09 KB, 10 trang )
Proceedings of the 43rd Annual Meeting of the ACL, pages 280–289,
Ann Arbor, June 2005.
c
2005 Association for Computational Linguistics
QARLA:A Framework for the Evaluation of Text Summarization Systems
Enrique Amig
´
o, Julio Gonzalo, Anselmo Pe
˜
nas, Felisa Verdejo
Departamento de Lenguajes y Sistemas Inform
´
aticos
Universidad Nacional de Educaci
´
on a Distancia
c/Juan del Rosal, 16 - 28040 Madrid - Spain
{enrique,julio,anselmo,felisa}@lsi.uned.es
Abstract
This paper presents a probabilistic
framework, QARLA, for the evaluation
of text summarisation systems. The in-
put of the framework is a set of man-
ual (reference) summaries, a set of base-
line (automatic) summaries and a set of
similarity metrics between summaries.
It provides i) a measure to evaluate the
quality of any set of similarity metrics,
ii) a measure to evaluate the quality of
a summary using an optimal set of simi-
larity metrics, and iii) a measure to eval-
uate whether the set of baseline sum-
maries is reliable or may produce biased
results.
Compared to previous approaches, our
framework is able to combine different
metrics and evaluate the quality of a set
of metrics without any a-priori weight-
ing of their relative importance. We pro-
vide quantitative evidence about the ef-
fectiveness of the approach to improve
the automatic evaluation of text sum-
marisation systems by combining sev-
eral similarity metrics.
1 Introduction
The quality of an automatic summary can be es-
tablished mainly with two approaches:
Human assessments: The output of a number of
summarisation systems is compared by hu-
man judges, using some set of evaluation
guidelines.
Proximity to a gold standard: The best auto-
matic summary is the one that is closest to
some reference summary made by humans.
Using human assessments has some clear ad-
vantages: the results of the evaluation are inter-
pretable, and we can trace what a system is do-
ing well, and what is doing poorly. But it also
has a couple of serious drawbacks: i) different hu-
man assessors reach different conclusions, and ii)
the outcome of a comparative evaluation exercise
is not directly reusable for new techniques, i.e., a
summarisation strategy developed after the com-
parative exercise cannot be evaluated without ad-
ditional human assessments made from scratch.
Proximity to a gold standard, on the other hand,
is a criterion that can be automated (see Section 6),
with the advantages of i) being objective, and ii)
once gold standard summaries are built for a com-
parative evaluation of systems, the resulting test-
bed can iteratively be used to refine text summari-
sation techniques and re-evaluate them automati-
cally.
This second approach, however, requires solv-
ing a number of non-trivial issues. For instance,
(i) How can we know whether an evaluation met-
ric is good enough for automatic evaluation?, (ii)
different users produce different summaries, all of
them equally good as gold standards, (iii) if we
have several metrics which test different features
of a summary, how can we combine them into an
optimal test?, (iv) how do we know if our test bed
280
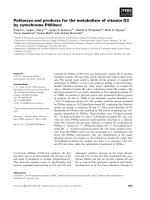
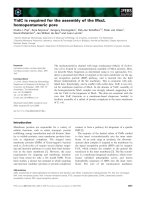
Figure 1: Illustration of some of the restrictions on Q, K
is reliable, or the evaluation outcome may change
by adding, for instance, additional gold standards?
In this paper, we introduce a probabilistic
framework, QARLA, that addresses such issues.
Given a set of manual summaries and another set
of baseline summaries per task, together with a set
of similarity metrics, QARLA provides quantita-
tive measures to (i) select and combine the best
(independent) metrics (KING measure), (ii) apply
the best set of metrics to evaluate automatic sum-
maries (QUEEN measure), and (iii) test whether
evaluating with that test-bed is reliable (JACK
measure).
2 Formal constraints on any evaluation
framework based on similarity metrics
We are looking for a framework to evaluate au-
tomatic summarisation systems objectively using
similarity metrics to compare summaries. The in-
put of the framework is:
• A summarisation task (e.g. topic oriented, in-
formative multi-document summarisation on
a given domain/corpus).
• A set T of test cases (e.g. topic/document set
pairs for the example above)
• A set of summaries M produced by humans
(models), and a set of automatic summaries
A (peers), for every test case.
• A set X of similarity metrics to compare
summaries.
An evaluation framework should include, at
least:
• A measure Q
M,X
(a) ∈ [0, 1] that estimates
the quality of an automatic summary a, us-
ing the similarity metrics in X to compare
the summary with the models in M . With
Q, we can compare the quality of automatic
summaries.
• A measure K
M,A
(X) ∈ [0, 1] that estimates
the suitability of a set of similarity metrics X
for our evaluation purposes. With K, we can
choose the best similarity metrics.
Our main assumption is that all manual sum-
maries are equally optimal and, while they are
likely to be different, the best similarity metric is
the one that identifies and uses the features that are
common to all manual summaries, grouping and
separating them from the automatic summaries.
With these assumption in mind, it is useful to
think of some formal restrictions that any evalua-
tion framework Q, K must hold. We will consider
the following ones (see illustrations in Figure 1):
(1) Given two automatic summaries a, a
and a
similarity measure x, if a is more distant to all
manual summaries than a
, then a cannot be better
281
than a
. Formally: ∀m ∈ M.x(a, m) < x(a
, m) →
Q
M,x
(a) ≤ Q
M,x
(a
)
(2) A similarity metric x is better when it is able
to group manual summaries more closely, while
keeping them more distant from automatic sum-
maries: (∀m, m
∈ M.x(m, m
) > x
(m, m
) ∧ ∀m ∈
M, a ∈ Ax(a, m) < x
(a, m)) → K
M,A
(x) > K
M,A
(x
)
(3) If x is a perfect similarity metric, the quality of
a manual summary cannot be zero: K
M,A
(x) = 1 →
∀m ∈ M.Q
M,x
(m) > 0
(4) The quality of a similarity metric or a summary
should not be dependent on scale issues. In gen-
eral, if x
= f(x) with f being a growing mono-
tonic function, then K
M,A
(x) = K
M,A
(x
) and
Q
M,x
(a) = Q
M,x
(a) .
(5) The quality of a similarity metric should
not be sensitive to repeated elements in A, i.e.
K
M,A∪{a}
(x) = K
M,A∪{a,a}
(x).
(6) A random metric x should have K
M,A
(x) = 0.
(7) A non-informative (constant) metric x should
have K
M,A
(x) = 0.
3 QARLA evaluation framework
3.1 QUEEN: Estimation of the quality of an
automatic summary
We are now looking for a function Q
M,x
(a) that
estimates the quality of an automatic summary a ∈
A, given a set of models M and a similarity metric
x.
An obvious first attempt would be to compute
the average similarity of a to all model summaries
in M in a test sample. But such a measure depends
on scale properties: metrics producing larger sim-
ilarity values will produce larger Q values; and,
depending on the scale properties of x, this cannot
be solved just by scaling the final Q value.
A probabilistic measure that solves this problem
and satisfies all the stated formal constraints is:
QUEEN
x,M
(a) ≡ P (x(a, m) ≥ x(m
, m
))
which defines the quality of an automatic sum-
mary a as the probability over triples of manual
summaries m, m
, m
that a is closer to a model
than the other two models to each other. This mea-
sure draws from the way in which some formal re-
strictions on Q are stated (by comparing similarity
values), and is inspired in the QARLA criterion
introduced in (Amigo et al., 2004).
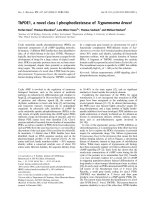
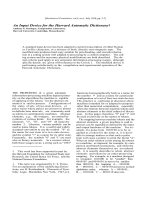
Figure 2: Summaries quality in a similarity metric
space
Figure 2 illustrates some of the features of the
QUEEN estimation:
• Peers which are very far from the set of
models all receive QUEEN = 0. In other
words, QUEEN does not distinguish between
very poor automatic summarisation strate-
gies. While this feature reduces granularity
of the ranking produced by QUEEN, we find
it desirable, because in such situations, the
values returned by a similarity measure are
probably meaningless.
• The value of QUEEN is maximised for the
peers that “merge” with the models. For
QUEEN values between 0.5 and 1, peers are
effectively merged with the models.
• An ideal metric (that puts all models to-
gether) would give QUEEN(m) = 1 for all
models, and QUEEN(a) = 0 for all peers
that are not put together with the models.
This is a reasonable boundary condition say-
ing that, if we can distinguish between mod-
els and peers perfectly, then all peers are
poor emulations of human summarising be-
haviour.
3.2 Generalisation of QUEEN to metric sets
It is desirable, however, to have the possibility of
evaluating summaries with respect to several met-
rics together. Let us imagine, for instance, that
the best metric turns out to be a ROUGE (Lin and
Hovy, 2003a) variant that only considers unigrams
to compute similarity. Now consider a summary
282
which has almost the same vocabulary as a hu-
man summary, but with a random scrambling of
the words which makes it unreadable. Even if the
unigram measure is the best hint of similarity to
human performance, in this case it would produce
a high similarity value, while any measure based
on 2-grams, 3-grams or on any simple syntactic
property would detect that the summary is useless.
The issue is, therefore, how to find informative
metrics, and then how to combine them into an op-
timal single quality estimation for automatic sum-
maries. The most immediate way of combining
metrics is via some weighted linear combination.
But our example suggests that this is not the op-
timal way: the unigram measure would take the
higher weight, and therefore it would assign a fair
amount of credit to a summary that can be strongly
rejected with other criteria.
Alternatively, we can assume that a summary is
better if it is closer to the model summaries ac-
cording to all metrics. We can formalise this idea
by introducing a universal quantifier on the vari-
able x in the QUEEN formula. In other words,
QUEEN
X,M
(a) can be defined as the probability,
measured over M × M × M, that for every metric
in X the automatic summary a is closer to a model
than two models to each other.
QUEEN
X,M
(a) ≡ P (∀x ∈ X.x(a, m) ≥ x(m
, m
))
We can think of the generalised QUEEN mea-
sure as a way of using a set of tests (every simi-
larity metric in X) to falsify the hypothesis that a
given summary a is a model. If, for every compar-
ison of similarities between a, m, m
, m
, there is
at least one test that a does not pass, then a is re-
jected as a model.
This generalised measure is not affected by the
scale properties of every individual metric, i.e. it
does not require metric normalisation and it is not
affected by metric weighting. In addition, it still
satisfies the properties enumerated for its single-
metric counterpart.
Of course, the quality ranking provided by
QUEEN is meaningless if the similarity metric x
does not capture the essential features of the mod-
els. Therefore, we need to estimate the quality of
similarity metrics in order to use QUEEN effec-
tively.
3.3 KING: estimation of the quality of a
similarity metric
Now we need a measure K
M,A
(x) that estimates
the quality of a similarity metric x to evaluate
automatic summaries (peers) by comparison to
human-produced models.
In order to build a suitable K estimation, we
will again start from the hypothesis that the best
metric is the one that best characterises human
summaries as opposed to automatic summaries.
Such a metric should identify human summaries
as closer to each other, and more distant to peers
(second constraint in Section 2). By analogy with
QUEEN, we can try (for a single metric):
K
M,A
(x) ≡ P (x(a, m) < x(m
, m
)) =
1 −
(QUEEN
x,M
(a))
which is the probability that two models are
closer to each other than a third model to a peer,
and has smaller values when the average QUEEN
value of peers decreases. The generalisation of K
to metric sets would be simply:
K
M,A
(X) ≡ 1 − (QUEEN
X,M
(a)))
This measure, however, does not satisfy formal
conditions 3 and 5. Condition 3 is violated be-
cause, given a limited set of models, the K mea-
sure grows with a large number of metrics in X,
eventually reaching K = 1 (perfect metric set).
But in this situation, QUEEN(m) becomes 0 for
all models, because there will always exist a met-
ric that breaks the universal quantifier condition
over x.
We have to look, then, for an alternative for-
mulation for K. The best K should minimise
QUEEN(a), but having the quality of the models
as a reference. A direct formulation can be:
K
M,A
(X) = P (QUEEN(m) > QUEEN(a))
According to this formula, the quality of a met-
ric set X is the probability that the quality of a
283
model is higher than the quality of a peer ac-
cording to this metric set. This formula satisfies
all formal conditions except 5 (K
M,A∪{a}
(x) =
K
M,A∪{a,a}
(x)), because it is sensitive to repeated
peers. If we add a large set of identical (or very
similar peers), K will be biased towards this set.
We can define a suitable K that satisfies condi-
tion 5 if we apply a universal quantifier on a. This
is what we call the KING measure:
KING
M,A
(X) ≡
P (∀a ∈ A.QUEEN
M,X
(m) > QUEEN
M,X
(a))
KING is the probability that a model is better
than any peer in a test sample. In terms of a qual-
ity ranking, it is the probability that a model gets a
better ranking than all peers in a test sample. Note
that KING satisfies all restrictions because it uses
QUEEN as a quality estimation for summaries; if
QUEEN is substituted for a different quality mea-
sure, some of the properties might not hold any
longer.
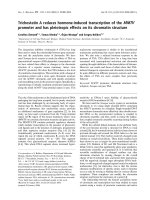
Figure 3: Metrics quality representation
Figure 3 illustrates the behaviour of the KING
measure in boundary conditions. The left-
most figure represents a similarity metric which
mixes models and peers randomly. Therefore,
P (QUEEN(m) > QUEEN(a)) ≈ 0.5. As there
are seven automatic summaries, KING = P (∀a ∈
A, QUEEN(m) > QUEEN(a)) ≈ 0.5
7
≈ 0
The rightmost figure represents a metric which
is able to group models and separate them from
peers. In this case, QUEEN(a) = 0 for all peers,
and then KING(x) = 1.
3.4 JACK:Reliability of the peers set
Once we detect a difference in quality between
two summarisation systems, the question is now
whether this result is reliable. Would we get the
same results using a different test set (different ex-
amples, different human summarisers (models) or
different baseline systems)?
The first step is obviously to apply statistical
significance tests to the results. But even if they
give a positive result, it might be insufficient. The
problem is that the estimation of the probabilities
in KING, QUEEN assumes that the sample sets
M, A are not biased. If M, A are biased, the re-
sults can be statistically significant and yet un-
reliable. The set of examples and the behaviour
of human summarisers (models) should be some-
how controlled either for homogeneity (if the in-
tended profile of examples and/or users is narrow)
or representativity (if it is wide). But how to know
whether the set of automatic summaries is repre-
sentative and therefore is not penalising certain au-
tomatic summarisation strategies?
Our goal is, therefore, to have some estimation
JACK(X, M, A) of the reliability of the test set to
compute reliable QUEEN, KING measures. We
can think of three reasonable criteria for this es-
timation:
1. All other things being equal, if the elements
of A are more heterogeneous, we are enhanc-
ing the representativeness of A (we have a
more diverse set of (independent) automatic
summarization strategies represented), and
therefore the reliability of the results should
be higher. Reversely, if all automatic sum-
marisers employ similar strategies, we may
end up with a biased set of peers.
2. All other things being equal, if the elements
of A are closer to the model summaries in M,
the reliability of the results should be higher.
3. Adding items to A should not reduce its reli-
ability.
A possible formulation for JACK which satis-
fies that criteria is:
JACK(X, M , A) ≡ P (∃a, a
∈ A.QUEEN(a) >
0 ∧ QUEEN(a
) > 0 ∧ ∀x ∈ X.x(a, a
) ≤ x(a, m))
i.e. the probability over all model summaries m
of finding a couple of automatic summaries a, a
284
which are closer to each other than to m according
to all metrics.
This measure satisfies all three constraints: it
can be enlarged by increasing the similarity of the
peers to the models (the x(m, a) factor in the in-
equality) or decreasing the similarity between au-
tomatic summaries (the x(a, a
) factor in the in-
equality). Finally, adding elements to A can only
increase the chances of finding a pair of automatic
summaries satisfying the condition in JACK.
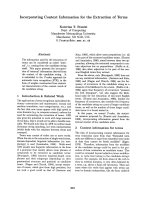
Figure 4: JACK values
Figure 4 illustrates how JACK works: in the
leftmost part of the figure, peers are grouped to-
gether and far from the models, giving a low JACK
value. In the rightmost part of the figure, peers are
distributed around the set of models, closely sur-
rounding them, receiving a high JACK value.
4 A Case of Study
In order to test the behaviour of our evaluation
framework, we have applied it to the ISCORPUS
described in (Amigo et al., 2004). The ISCOR-
PUS was built to study an Information Synthesis
task, where a (large) set of relevant documents has
to be studied to give a brief, well-organised answer
to a complex need for information. This corpus
comprises:
• Eight topics extracted from the CLEF Span-
ish Information Retrieval test set, slightly re-
worded to move from a document retrieval
task (find documents about hunger strikes
in ) into an Information Synthesis task
(make a report about major causes of hunger
strikes in ).
• One hundred relevant documents per topic
taken from the CLEF EFE 1994 Spanish
newswire collection.
• M: Manual extractive summaries for every
topic made by 9 different users, with a 50-
sentence upper limit (half the number of rel-
evant documents).
• A: 30 automatic reports for every topic made
with baseline strategies. The 10 reports with
highest sentence overlap with the manual
summaries were selected as a way to increase
the quality of the baseline set.
We have considered the following similarity
metrics:
ROUGESim: ROUGE is a standard measure
to evaluate summarisation systems based on
n-gram recall. We have used ROUGE-1
(only unigrams with lemmatization and stop
word removal), which gives good results with
standard summaries (Lin and Hovy, 2003a).
ROUGE can be turned into a similarity met-
ric ROUGESim simply by considering only
one model when computing its value.
SentencePrecision: Given a reference and a con-
trastive summary, the number of fragments of
the contrastive summary which are also in the
reference summary, in relation to the size of
the reference summary.
SentenceRecall: Given a reference and a con-
trastive summary, the number of fragments of
the reference summary which are also in the
contrastive summary, in relation to the size of
the contrastive summary.
DocSim: The number of documents used to select
fragments in both summaries, in relation to
the size of the contrastive summary.
VectModelSim: Derived from the Euclidean dis-
tance between vectors of relative word fre-
quencies representing both summaries.
NICOS (key concept overlap): Same as Vect-
ModelSim, but using key-concepts (manually
identified by the human summarisers after
producing the summary) instead of all non-
empty words.
285
TruncatedVectModel
n
: Same as VectModelSim,
but using only the n more frequent terms
in the reference summary. We have used
10 variants of this measure with n =
1, 8, 64, 512.
4.1 Quality of Similarity Metric Sets
Figure 5 shows the quality (KING values averaged
over the eight ISCORPUS topics) of every individ-
ual metric. The rightmost part of the figure also
shows the quality of two metric sets:
• The first one ({ROUGESim, VectModelSim,
TruncVectModel.1}) is the metric set that
maximises KING, using only similarity met-
rics that do not require manual annotation
(i.e. excluding NICOS) or can only be ap-
plied to extractive summaries (i.e. DocSim,
SentenceRecall and SentencePrecision).
• The second one ({ TruncVectModel.1, ROU-
GESim, DocSim, VectModelSim }) is the best
combination considering all metrics.
The best result of individual metrics is obtained
by ROUGESim (0.39). All other individual met-
rics give scores below 0.31. Both metric sets, on
the other, are better than ROUGESim alone, con-
firming that metric combination is feasible to im-
prove system evaluation. The quality of the best
metric set (0.47) is 21% better than ROUGESim.
4.2 Reliability of the test set
The 30 automatic summaries (baselines) per topic
were built with four different classes of strategies:
i) picking up the first sentence from assorted sub-
sets of documents, ii) picking up first and second
sentences from assorted documents, iii) picking
up first, second or third sentences from assorted
documents, and iv) picking up whole documents
with different algorithms to determine which are
the most representative documents.
Figure 6 shows the reliability (JACK) of every
subset, and the reliability of the whole set of au-
tomatic summaries, computed with the best met-
ric set. Note that the individual subsets are all
below 0.2, while the reliability of the full set of
peers goes up to 0.57. That means that the con-
dition in JACK is satisfied for more than half of
the models. This value would probably be higher
if state-of-the-art summarisation techniques were
represented in the set of peers.
5 Testing the predictive power of the
framework
The QARLA probabilistic framework is designed
to evaluate automatic summarisation systems and,
at the same time, similarity metrics conceived as
well to evaluate summarisation systems. There-
fore, testing the validity of the QARLA proposal
implies some kind of meta-meta-evaluation, some-
thing which seems difficult to design or even to
define.
It is relatively simple, however, to perform some
simple cross-checkings on the ISCORPUS data to
verify that the qualitative information described
above is reasonable. This is the test we have im-
plemented:
If we remove a model m from M, and pretend it
is the output of an automatic summariser, we can
evaluate the peers set A and the new peer m using
M
= M\{m} as the new model set. If the evalu-
ation metric is good, the quality of the new peer m
should be superior to all other peers in A. What we
have to check, then, is whether the average quality
of a human summariser on all test cases (8 topics
in ISCORPUS) is superior to the average quality
of any automatic summariser. We have 9 human
subjects in the ISCORPUS test bed; therefore, we
can repeat this test nine times.
With this criterion, we can compare our quality
measure Q with state-of-the-art evaluation mea-
sures such as ROUGE variants. Table 1 shows
the results of applying this test on ROUGE-
1, ROUGE-2, ROUGE-3, ROUGE-4 (as state-
of-the-art references) and QUEEN(ROUGESim),
QUEEN(Best Metric Combination) as representa-
tives of the QARLA framework. Even if the test is
very limited by the number of topics, it confirms
the potential of the framework, with the highest
KING metric combination doubling the perfor-
mance of the best ROUGE measure (6/9 versus 3/9
correct detections).
286
Figure 5: Quality of similarity metrics
Figure 6: Reliability of ISCORPUS peer sets
Evaluation criterion human summarisers ranked first
ROUGE-1 3/9
ROUGE-2 2/9
ROUGE-3 1/9
ROUGE-4 1/9
QUEEN(ROUGESim) 4/9
QUEEN(Best Metric Combination) 6/9
Table 1: Results of the test of identifying the manual summariser
287
6 Related work and discussion
6.1 Application of similarity metrics to
evaluate summaries
Both in Text Summarisation and Machine Trans-
lation, the automatic evaluation of systems con-
sists of computing some similarity metric between
the system output and a human model summary.
Systems are then ranked in order of decreasing
similarity to the gold standard. When there are
more than one reference items, similarity is calcu-
lated over a pseudo-summary extracted from every
model. BLEU (Papineni et al., 2001) and ROUGE
(Lin and Hovy, 2003a) are the standard similar-
ity metrics used in Machine Translation and Text
Summarisation. Generating a pseudo-summary
from every model, the results of a evaluation met-
ric might depend on the scale properties of the
metric regarding different models; our QUEEN
measure, however, does not depend on scales.
Another problem of the direct application of a
single evaluation metric to rank systems is how to
combine different metrics. The only way to do
this is by designing an algebraic combination of
the individual metrics into a new combined met-
ric, i.e. by deciding the weight of each individual
metric beforehand. In our framework, however, it
is not necessary to prescribe how similarity met-
rics should be combined, not even to know which
ones are individually better indicators.
6.2 Meta-evaluation of similarity metrics
The question of how to know which similar-
ity metric is best to evaluate automatic sum-
maries/translations has been addressed by
• comparing the quality of automatic items
with the quality of manual references (Culy
and Riehemann, 2003; Lin and Hovy,
2003b). If the metric does not identify that
the manual references are better, then it is not
good enough for evaluation purposes.
• measuring the correlation between the values
given by different metrics (Coughlin, 2003).
• measuring the correlation between the rank-
ings generated by each metric and rank-
ings generated by human assessors. (Joseph
P. Turian and Melamed, 2003; Lin and Hovy,
2003a).
The methodology which is closest to our frame-
work is ORANGE (Lin, 2004), which evaluates a
similarity metric using the average ranks obtained
by reference items within a baseline set. As in
our framework, ORANGE performs an automatic
meta-evaluation, there is no need for human as-
sessments, and it does not depend on the scale
properties of the metric being evaluated (because
changes of scale preserve rankings). The OR-
ANGE approach is, indeed, closely related to the
original QARLA measure introduced in (Amigo et
al., 2004).
Our KING, QUEEN, JACK framework, how-
ever, has a number of advantages over ORANGE:
• It is able to combine different metrics, and
evaluate the quality of metric sets, without
any a-priori weighting of their relative impor-
tance.
• It is not sensitive to repeated (or very similar)
baseline elements.
• It provides a mechanism, JACK, to check
whether a set X, M, A of metrics, manual
and baseline items is reliable enough to pro-
duce a stable evaluation of automatic sum-
marisation systems.
Probably the most significant improvement over
ORANGE is the ability of KING, QUEEN, JACK
to combine automatically the information of dif-
ferent metrics. We believe that a comprehensive
automatic evaluation of a summary must neces-
sarily capture different aspects of the problem with
different metrics, and that the results of every indi-
vidual metric should not be combined in any pre-
scribed algebraic way (such as a linear weighted
combination). Our framework satisfies this con-
dition. An advantage of ORAN GE, however, is
that it does not require a large number of gold stan-
dards to reach stability, as in the case of QARLA.
Finally, it is interesting to compare the rankings
produced by QARLA with the output of human
assessments, even if the philosophy of QARLA
is not considering human assessments as the gold
standard for evaluation. Our initial tests on DUC
288
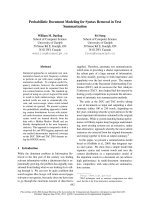
Figure 7: KING vs Pearson correlation with manual rankings in DUC for 1024 metrics combinations
test beds are very promising, reaching Pearson
correlations of 0.9 and 0.95 between human as-
sessments and QUEEN values for DUC 2004 tasks
2 and 5 (Over and Yen, 2004), using metric sets
with highest KING values. The figure 7 shows
how Pearson correlation grows up with higher
KING values for 1024 metric combinations.
Acknowledgments
We are indebted to Ed Hovy, Donna Harman, Paul
Over, Hoa Dang and Chin-Yew Lin for their in-
spiring and generous feedback at different stages
in the development of QARLA. We are also in-
debted to NIST for hosting Enrique Amig
´
o as a
visitor and for providing the DUC test beds. This
work has been partially supported by the Spanish
government, project R2D2 (TIC-2003-7180).
References
E. Amigo, V. Peinado, J. Gonzalo, A. Pe
˜
nas, and
F. Verdejo. 2004. An empirical study of informa-
tion synthesis task. In Proceedings of the 42th An-
nual Meeting of the Association for Computational
Linguistics (ACL), Barcelona, July.
Deborah Coughlin. 2003. Correlating Automated and
Human Assessments of Machine Translation Qual-
ity. In In Proceedings of MT Summit IX, New Or-
leans,LA.
Christopher Culy and Susanne Riehemann. 2003. The
Limits of N-Gram Translation Evaluation Metrics.
In Proceedings of MT Summit IX, New Orleans,LA.
Luke Shen Joseph P. Turian and I. Dan Melamed.
2003. Evaluation of Machine Translation and its
Evaluation. In In Proceedings of MT Summit IX,
New Orleans,LA.
C. Lin and E. H. Hovy. 2003a. Automatic Evaluation
of Summaries Using N-gram Co-ocurrence Statis-
tics. In Proceeding of 2003 Language Technology
Conference (HLT-NAACL 2003).
Chin-Yew Lin and Eduard Hovy. 2003b. The Poten-
tial and Limitations of Automatic Sentence Extrac-
tion for Summarization. In Dragomir Radev and Si-
mone Teufel, editors, HLT-NAACL 2003 Workshop:
Text Summarization (DUC03), Edmonton, Alberta,
Canada, May 31 - June 1. Association for Computa-
tional Linguistics.
C. Lin. 2004. Orange: a Method for Evaluating Au-
tomatic Metrics for Machine Translation. In Pro-
ceedings of the 36th Annual Conference on Compu-
tational Linguisticsion for Computational Linguis-
tics (Coling’04), Geneva, August.
P. Over and J. Yen. 2004. An introduction to duc 2004
intrinsic evaluation of generic new text summariza-
tion systems. In Proceedings of DUC 2004 Docu-
ment Understanding Workshop, Boston.
K. Papineni, S. Roukos, T. Ward, and W. Zhu. 2001.
Bleu: a method for automatic evaluation of machine
translation. In Proceedings of the 40th Annual Meet-
ing of the Association for Computational Linguistics
(ACL), pages 311–318, Philadelphia, jul.
289