Báo cáo khoa học: "Using Emoticons to reduce Dependency in Machine Learning Techniques for Sentiment Classification" pot
Bạn đang xem bản rút gọn của tài liệu. Xem và tải ngay bản đầy đủ của tài liệu tại đây (121.12 KB, 6 trang )
Proceedings of the ACL Student Research Workshop, pages 43–48,
Ann Arbor, Michigan, June 2005.
c
2005 Association for Computational Linguistics
Using Emoticons to reduce Dependency in
Machine Learning Techniques for Sentiment Classification
Jonathon Read
Department of Informatics
University of Sussex
United Kingdom
Abstract
Sentiment Classification seeks to identify
a piece of text according to its author’s
general feeling toward their subject, be it
positive or negative. Traditional machine
learning techniques have been applied to
this problem with reasonable success, but
they have been shown to work well only
when there is a good match between the
training and test data with respect to topic.
This paper demonstrates that match with
respect to domain and time is also impor-
tant, and presentspreliminary experiments
with training data labeled with emoticons,
which has the potential of being indepen-
dent of domain, topic and time.
1 Introduction
Recent years have seen an increasing amount of re-
search effort expended in the area of understanding
sentiment in textual resources. A sub-topic of this
research is that of Sentiment Classification. That
is, given a problem text, can computational meth-
ods determine if the text is generally positive or gen-
erally negative? Several diverse applications exist
for this potential technology, ranging from the auto-
matic filtering of abusive messages (Spertus, 1997)
to an in-depth analysis of market trends and con-
sumer opinions (Dave et al., 2003). This is a com-
plex and challenging task for a computer to achieve
— consider the difficulties involved in instructing a
computer to recognise sarcasm, for example.
Previous work has shown that traditional text clas-
sification approaches can be quite effective when
applied to the sentiment analysis problem. Models
such as Na
¨
ıve Bayes (NB), Maximum Entropy (ME)
and Support Vector Machines (SVM) can determine
the sentiment of texts. Pang et al. (2002) used a bag-
of-features framework (based on unigrams and bi-
grams) to train these models from a corpus of movie
reviews labelled as positive or negative. The best ac-
curacy achieved was 82.9%, using an SVM trained
on unigram features. A later study (Pang and Lee,
2004) found that performance increased to 87.2%
when considering only those portions of the text
deemed to be subjective.
However, Engstr
¨
om (2004) showed that the bag-
of-features approach is topic-dependent. A clas-
sifier trained on movie reviews is unlikely to per-
form as well on (for example) reviews of automo-
biles. Turney (2002) noted that the unigram unpre-
dictable might have a positive sentiment in a movie
review (e.g. unpredictable plot), but could be neg-
ative in the review of an automobile (e.g. unpre-
dictable steering). In this paper, we demonstrate
how the models are also domain-dependent — how
a classifier trained on product reviews is not effective
when evaluating the sentiment of newswire articles,
for example. Furthermore, we show how the models
are temporally-dependent — how classifiers are bi-
ased by the trends of sentiment apparent during the
time-period represented by the training data.
We propose a novel source of training data based
on the language used in conjunction with emoticons
in Usenet newsgroups. Training a classifier using
this data provides a breadth of features that, while it
43
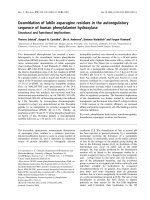
Testing
FIN M&A MIX
Training
NB FIN 80.3 75.5 74.0
M&A 77.5 75.3 75.8
MIX 70.7 62.9 84.6
SVM FIN 78.8 72.7 68.9
M&A 74.5 75.5 75.5
MIX 72.0 68.9 81.1
Figure 1: Topic dependency in sentiment classification. Ac-
curacies, in percent. Best performance on a test set for each
model is highlighted in bold.
does not perform to the state-of-the-art, could func-
tion independent of domain, topic and time.
2 Dependencies in Sentiment Classification
2.1 Experimental Setup
In this section, we describe experiments we have
carried out to determine the influence of domain,
topic and time on machine learning based sentiment
classification. The experiments use our own imple-
mentation of a Na
¨
ıve Bayes classifier and Joachim’s
(1999) SV M
light
implementation of a Support Vec-
tor Machine classifier. The models were trained us-
ing unigram features, accounting for the presence
of feature types in a document, rather than the fre-
quency, as Pang et al. (2002) found that this is the
most effective strategy for sentiment classification.
When training and testing on the same set, the
mean accuracy is determined using three-fold cross-
validation. In each case, we use a paired-sample
t-test over the set of test documents to determine
whether the results produced by one classifier are
statistically significantly better than those from an-
other, at a confidence interval of at least 95%.
2.2 Topic Dependency
Engstr
¨
om (2004) demonstrated how machine-
learning techniques for sentiment classification can
be topic dependent. However, that study focused
on a three-way classification (positive, negative and
neutral). In this paper, for uniformity across differ-
ent data sets, we focus on only positive and negative
sentiment. This experiment also provides an oppor-
tunity to evaluate the Na
¨
ıve Bayes classifier as the
previous work used SVMs.
We use subsets of a Newswire dataset (kindly pro-
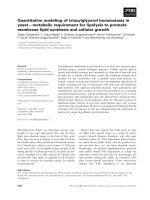
Testing
Newswire Polarity 1.0
Training
NB Newswire 78.2 57.6
Polarity 1.0 53.2 78.9
SVM Newswire 78.2 63.2
Polarity 1.0 63.6 81.5
Figure 2: Domain dependency in sentiment classification.
Accuracies, in percent. Best performance on a test set for each
model is highlighted in bold.
vided by Roy Lipski of Infonic Ltd.) that relate to
the topics of Finance (FIN), Mergers and Aquisi-
tions (M&A) and a mixture of both topics (MIX).
Each subset contains further subsets of articles of
positive and negative sentiment (selected by inde-
pendent trained annotators), each containing 100
stories. We trained a model on a dataset relating to
one topic and tested that model using the other top-
ics. Figure 1 shows the results of this experiment.
The tendency seems to be that performance in a
given topic is best if the training data is from the
same topic. For example, the Finance-trained SVM
classifier achieved an accuracy of 78.8% against ar-
ticles from Finance, but only 72.7% when predicting
the sentiment of articles from M&A. However, sta-
tistical testing showed that the results are not signifi-
cantly different when training on one topic and test-
ing on another. It is interesting to note, though, that
providing a dataset of mixed topics (the sub-corpus
MIX) does not necessarily reduce topic dependency.
Indeed, the performance of the classifiers suffers a
great deal when training on mixed data (confidence
interval 95%).
2.3 Domain Dependency
We conducted an experiment to compare the ac-
curacy when training a classifier on one domain
(newswire articles or movie reviews from the Polar-
ity 1.0 dataset used by Pang et al. (2002)) and testing
on the other domain. In Figure 2, we see a clear in-
dication that models trained on one domain do not
perform as well on another domain. All differences
are significant at a confidence interval of 99.9%.
2.4 Temporal Dependency
To investigate the effect of time on sentiment clas-
sification, we constructed a new set of movie re-
44
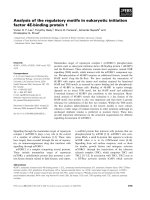
Testing
Polarity 1.0 Polarity 2004
Training
NB Polarity 1.0 78.9 71.8
Polarity 2004 63.2 76.5
SVM Polarity 1.0 81.5 77.5
Polarity 2004 76.5 80.8
Figure 3: Temporal dependency in sentiment classification.
Accuracies, in percent. Best performance on a test set for each
model is highlighted in bold.
views, following the same approach used by Pang
et al. (2002) when they created the Polarity 1.0
dataset. The data source was the Internet Movie Re-
view Database archive
1
of movie reviews. The re-
views were categorised as positive or negative using
automatically extracted ratings. A review was ig-
nored if it was not written in 2003 or 2004 (ensuring
that the review was written after any in the Polar-
ity 1.0 dataset). This procedure yielded a corpus of
716 negative and 2,669 positive reviews. To create
the Polarity 2004
2
dataset we randomly selected 700
negative reviews and 700 positive reviews, matching
the size and distribution of the Polarity 1.0 dataset.
The next experiment evaluated the performance
of the models first against movie reviews from the
same time-period as the training set and then against
reviews from the other time-period. Figure 3 shows
the resulting accuracies.
These results show that while the models perform
well on reviews from the same time-period as the
training set, they are not so effective on reviews from
other time-periods (confidence interval 95%). It is
also apparent that the Polarity 2004 dataset performs
worse than the Polarity 1.0 dataset (confidence inter-
val 99.9%). A possible reason for this is that Polarity
2004 data is from a much smaller time-period than
that represented by Polarity 1.0.
3 Sentiment Classification using
Emoticons
One way of overcoming the domain, topic and time
problems we have demonstrated above would be to
find a source of much larger and diverse amounts
of general text, annotated for sentiment. Users of
1
/>2
The new datasets described in this paper are available at
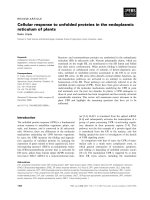
/>Glyph Meaning Frequency
:-) smile 3.8739
;-) wink 2.4350
:-( frown 0.4961
:-D wide grin 0.1838
:-P tongue sticking out 0.1357
:-O surprise 0.0171
:-| disappointed 0.0146
:’( crying 0.0093
:-S confused 0.0075
:-@ angry 0.0038
:-$ embarrassed 0.0007
Figure 4: Examples of emoticons and the frequency of usage
observed in Usenet articles, in percent. For example, 2.435% of
downloaded Usenet articles contained a wink emoticon.
electronic methods of communication have devel-
oped visual cues that are associated with emotional
states in an attempt to state the emotion that their text
represents. These have become known as smileys
or emoticons and are glyphs constructed using the
characters available on a standard keyboard, repre-
senting a facial expression of emotion — see Figure
4 for some examples. When the author of an elec-
tronic communication uses an emoticon, they are ef-
fectively marking up their own text with an emo-
tional state. This marked-up text can be used to train
a sentiment classifier if we assume that a smile in-
dicates generally positive text and a frown indicates
generally negative text.
3.1 Emoticon Corpus Construction
We collected a corpus of text marked-up with emoti-
cons by downloading Usenet newsgroups and saving
an article if it contained an emoticon listed in Figure
4. This process resulted in 766,730 articles being
stored, from 10,682,455 messages in 49,759 news-
groups inspected. Figure 4 also lists the percentage
of documents containing each emoticon type, as ob-
served in the Usenet newsgroups.
We automatically extracted the paragraph(s) con-
taining the emoticon of interest (a smile or a frown)
from each message and removed any superfluous
formatting characters (such as those used to indi-
cate article quotations in message threads). In order
to prevent quoted text from being considered more
than once, any paragraph that began with exactly the
same thirty characters as a previously observed para-
graph was disregarded. Finally, we used the classi-
fier developed by Cavnar and Trenkle (1994) to filter
45
Finance M&A Mixed
NB 46.0 ± 2.1 55.8 ± 3.8 49.0 ± 1.6
SVM 50.3 ± 1.7 57.8 ± 6.5 55.5 ± 2.7
Figure 5: Performance of Emoticon-trained classifier across
topics. Mean accuracies with standard deviation, in percent.
Newswire Polarity 1.0
NB 50.3 ± 2.2 56.8 ± 1.8
SVM 54.4 ± 2.8 54.0 ± 0.8
Figure 6: Performance of Emoticon-trained classifiers across
domains. Mean accuracies with standard deviation, in percent.
out any paragraphs of non-English text. This pro-
cess yielded a corpus of 13,000 article extracts con-
taining frown emoticons. As investigating skew be-
tween positive and negative distributions is outside
the scope of this work, we also extracted 13,000 arti-
cle extracts containing smile emoticons. The dataset
is referred to throughout this paper as Emoticons and
contains 748,685 words.
3.2 Emoticon-trained Sentiment Classification
This section describes how the Emoticons corpus
3
was optimised for use as sentiment classification
training data. 2,000 articles containing smiles and
2,000 articles containing frowns were held-out as
optimising test data. We took increasing amounts
of articles from the remaining dataset (from 2,000
to 22,000 in increments of 1,000, an equal number
being taken from the positive and negative sets) as
optimising training data. For each set of training
data we extracted a context of an increasing num-
ber of tokens (from 10 to 1,000 in increments of 10)
both before and in a window
4
around the smile or
frown emoticon. The models were trained using this
extracted context and tested on the held-out dataset.
The optimisation process revealed that the best-
performing settings for the Na
¨
ıve Bayes classifier
was a window context of 130 tokens taken from the
largest training set of 22,000 articles. Similarly, the
best performance for the SVM classifier was found
using a window context of 150 tokens taken from
3
Note that in these experiments the emoticons are used as
anchors from which context is extracted, but are removed from
texts before they are used as training or test data.
4
Context taken after an emoticon was also investigated, but
was found to be inferior. This is because approximately two-
thirds of article extracts end in an emoticon so when using after-
context few features are extracted.
Polarity 1.0 Polarity 2004
NB 56.8 ± 1.8 56.7 ± 2.2
SVM 54.0 ± 0.8 57.8 ± 1.8
Figure 7: Performance of Emoticon-trained classifier across
time-periods. Mean accuracies with standard deviation, in per-
cent.
20,000 articles.
The classifiers’ performance in predicting the
smiles and frowns of article extracts was verified us-
ing these optimised parameters and ten-fold cross-
validation. The mean accuracy of the Na
¨
ıve Bayes
classifier was 61.5%, while the SVM classifier was
70.1%.
Using these same classifiers to predict the senti-
ment of movie reviews in Polarity 1.0 resulted in ac-
curacies of 59.1% (Na
¨
ıve Bayes) and 52.1% (SVM).
We repeated the optimisation process using a
held-out set of 100 positive and 100 negative re-
views from the Polarity 1.0 dataset, as it is possi-
ble that this test needs different parameter settings.
This revealed an optimum context of a window of
50 tokens taken from a training set of 21,000 arti-
cles for the Na
¨
ıve Bayes classifier. Interestingly, the
optimum context for the SVM classifier appeared to
be a window of only 20 tokens taken from a mere
2,000 training examples. This is clearly an anomaly,
as these parameters resulted in an accuracy of 48.9%
when testing against the reserved reviews of Polarity
1.0. We attribute this to the presence of noise, both
in the training set and in the held-out set, and dis-
cuss this below (Section 4.2). The second-best pa-
rameters according to the optimisation process were
a context of 510 tokens taken before an emoticon,
from a training set of 20,000 examples.
We used these optimised parameters to evaluate
the sentiments of texts in the test sets used to eval-
uate dependency in Section 2. Figures 5, 6 and 7
show the final, optimised results across topics, do-
mains and time-periods respectively. These tables
report the average accuracies over three folds, with
the standard deviation as a measure of error.
4 Discussion
The emoticon-trained classifiers perform well (up to
70% accuracy) when predicting the sentiment of ar-
ticle extracts from the Emoticons dataset, which is
encouraging when one considers the high level of
46
Training Testing Coverage
Polarity 1.0 Polarity 1.0 69.8
(three-fold cross-validation)
Emoticons FIN 54.9
M&A 58.1
MIX 60.2
Newswire 46.1
Polarity 1.0 41.1
Polarity 2004 42.6
Figure 8: Coverage of classifiers, in percent.
noise that is likely to be present in the dataset.
However, they perform only a little better than one
would expect by chance when classifying movie re-
views, and are not effective in predicting the senti-
ment of newswire articles. This is perhaps due to the
nature of the datasets — one would expect language
to be informal in movie reviews, and even more so
in Usenet articles. In contrast, language in newswire
articles is far more formal. We might therefore infer
a further type of dependence in sentiment classifica-
tion, that of language-style dependency.
Also, note that neither machine-learning model
consistently out-performs the other. We speculate
that this, and the generally mediocre performance of
the classifiers, is due (at least) to two factors; poor
coverage of the features found in the test domains
and a high level of noise found in Usenet article ex-
tracts. We investigate these factors below.
4.1 Coverage
Figure 8 shows the coverage of the Emoticon-trained
classifiers on the various test sets. In these exper-
iments, we are interested in the coverage in terms
of unique token types rather than the frequency of
features, as this more closely reflects the training of
the models (see Section 2.1). The mean coverage
of the Polarity 1.0 dataset during three-fold cross-
validation is also listed as an example of the cov-
erage one would expect from a better-performing
sentiment classifier. The Emoticon-trained classifier
has much worse coverage in the test sets.
We analysed the change in coverage of the
Emoticon-trained classifiers on the Polarity 1.0
dataset. We found that the coverage continued to im-
prove as more training data was provided; the cov-
erage of unique token types was improving by about
0.6% per 1,000 training examples when the Emoti-
48
50
52
54
56
58
60
3000
6000
9000
12000
15000
18000
Training Size
100
200
300
400
500
600
700
800
900
1000
Context Size
48
50
52
54
56
58
60
Accuracy (%)
Figure 9: Change in Performance of the SVM Classifier on
held-out reviews from Polarity 1.0, varying training set size and
window context size. The datapoints represent 2,200 experi-
ments in total.
cons dataset was exhausted.
It appears possible that more training data will im-
prove the performance of the Emoticon-trained clas-
sifiers by increasing the coverage. Potential sources
for this include online bulletin boards, chat forums,
and further newsgroup data from Usenet and Google
Groups
5
. Future work will utilise these sources to
collect more examples of emoticon use and analyse
any improvement in coverage and accuracy.
4.2 Noise in Usenet Article Extracts
The article extracts collected in the Emoticons
dataset may be noisy with respect to sentiment. The
SVM classifier seems particularly affected by this
noise. Figure 9 depicts the change in performance
of the SVM classifier when varying the training set
size and size of context extracted. There are signif-
icant spikes apparent for the training sizes of 2,000,
3,000 and 6,000 article extracts (as noted in Section
3.2), where the accuracy suddenly increases for the
training set size, then quickly decreases for the next
set size. This implies that the classifier is discover-
ing features that are useful in classifying the held-
out set, but the addition of more, noisy, texts soon
makes the information redundant.
Some examples of noise taken from the Emoti-
cons dataset are: mixed sentiment, e.g.
5
47
“Sorry about venting my frustration here but I
just lost it. :-( Happy thanks giving everybody
:-)”,
sarcasm, e.g.
“Thank you so much, that’s really encouraging
:-(”,
and spelling mistakes, e.g.
“The movies where for me a major desapoint-
ment :-(”.
In future work we will investigate ways to remove
noisy data from the Emoticons dataset.
5 Conclusions and Future Work
This paper has demonstrated that dependency in sen-
timent classification can take the form of domain,
topic, temporal and language style. One might sup-
pose that dependency is occurring because classi-
fiers are learning the semantic sentiment of texts
rather than the general sentiment of language used.
That is, the classifiers could be learning authors’
sentiment towards named entities (e.g. actors, direc-
tors, companies, etc.). However, this does not seem
to be the case. In a small experiment, we part-of-
speech tagged the Polarity 2004 dataset and auto-
matically replaced proper nouns with placeholders.
Retraining on this modified text did not significantly
affect performance.
But it may be that something more subtle is hap-
pening. Possibly, the classifiers are learning the
words associated with the semantic sentiment of en-
tities. For example, suppose that there has been a
well-received movie about mountaineering. During
this movie, there is a particularly stirring scene in-
volving an ice-axe and most of the reviewers men-
tion this scene. During training, the word ‘ice-axe’
would become associated with a positive sentiment,
whereas one would suppose that this word does not
in general express any kind of sentiment.
In future work we will perform further tests to de-
termine the nature of dependency in machine learn-
ing techniques for sentiment classification. One way
of evaluating the ‘ice-axe’ effect could be to build a
‘pseudo-ontology’ of the movie reviews — a map
of the sentiment-bearing relations that would enable
the analysis of the dependencies created by the train-
ing process. Other extensions of this work are to
collect more text marked-up with emoticons, and to
experiment with techniques to automatically remove
noisy examples from the training data.
Acknowledgements
This research was funded by a UK EPSRC stu-
dentship. I am very grateful to Thorsten Joachims,
Roy Lipski, Bo Pang and John Trenkle for kindly
making their data or software available, and to the
anonymous reviewers for their constructive com-
ments. Thanks also to Nick Jacobi for his discus-
sion of the ‘ice-axe’ effect. Special thanks to my su-
pervisor, John Carroll, for his continued advice and
encouragement.
References
W. B. Cavnar and J. M. Trenkle. 1994. N-Gram-Based
Text Categorization. In Proceedings of the Third An-
nual Symposium on Document Analysis and Informa-
tion Retrieval, pages 161–175, Las Vegas, Nevada.
Kushal Dave, Steve Lawrence, and David M. Pennock.
2003. Mining the Peanut Gallery: Opinion Extrac-
tion and Semantic Classification of Product Reviews.
In Proceedings of the International World Wide Web
Conference, Budapest, Hungary.
Charlotta Engstr
¨
om. 2004. Topic Dependence in Sen-
timent Classification. Master’s thesis, University of
Cambridge, July.
T. Joachims. 1999. Making large-Scale SVM Learning
Practical. In B. Sch
¨
olkopf, C. Burges, and A. Smola,
editors, Advances in Kernel Methods - Support Vector
Learning. MIT Press.
Bo Pang and Lillian Lee. 2004. A Sentimental Educa-
tion: Sentiment Analysis Using Subjectivity Summa-
rization Based on Minimum Cuts. In Proceedings of
the 42nd Annual Meeting of the Association for Com-
putational Linguistics, Barcelona, Spain.
Bo Pang, Lillian Lee, and Shivakumar Vaithyanathan.
2002. Thumbs up? Sentiment Classification using
Machine Learning Techniques. In Proceedings of the
2002 Conference on Empirical Methods in Natural
Language Processing, University of Pennsylvania.
Ellen Spertus. 1997. Smokey: Automatic Recognition
of Hostile Messages. In Proceedings of the Innovative
Applications of Artificial Intelligence.
Peter D. Turney. 2002. Thumbs up or thumbs down?
Semantic orientation applied to unsupervised classifi-
cation of reviews. In Proceedings of the 40th Annual
Meeting of the Association for Computational Linguis-
tics (ACL’02), pages 417–424, Philadelphia, Pennsyl-
vania.
48