Báo cáo khoa học: "Using Readers to Identify Lexical Cohesive Structures in Texts" potx
Bạn đang xem bản rút gọn của tài liệu. Xem và tải ngay bản đầy đủ của tài liệu tại đây (79.38 KB, 6 trang )
Proceedings of the ACL Student Research Workshop, pages 55–60,
Ann Arbor, Michigan, June 2005.
c
2005 Association for Computational Linguistics
Using Readers to Identify Lexical Cohesive Structures in Texts
Beata Beigman Klebanov
School of Computer Science and Engineering
The Hebrew University of Jerusalem
Jerusalem, 91904, Israel
Abstract
This paper describes a reader-based exper-
iment on lexical cohesion, detailing the
task given to readers and the analysis of
the experimental data. We conclude with
discussion of the usefulness of the data in
future research on lexical cohesion.
1 Introduction
The quest for finding what it is that makes an ordered
list of linguistic forms into a text that is fluently read-
able by people dates back at least to Halliday and
Hasan’s (1976) seminal work on textual cohesion.
They identified a number of cohesive constructions:
repetition (using the same words, or via repeated
reference, substitution and ellipsis), conjunction and
lexical cohesion.
Some of those structures - for example, cohesion
achieved through repeated reference - have been
subjected to reader based tests, often while trying to
produce gold standard data for testing computational
models, a task requiring sufficient inter-annotator
agreement (Hirschman et al., 1998; Mitkov et al.,
2000; Poesio and Vieira, 1998).
Experimental investigation of lexical cohesion is
an emerging enterprise (Morris and Hirst, 2005) to
which the current study contributes. We present our
version of the question to the reader to which lexi-
cal cohesion patterns are an answer (section 2), de-
scribe an experiment on 22 readers using this ques-
tion (section 3), and analyze the experimental data
(section 4).
2 From Lexical Cohesion to Anchoring
Cohesive ties between items in a text draw on the
resources of a language to build up the text’s unity
(Halliday and Hasan, 1976). Lexical cohesive ties
draw on the lexicon, i.e. word meanings.
Sometimes the relation between the members of
a tie is easy to identify, like near-synonymy (dis-
ease/illness), complementarity (boy/girl), whole-to-
part (box/lid), but the bulk of lexical cohesive tex-
ture is created by relations that are difficult to clas-
sify (Morris and Hirst, 2004). Halliday and Hasan
(1976) exemplify those with pairs like dig/garden,
ill/doctor, laugh/joke, which are reminiscent of the
idea of scripts (Schank and Abelson, 1977) or
schemata (Rumelhart, 1984): certain things are ex-
pected in certain situations, the paradigm example
being menu, tables, waiters and food in a restaurant.
However, texts sometimes start with descriptions
of situations where many possible scripts could ap-
ply. Consider a text starting with Mother died to-
day.
1
What are the generated expectations? A de-
scription of an accident that led to the death, or of
a long illness? A story about what happened to the
rest of the family afterwards? Or emotional reac-
tion of the speaker - like the sense of loneliness in
the world? Or something more ”technical” - about
the funeral, or the will? Or something about the
mother’s last wish and its fulfillment? Many direc-
tions are easily thinkable at this point.
We suggest that rather than generating predic-
tions, scripts/schemata could provide a basis for
abduction. Once any ”normal” direction is ac-
1
the opening sentence of A. Camus’ The Stranger
55
tually taken up by the following text, there is a
connection back to whatever makes this a normal
direction, according to the reader’s commonsense
knowledge (possibly coached in terms of scripts or
schemata). Thus, had the text developed the ill-
ness line, one would have known that it can be
best explained-by/blamed-upon/abduced-to the pre-
viously mentioned lethal outcome. We say in this
case that illness is anchored by died, and mark it
illness died; we aim to elicit such anchoring rela-
tions from the readers.
3 Experimental Design
We chose 10 texts for the experiment: 3 news ar-
ticles, 4 items of journalistic writing, and 3 fiction
pieces. All news and one fiction story were taken in
full; others were cut at a meaningful break to stay
within 1000 word limit. The texts were in English -
original language for all but two texts.
Our subjects were 22 students at the Hebrew Uni-
versity of Jerusalem, Israel; 19 undergraduates and
3 graduates, all aged 21-29 years, studying various
subjects - Engineering, Cognitive Science, Biology,
History, Linguistics, Psychology, etc. Three of the
participants named English their mother tongue; the
rest claimed very high proficiency in English. Peo-
ple were paid for participation.
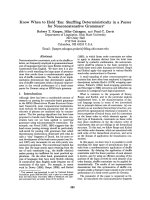
All participants were first asked to read the guide-
lines that contained an extensive example of an an-
notation done by us on a 4-paragraph text (a small
extract is shown in table 1), and short paragraphs
highlighting various issues, like the possibility of
multiple anchors per item (see table 1) and of multi-
word anchors (Scientific or American alone do not
anchor editor, but taken together they do).
In addition, the guidelines stressed the importance
of separation between general and personal knowl-
edge, and between general and instantial relations.
For the latter case, an example was given of a story
about children who went out in a boat with their fa-
ther who was an experienced sailor, with an explana-
tion that whereas father
children and sailor boat
are based on general commonsense knowedge, the
connection between sailor and father is not some-
thing general but is created in the particular case be-
cause the two descriptions apply to the same person;
people were asked not to mark such relations.
Afterwards, the participants performed a trial an-
notation on a short news story, after which meetings
in small groups were held for them to bring up any
questions and comments
2
.
The Federal Aviation Administration underestimated
the number of aircraft flying over the Pantex Weapons Plant
outside Amarillo, Texas, where much of the nation’s surplus
plutonium is stored, according to computerized studies
under way by the Energy Department.
the where amarillo texas outside
federal much
aviation nation federal
administration federal surplus
underestimated plutonium weapons
number underestimated is
of stored surplus
aircraft aviation according
flying aircraft aviation to
over flying computerized
pantex studies underestimated
weapons under
plant way
outside by
amarillo energy plutonium
texas federal department administration
Table 1: Example Annotation from the Guidelines
(extract). x c d means each of c and d is an
anchor for x.
The experiment then started. For each of the 10
texts, each person was given the text to read, and
a separate wordlist on which to write down annota-
tions. The wordlist contained words from the text,
in their appearance order, excluding verbatim and
inflectional repetitions
3
. People were instructed to
read the text first, and then go through the wordlist
and ask themselves, for every item on the list, which
previously mentioned items help the easy accommo-
dation of this concept into the evolving story, if in-
deed it is easily accommodated, based on the com-
monsense knowledge as it is perceived by the anno-
tator. People were encouraged to use a dictionary if
they were not sure about some nuance of meaning.
Wordlist length per text ranged from 175 to 339
items; annotation of one text took a person 70 min-
2
The guidelines and all the correspondence with the partici-
pants is archived and can be provided upon request.
3
The exclusion was done mainly to keep the lists to reason-
able length while including as many newly mentioned items as
possible. We conjectured that repetitions are usually anchored
by the previous mention; this assumption is a simplification,
since sometimes the same form is used in a somewhat different
sense and may get anchored separately from the previous use of
this form. This issue needs further experimental investigation.
56
utes on average (each annotator was timed on two
texts; every text was timed for 2-4 annotators).
4 Analysis of Experimental Data
Most of the existing research in computational lin-
guistics that uses human annotators is within the
framework of classification, where an annotator de-
cides, for every test item, on an appropriate tag out
of the pre-specified set of tags (Poesio and Vieira,
1998; Webber and Byron, 2004; Hearst, 1997; Mar-
cus et al., 1993).
Although our task is not that of classification, we
start from a classification sub-task, and use agree-
ment figures to guide subsequent analysis. We use
the by now standard
statistic (Di Eugenio and
Glass, 2004; Carletta, 1996; Marcu et al., 1999;
Webber and Byron, 2004) to quantify the degree of
above-chance agreement between multiple annota-
tors, and the statistic for analysis of sources of
unreliability (Krippendorff, 1980). The formulas for
the two statistics are given in appendix A.
4.1 Classification Sub-Task
Classifying items into anchored/unanchored can be
viewed as a sub-task of our experiment: before writ-
ing any particular item as an anchor, the annotator
asked himself whether the concept at hand is easy
to accommodate at all. Getting reliable data on this
task is therefore a pre-condition for asking any ques-
tions about the anchors. Agreement on this task av-
erages for the 10 texts. These reliability
figures do not reach the area which is the
accepted threshold for deciding that annotators were
working under similar enough internalized theories
4
of the phenomenon; however, the figures are high
enough to suggest considerable overlaps.
Seeking more detailed insight into the degree of
similarity of the annotators’ ideas of the task, we
follow the procedure described in (Krippendorff,
1980) to find outliers. We calculate the category-
by-category co-markup matrix
for all annotators
5
;
then for all but one annotators, and by subtraction
find the portion that is due to this one annotator.
We then regard the data as two-annotator data (one
4
whatever annotators think the phenomenon is after having
read the guidelines
5
See formula 7 in appendix A.
vs. everybody else), and calculate agreement coef-
ficients. We rank annotators (1 to 22) according to
the degree of agreement with the rest, separately for
each text, and average over the texts to obtain the
conformity rank of an annotator. The lower the rank,
the less compliant the annotator.
Annotators’ conformity ranks cluster into 3
groups described in table 2. The two members of
group A are consistent outliers - their average rank
for the 10 texts is below 2. The second group (B)
is, on average, in the bottom half of the annota-
tors with respect to agreement with the common,
whereas members of group C display relatively high
conformity.
Gr Size Ranks Agr. within group ( )
A 2 1.7 - 1.9 0.55
B 9 5.8 - 10.4 0.41
C 11 13.6 - 18.3 0.54
Table 2: Groups of annotators, by conformity ranks.
It is possible that annotators in groups A, B and C
have alternative interpretations of the guidelines, but
our idea of the ”common” (and thus the conformity
ranks) is dominated by the largest group, C. Within-
group agreement rates shown in table 2 suggest that
two annotators in group A do indeed have an alter-
native understanding of the task, being much better
correlated between each other than with the rest.
The figures for the other two groups could sup-
port two scenarios: (1) each group settled on a dif-
ferent theory of the phenomenon, where group C is
in better agreement on its version that group B on
its own; (2) people in groups B and C have basically
the same theory, but members of C are more sys-
tematic in carrying it through. It is crucial for our
analysis to tell those apart - in the case of multiple
stable interpretations it is difficult to talk about the
anchoring phenomenon; in the core-periphery case,
there is hope to identify the core emerging from 20
out of 22 annotations.
Let us call the set of majority opinions on a list of
items an interpretation of the group, and let us call
the average majority percentage consistency. Thus,
if all decisions of a 9 member group were almost
unanimous, the consistency of the group is 8/9 =
89%, whereas if every time there was a one vote
57
edge to the winning decision, the consistency was
5/9=56%. The more consistent the interpretation
given by a group, the higher its agreement coeffi-
cient.
If groups B and C have different interpretations,
adding a person p from group C to group B would
usually not improve the consistency of the target
group (B), since p is likely to represent majority
opinion of a group with a different interpretation.
On the other hand, if the two groups settled on
basically the same interpretation, the difference in
ranks reflects difference in consistency. Then mov-
ing p from C to B would usually improve the con-
sistency in B, since, coming from a more consistent
group, p’s agreement with the interpretation is ex-
pected to be better than that of an average member
of group B, so the addition strengthens the majority
opinion in B
6
.
We performed this analysis on groups A and C
with respect to group B. Adding members of group
A to group B improved the agreement in group B
only for 1 out of the 10 texts. Thus, the relation-
ship between the two groups seems to be that of dif-
ferent interpretations. Adding members of group C
to group B resulted in improvement in agreement in
at least 7 out of 10 texts for every added member.
Thus, the difference between groups B and C is that
of consistency, not of interpretation; we may now
search for the well-agreed-upon core of this inter-
pretation. We exclude members of group A from
subsequent analysis; the remaining group of 20 an-
notators exhibits an average agreement of
on anchored/unanchored classification.
4.2 Finding the Common Core
The next step is finding a reliably classified subset of
the data. We start with the most agreed upon items -
those classified as anchored or non-anchored by all
the 20 people, then by 19, 18, etc., testing, for ev-
ery such inclusion, that the chances of taking in in-
stances of chance agreement are small enough. This
means performing a statistical hypothesis test: with
how much confidence can we reject the hypothesis
6
Experiments with synthetic data confirm this analysis: with
20 annotations split into 2 sets of sizes 9 and 11, it is possible
to get an overall agreement of about
either with 75%
and 90% consistency on the same interpretation, or with 90%
and 95% consistency on two interpretations with induced (i.e.
non-random) overlap of just 20%.
that certain agreement level
7
is due to chance. Con-
fidence level of
is achieved including items
marked by at least 13 out of 20 people and items
unanimously left unmarked.
8
The next step is identifying trustworthy anchors
for the reliably anchored items. We calculated av-
erage anchor strength for every text: the number of
people who wrote the same anchor for a given item,
averaged on all reliably anchored items in a text. Av-
erage anchor strength ranges between 5 and 7 in dif-
ferent texts. Taking only strong anchors (anchors of
at least the average strength), we retain about 25%
of all anchors assigned to anchored items in the reli-
able subset. In total, there are 1261 pairs of reliably
anchored items with their strong anchors, between
54 and 205 per text.
Strength cut-off is a heuristic procedure; some of
those anchors were marked by as few as 6 or 7 out
of 20 people, so it is not clear whether they can be
trusted as embodiments of the core of the anchoring
phenomenon in the analyzed texts. Consequently, an
anchor validation procedure is needed.
4.3 Validating the Common Core
We observe that although people were asked to mark
all anchors for every item they thought was an-
chored, they actually produced only 1.86 anchors
per anchored item. Thus, people were most con-
cerned with finding an anchor, i.e. making sure that
something they think is easily accommodatable is
given at least one preceding item to blame for that;
they were less diligent in marking up all such items.
This is also understandable processing-wise; after a
scrupulous read of the text, coming up with one or
two anchors can be done from memory, only occa-
sionally going back to the text; putting down all an-
chors would require systematic scanning of the pre-
vious stretch of text for every item on the list; the
latter task is hardly doable in 70 minutes.
7
A random variable ranging between 0 and 20 says how
many “random” people marked an item as anchored. We model
“random” versions of annotators by taking the proportions
of items marked as anchored by annotator in the whole of the
dataset, and assuming that for every word, the person was toss-
ing a coin with P(heads) = , independently for every word.
8
Confidence level of
allows augmenting the set
of reliably unanchored items with those marked by 1 or 2 peo-
ple, retaining the same cutoff for anchoredness. This cut covers
more than 60% of the data, and contains 1504 items, 538 of
which are anchored.
58
Having in mind the difficulty of producing an ex-
haustive list of anchors for every item, we conducted
a follow-up experiment to see whether people would
accept anchors when those are presented to them, as
opposed to generating ones. We used 6 out of the
10 texts and 17 out of 20 annotators for the follow-
up experiment. Each person did 3 text, each texts
received 7-9 annotations of this kind.
For each text, the reader was presented with the
same list of words as in the first part, only now each
word was accompanied by a list of anchors. For each
item, every anchor generated by at least one person
was included; the order of the anchors had no corre-
spondence with the number of people who generated
it. A small number of items also received a random
anchor – a randomly chosen word from the preced-
ing part of the wordlist. The task was crossing over
anchors that the person does not agree with.
Ideally, i.e. if lack of markup is merely a dif-
ference in attention but not in judgment, all non-
random anchors should be accepted. To see the dis-
tance of the actual results from this scenario, we cal-
culate the total mass of votes as number of anchored-
anchor pairs times number of people, and check
how many are accept votes. For all non-random
pairs, 62% were accept votes; for the core annota-
tions (pairs of reliably anchored items with strong
anchors) 94% were accept votes, texts ranging be-
tween 90% and 96%; for pairs with a random an-
chor, only 15% were accept votes. Thus, agreement
based analysis of anchor generation data allowed us
to identify a highly valid portion of the annotations.
5 Conclusion
This paper presented a reader-based experiment on
finding lexical cohesive patterns in texts. As it often
happens with tasks related to semantics/pragmatics
(Poesio and Vieira, 1998; Morris and Hirst, 2005),
the inter-reader agreement levels did not reach the
accepted reliability thresholds. We showed, how-
ever, that statistical analysis of the data, in conjunc-
tion with a subsequent validation experiment, allow
identification of a reliably annotated core of the phe-
nomenon.
The core data may now be used in various ways.
First, it can seed psycholinguistic experimentation
of lexical cohesion: are anchored items processed
quicker than unanchored ones? When asked to re-
call the content of a text, would people remember
prolific anchors of this text? Such experiments will
further our understanding of the nature of text-reader
interaction and help improve applications like text
generation and summarization.
Second, it can serve as a minimal test data for
computational models of lexical cohesion: any good
model should at least get the core part right. Much
of the existing applied research on lexical cohesion
uses WordNet-based (Miller, 1990) lexical chains to
identify the cohesive texture for a larger text pro-
cessing application (Barzilay and Elhadad, 1997;
Stokes et al., 2004; Moldovan and Novischi, 2002;
Al-Halimi and Kazman, 1998). We can now subject
these putative chains to a direct test; in fact, this is
the immediate future research direction.
In addition, analysis techniques discussed in the
paper – separating interpretation disagreement from
difference in consistency, using statistical hypoth-
esis testing to find reliable parts of the annota-
tions and validating them experimentally – may be
applied to data resulting from other kinds of ex-
ploratory experiments to gain insights about the phe-
nomena at hand.
Acknowledgment
I would like to thank Prof. Eli Shamir for guidance
and numerous discussions.
References
Reem Al-Halimi and Rick Kazman. 1998. Temporal in-
dexing through lexical chaining. In C. Fellbaum, ed-
itor, WordNet: An Electronic Lexical Database, pages
333–351. MIT Press, Cambridge, MA.
Regina Barzilay and Michael Elhadad. 1997. Using lex-
ical chains for text summarization. In Proceedings
of the ACL Intelligent Scalable Text Summarization
Workshop, pages 86–90.
Jean Carletta. 1996. Assessing agreement on classifica-
tion tasks: the kappa statistic. Computational Linguis-
tics, 22(2):249–254.
Barbara Di Eugenio and Michael Glass. 2004. The kappa
statistic: a second look. Computational Linguistics,
30(1):95–101.
M.A.K. Halliday and Ruqaiya Hasan. 1976. Cohesion in
English. Longman Group Ltd.
59
Marti Hearst. 1997. Texttiling: Segmenting text into
multi-paragraph subtopic passages. Computational
Linguistics, 23(1):33–64.
Lynette Hirschman, Patricia Robinson, John D. Burger,
and Marc Vilain. 1998. Automating coreference:
The role of annotated training data. CoRR, cmp-
lg/9803001.
Klaus Krippendorff. 1980. Content Analysis. Sage Pub-
lications.
Daniel Marcu, Estibaliz Amorrortu, and Magdalena
Romera. 1999. Experiments in constructing a corpus
of discourse trees. In Proceedings of ACL’99 Work-
shop on Standards and Tools for Discourse Tagging,
pages 48–57.
Mitchell Marcus, Beatrice Santorini, and Mary Ann
Marcinkiewicz. 1993. Building a large annotated cor-
pus of english: the penn treebank. Computational Lin-
guistics, 19(2):313 – 330.
G. Miller. 1990. Wordnet: An on-line lexical database.
International Journal of Lexicography, 3(4):235–312.
Ruslan Mitkov, Richard Evans, Constantin Orasan,
Catalina Barbu, Lisa Jones, and Violeta Sotirova.
2000. Coreference and anaphora: developing anno-
tating tools, annotated resources and annotation strate-
gies. In Proceedings of the Discourse Anaphora and
Anaphora Resolution Colloquium (DAARC’2000),
pages 49–58.
Dan Moldovan and Adrian Novischi. 2002. Lexical
chains for question answering. In Proceedings of
COLING 2002.
Jane Morris and Graeme Hirst. 2004. Non-classical lexi-
cal semantic relations. In Proceedings of HLT-NAACL
Workshop on Computational Lexical Semantics.
Jane Morris and Graeme Hirst. 2005. The subjectivity
of lexical cohesion in text. In James C. Chanahan,
Yan Qu, and Janyce Wiebe, editors, Computing atti-
tude and affect in text. Springer, Dodrecht, The Nether-
lands.
Massimo Poesio and Renata Vieira. 1998. A corpus-
based investigation of definite description use. Com-
putational Linguistics, 24(2):183–216.
David E. Rumelhart. 1984. Understanding under-
standing. In J. Flood, editor, Understanding Reading
Comprehension, pages 1–20. Delaware: International
Reading Association.
Roger Schank and Robert Abelson. 1977. Scripts, plans,
goals, and understanding: An inquiry into human
knowledge structures. Hillsdale, NJ: Lawrence Erl-
baum.
Sidney Siegel and John N. Castellan. 1988. Nonpara-
metric statistics for the behavioral sciences. McGraw
Hill, Boston, MA.
Nicola Stokes, Joe Carthy, and Alan F. Smeaton. 2004.
Select: A lexical cohesion based news story segmenta-
tion system. Journal of AI Communications, 17(1):3–
12.
Bonny Webber and Donna Byron, editors. 2004. Pro-
ceedings of the ACL-2004 Workshop on Discourse An-
notation, Barcelona, Spain, July.
A Measures of Agreement
Let
be the number of items to be classified;
- the number of categories to classify into; - the
number of raters; is the number of annotators
who assigned the i-th item to j-th category. We
use Siegel and Castellan’s (1988) version of ; al-
though it assumes similar distributions of categories
across coders in that it uses the average to estimate
the expected agreement (see equation 2), the cur-
rent experiment employs 22 coders, so averaging is a
much better justified enterprise than in studies with
very few coders (2-4), typical in discourse annota-
tion work (Di Eugenio and Glass, 2004). The calcu-
lation of the
statistic follows (Krippendorff, 1980).
The Statistic
(1)
(2)
(3)
The Statistic
(4)
(5)
(6)
(7)
(8)
60