A REPORT PREPARED BY THE DEPARTMENT OF THE TREASURY WITH THE DEPARTMENT OF EDUCATION ppt
Bạn đang xem bản rút gọn của tài liệu. Xem và tải ngay bản đầy đủ của tài liệu tại đây (1.91 MB, 43 trang )
T
HE ECONOMICS OF HIGHER EDUCATION
A
REPORT PREPARED BY THE DEPARTMENT OF THE TREASURY WITH THE
DEPARTMENT OF EDUCATION
DECEMBER 2012
“We can't allow higher education to be a luxury in this country. It's an economic imperative that
every family in America has to be able to afford.”
– President Barack Obama, February 27, 2012
2
Executive Summary
Higher education is a critical mechanism for socioeconomic advancement among aspiring
individuals and an important driver of economic mobility in our society. Moreover, a well-
educated workforce is vital to our nation’s future economic growth. American companies and
businesses require a highly skilled workforce to meet the demands of today’s increasingly
competitive global economy. Higher education is provided through a complex public-private
market, with many different individuals and institutions participating. While postsecondary
education has become increasingly important, there have also been growing concerns about the
cost and affordability of higher education. This report discusses the current state of higher
education, with a brief high-level overview of the market and a more detailed discussion and
analysis of the financial aid system. We also discuss the important changes the President has
made to make higher education more accessible and affordable. Our key findings are:
• The economic returns to higher education remain high and provide a pathway for
individual economic mobility;
• Public colleges educate the vast majority of the nation’s students enrolled in institutions
of higher education but private, for-profit schools are growing the most rapidly;
• Historically, society provided a significant subsidy to young people through the
widespread availability of inexpensive public higher education. However, over the past
several decades, there has been a substantial shift in the overall funding of higher
education from state assistance, in the forms of grants and subsidies, to increased tuition
borne by students;
• The Obama Administration has offset some of those increased costs with recent increases
in educational support through increased Pell grants and the American Opportunity Tax
Credit; and
• The combination of decreased state subsidies for higher education and increased federal
spending on financial aid represents a shift in the responsibility for paying for college
toward a greater onus on students, families, and the federal government.
Total College Enrollment Has Grown Since The Mid-1980s
• The total number of students enrolled at institutions of higher education increased from
under 13 million in 1987 to over 21 million in 2010.
1
o Almost 73 percent attend a public college, a broad category that ranges from local
two-year community colleges to graduate research institutions.
o Approximately 18 percent attend a private non-profit college, a sector that ranges
from research universities to small liberal arts colleges and specialized religious
institutions.
o Approximately 9 percent attend a private for-profit (i.e., “proprietary”) institution.
Enrollment growth is fastest at for-profit schools, which have increased in size
from 200,000 students in the late 1980s to nearly 2 million students today.
1
Snyder & Dillow (2012).
3
College Educated Workers Have Higher Expected Earnings
• There is substantial evidence that education raises earnings. The median weekly earnings
of a full-time, bachelor’s degree holder in 2011 were 64 percent higher than those of a
high school graduate ($1,053 compared to $638).
2
o The earnings differential grew steadily throughout the 1980s and 1990s. Recent
evidence suggests that the earnings differential observed today is higher than it
has ever been since 1915, which is also the earliest year for which there are
estimates of the college wage gap.
o Moreover, the earnings differential underestimates the economic benefits of
higher education since college-educated workers are less likely to be unemployed
and more likely to have jobs that provide additional non-wage compensation
(e.g., paid vacation, employer-provided health insurance).
• Higher education is important for intergenerational mobility. Without a college degree,
children born in the bottom income quintile have a 45 percent chance of remaining there
as adults. With a degree, they have less than a 20 percent chance of staying in the bottom
quintile of the income distribution and a roughly equal chance of ending up in any of the
higher income quintiles.
3
Posted Tuition Has Increased Significantly But Increases In Net Tuition Have Been Milder
• Posted tuition (which does not include living costs and does not account for financial aid)
has risen sharply in the past two decades at both public and private non-profit colleges.
However, in the past 15 years, increased financial aid has mitigated the degree to which
increases in posted tuition have been passed through to students.
4
o Average posted in-state tuition for four-year, public institutions more than
doubled between 1991 and 2013, from $3,350 to $8,660. Average posted out-of-
state tuition grew 45 percent, from $11,000 in 2000 to $16,000 in 2011.
Measured in 2012
dollars:
o Average posted tuition at four-year, private non-profit universities rose 57 percent
between 1991 and 2013, from $16,410 to $29,060.
o Average net tuition, which is posted tuition minus expected grants and tax
benefits, has also increased but at a slower rate. Average net in-state tuition at
public institutions increased by 58 percent between 1991 and 2013, from $1,840
to $2,910. Average net tuition at private non-profit institutions increased by 25
percent between 1991 and 2013, from $11,060 to $13,870.
o Even though posted tuition increased noticeably, net tuition for in-state students at
four-year, public schools is only slightly higher than it was in 2008, due to
increases in grants and tax benefits.
2
Bureau of Labor Statistics (2012).
3
Brookings analysis of the Panel Study of Income Dynamics (Isaacs, Sawhill, & Haskins, 2011).
4
Trends in College Pricing 2011 (Baum & Ma, 2011). Data on average net tuition for for-profit colleges and out-
of-state public universities are not available.
4
• State funding for public institutions of higher education has declined, both in per-student
terms and as a share of total revenue. State funding declined from almost 60 percent of
college and university revenue in the late 1980s to slightly below 40 percent today.
• Public colleges and universities have become increasingly reliant on student tuition as a
source of funding.
Federal Financial Aid Helps Students Pay For The Increasing Costs Of School
• Federal financial aid represents the majority of all financial aid. In 2009-2010, an
estimated $173 billion was distributed to undergraduates, of which $124 billion (72
percent) was from federal sources.
5
• The two largest components of the federal financial aid system are Pell grants and
Stafford loans.
o Pell grants provide low-income undergraduate students with funds for higher
education that do not have to be repaid. In 2010-2011, almost half of all
undergraduates received a Pell grant, with an average grant of $3,800 and a
maximum award of $5,550. In the aggregate, the Pell program awarded over $35
billion in 2010-2011.
6
o Stafford loans are federal student loans. For a subsidized Stafford loan, the
federal government pays interest for undergraduate students while the student is
in school; for unsubsidized Stafford loans, the interest accrues while the student is
enrolled. The Stafford loan program distributed approximately $90 billion in
Fiscal Year (FY) 2011, of which 46 percent was in the form of subsidized loans.
7
President Obama’s Education Policies
In response to recent trends, such as the rise in posted tuition, the Obama Administration has
implemented several new policies to provide relief for students and their families. As part of the
American Recovery and Reinvestment Act (ARRA), the maximum Pell grant increased from
$4,731 in 2008 to $5,550 in 2010. ARRA also replaced the Hope Credit with the more generous
American Opportunity Tax Credit (AOTC). Compared to the Hope Credit, the AOTC has a
higher credit amount (up to $2,500 compared to $1,800), is available for four years instead of
two years, and is available to a broader range of families due to its partial refundability and
higher income limits. More recently, the reduced 3.4 percent interest rate on subsidized Stafford
loans was extended for another year, rather than rising to 6.8 percent as scheduled under existing
law. Finally, starting in 2009, student borrowers participating in the Direct Loan program could
opt for the “income-based repayment” (IBR) plan, which caps monthly student loan payments at
15 percent of discretionary income and forgives any remaining balance after 25 years in the
program. In 2010 legislation, IBR was made more generous starting in 2014, with a lower
maximum on payments (10 percent instead of 15 percent) and forgiveness after 20 years (instead
of 25 years). And in Fall 2011, the Administration announced its new “Pay as You Earn”
program that would provide similar benefits to new borrowers starting in 2012.
5
Baum & Payea (2011).
6
Department of Education, 2010-2011 Federal Pell Grant Program End-of-Year Report.
7
Other dates in this section are academic year.
5
I. Introduction
Higher education is a critical mechanism for individual socioeconomic advancement and an
important driver of economic mobility. Moreover, a well-educated workforce is vital to our
nation’s future economic growth. American companies and businesses require a highly skilled
workforce to meet the demands of today’s increasingly competitive, global economy. Higher
education is provided through a complex public-private market, with many different types of
individuals and institutions participating. President Obama has supported higher education by
increasing the Pell grant, establishing the American Opportunity Tax Credit, expanding income-
based repayment for student loans, and freezing the interest rate on subsidized student loans.
College enrollment has grown rapidly since the mid-1980s, with almost 20 million
undergraduates enrolled today.
8
Postsecondary education has become an increasingly important determinant of a worker’s
earnings. In 1980, a college graduate earned 50 percent more than a high school graduate; by
2008, college graduates earned nearly twice as much as those with only a high school diploma.
The vast majority of students (73 percent) attend public
institutions, ranging from local community colleges to large research institutions. Eighteen
percent of students attend private non-profit schools, a category which includes private
universities, liberal arts colleges, and small religious institutions. Though for-profit schools have
existed for decades, they have recently become a larger share of postsecondary education and
have experienced rapid growth in enrollment. Today, nine percent of students are enrolled at
for-profit schools.
9
However, there is an increasing concern about the cost and affordability of higher education. At
four-year, public institutions, posted tuition is almost three times higher than it was in the early
1980s. At four-year, private non-profit schools, tuition today is almost 2.5 times higher
compared to the early 1980s.
10
8
Snyder & Dillow (2012).
9
Acemoglu & Autor (2010).
10
Unless otherwise noted, dollar values in this report are all adjusted for inflation.
The high growth rate in college tuition has coincided with two other shifts in higher education.
First, increases in posted tuition have coincided with a significant decline in state government
funding for public higher education. For example, in 1987, four-year, public institutions derived
60 percent of their total revenue from state government support and 20 percent from student
tuition payments. By 2009, the composition had shifted substantially—state government funding
constituted only 40 percent of revenue while tuition payments constituted another 40 percent.
Put another way, tuition, as a share of college revenue, doubled while state government support
fell by approximately 33 percent.
Second, beginning in the 1990s, increased availability of financial aid has helped offset increases
in posted tuition, resulting in fewer students paying the full posted price. While average posted
tuition (excluding room and board) at in-state, four-year, public schools increased from $3,350 to
$8,660 between 1991 and 2013, “net tuition,” which is posted tuition minus average grants and
tax benefits for those who received aid, increased from just $1,840 to $2,910.
6
More recently, the Obama Administration increased the availability of grants and tax-based
educational benefits. The means-tested Pell grant provided an average of $3,800 and up to
$5,550 per student to 9.3 million undergraduates in the 2010-2011 school year. In addition to
Pell grants, the federal government also provides tax-based financial aid for higher education,
such as the American Opportunity Tax Credit (AOTC), which lowers the annual out-of-pocket
cost of school by refunding a portion of educational expenses in the form of a lower tax liability.
State and local governments and the schools themselves also provide a variety of grants and
scholarships to students. These increases in Pell grants and the newly-introduced American
Opportunity Tax Credit have helped to hold average net tuition essentially constant over the past
four years. The decline in state government support and increasing generosity of financial aid
are both aspects of a broader paradigm shift from broad, publicly-subsidized higher education to
greater reliance on tuition payments from students and their families.
Grants and tax-based aid are only two pieces of the federal financial aid system. Federal student
loans, such as Stafford loans, provide broad access to credit to pay for higher education. Unlike
grants and tax credits, loans allow individuals to spend future income to pay for today’s
expenses. Increased reliance on loans shifts the burden of paying for college from those
immediately paying for tuition and other expenses (primarily the parents and grandparents of
current students) to the ongoing payers of student loans—typically the students themselves.
Under President Obama, the federal government has taken on a dual role in addressing this
change. It has increased its direct assistance in the form of higher Pell grants and increased tax
benefits to help offset declines from state governments. The federal government has also
increased the accessibility and affordability of loans to allow students to finance their own
education. These different forms of financial aid reflect the dual roles of the federal financial aid
system to provide a subsidy for lower-income students and to help students of all income levels
finance college education.
The first section of this report provides a broad overview of the basic characteristics of the
market for higher education. The report then discusses the impact of higher education on
individual earnings and economic mobility. The next section focuses on cost and access to
higher education, including the difference between posted and net tuition. The final section
considers the financial aid system and other federal policies related to higher education.
7
II. The Higher Education Landscape
U.S. postsecondary education represents a significant aggregate investment. In 2009,
postsecondary institutions received approximately $497 billion in total revenues (3.6 percent of
GDP), including $144 billion in federal grants and loans.
11
They employed 3.7 million workers,
2.4 percent of the 154 million individuals in the labor force.
12
A majority of Americans over the
age of 25—115 million adults, or 57 percent of the over-25 population—have completed at least
some college. This includes 80 million adults who have earned an associate’s degree or higher.
13
Historical Context
The role of state governments in establishing and maintaining public colleges and universities
dates back to our nation’s founding and accelerated significantly around the time of the Civil
War. The Morrill Land-Grant Acts of 1862 and 1890 distributed federal land to states to help
them establish new or fund existing colleges. What is currently Iowa State University is the first
institution that resulted from these pieces of legislation. The original 1944 G.I. Bill included a
generous tuition subsidy and monthly living allowance for World War II veterans pursuing
higher education or vocational training, allowing an estimated 2.2 million men to attend
college.
14
Today, colleges and universities can be divided into three broad categories: public, private non-
profit, and private for-profit (or “proprietary”) schools. Public institutions, which range from
two-year community colleges to large graduate research institutions, are non-profit institutions
that typically receive a portion of their funding directly from state and local governments.
Private non-profit institutions include some of the nation’s more selective institutions, such as
the Ivy League schools, as well as many more small liberal arts colleges and religious
institutions. Unlike non-profit schools, private for-profit schools do not have tax-preferred “non-
profit” status, allowing them to distribute profits to investors. For example, the largest for-profit
school is the University of Phoenix, owned and operated by the publicly traded Apollo Group.
In response to the launching of Sputnik, the National Defense Education Act of 1958
specifically aimed to make the United States more competitive in science and technology by
creating the first federal student loan program and comprehensive education reform at the
primary and secondary levels.
Enrollment Trends
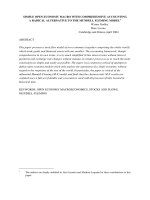
Enrollments at public, private non-profit, and private for-profit institutions have grown since the
mid-1980s, as shown in Figure 1. The total number of students enrolled at institutions of higher
learning increased from under 13 million in 1987 to over 21 million in 2010. Public institutions,
ranging from graduate research institutions to small two-year community colleges, continue to
enroll the majority of all college students.
11
Snyder & Dillow (2012) and Baum & Payea (2011).
12
Table 257, Snyder & Dillow (2012).
13
U.S. Census Bureau, Educational Attainment in the United States: 2011.
14
Bound & Turner (2002).
8
Growth in college enrollment is driven by increases in both the total number of college-aged
individuals and the propensity of high school graduates to attend college. In 1990, the
population of 18 to 24 year olds was approximately 27 million; by 2010 the size of this
demographic group was almost 31 million.
15
The Department of Education (ED) estimates that
of the 2.9 million people who finished high school in 2010, 68.1 percent (approximately 2.2
million) enrolled in college that same year.
16
Figure 1: Total Enrollment Over Time
One decade earlier, in 2001, only 61.8 percent of
recent graduates enrolled in college right out of high school (1.6 million of 2.5 million).
Notes: From Table 198 in the Digest of Education Statistics (DES) 2011 (Snyder &Dillow, 2012). Figure
includes both undergraduate and graduate students; graduate students constitute between 10 and 15
percent of total enrollment.
Panel A of Table 1 breaks out total enrollment for 2009 by type of postsecondary institution.
Today, the vast majority of students (73 percent, or 14.8 million out of 20.4 million) attend a
public school. Private non-profit institutions account for 18 percent of students (3.8 million),
and 9 percent attend a private, for-profit institution (1.9 million).
The growth rates within each sector have been quite different:
• Public school enrollment has grown 50 percent, from approximately 10 million in the late
1980s to almost 15 million in 2010.
• Private non-profit school enrollment has grown 33 percent, from 3 million to 4 million
over that same time period.
• For-profit school enrollment has increased at a more rapid rate, from only 200,000
students in the late 1980s to nearly 2 million in 2010.
15
Census Bureau (1990, 2010a). While the number of 18 to 24 year olds increased in the past two decades, young
adults make up a slightly smaller fraction of the total population today (9.9 percent) than in 1990 (10.8 percent).
16
Table 208, DES 2010 (Snyder & Dillow, 2011). High school completion, as measured by the ratio of high school
graduates to the population that is 17 years old, increased between 1990 and 2010 (from 73 percent to 77 percent)
(Table 110, DES 2010).
9
Table 1: Enrollment Breakdown by Institution Type, 2009
A: All Students
Institution Type
Program
Length
Enrollment
As a % of Total Enrollment
Full-Time
Part-Time
Full-Time
Part-Time
Public
2-year
2,880,631
4,220,814
14.1%
20.7%
4-year
5,649,713
2,059,484
27.7%
10.1%
Private non-profit
2-year 23,483 11,284 0.1% 0.1%
4-year
2,783,162
947,154
13.6%
4.6%
Private for-profit
2-year 344,609 40,585 1.7% 0.2%
4-year
1,041,184
425,608
5.1%
2.1%
Total number of undergraduates = 20,427,711
B: “New” Undergraduates (i.e., Freshmen Students), High School Class of 2009
Institution Type
Program
Length
Enrollment
As a % of New Undergraduates
Full-Time
Part-Time
Full-Time
Part-Time
Public
2-year
1,147,281
950,814
22.7%
18.8%
4-year
1,739,950
220,395
34.4%
4.4%
Private non-profit
2-year
7,533
1,550
0.1%
0.0%
4-year
811,000
51,346
16.0%
1.0%
Private for-profit
2-year
49,346
2,844
1.0%
0.1%
4-year
62,956
12,472
1.2%
0.2%
Total number of “New” undergraduates = 5,057,487
Notes: From Table 201 of the DES 2010. Panel B is derived by summing individual enrollment figures for
“Under 18” and “18 and 19” year olds.
Among college students age 19 and under (who are likely to be first-time college students), 50.4
percent (34.4 percent public and 16.0 percent private non-profit) are full-time students at a four-
year, non-profit school (see Panel B of Table 1). A sizeable fraction of these traditional-age
college students (25 percent) attend college part-time, mostly at two-year public schools (e.g.,
community colleges). For-profit institutions enroll a very small fraction of these young students,
which suggests that much of the recent growth in for-profit enrollment has come from attracting
older students, such as adult learners or transfer students.
Composition of Schools
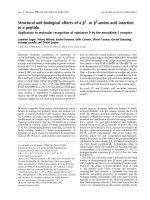
While the number of people going to college has increased, the number of traditional colleges
has been relatively constant (see Figure 2). In the past two decades, the total number of non-
profit degree-granting institutions has remained steady at about 3,300, almost equally divided
into public and private schools. Therefore, increased enrollment at non-profit institutions came
almost exclusively from increased enrollment per school. By contrast, the number of for-profit
institutions has almost doubled since the mid-1990s. In 1997, there were about 600 proprietary
schools in the United States, but by 2010 there were nearly 1,200.
10
Figure 2: Number of Degree-Granting Institutions
Notes: From Table 279 of DES 2011. The discontinuity in the number of for-profits
between 1996 and 1997 is due to a definitional change in the data.
Education in the Population
In 2011, an estimated 40 percent of the population 25 years and older had a two-year or four-year
college degree. Among young adults age 25 to 34, the fraction of college graduates is slightly
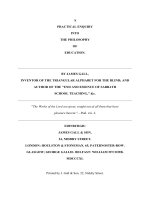
higher (43 percent). The fraction of college graduates differs across racial groups and between
men and women (see Figure 3). African-Americans and Latinos complete college (associate’s
degree or higher) at much lower rates (28 percent and 20 percent, respectively) than whites (46
percent) and Asians (62 percent). Today, young women are more likely to be college-educated
than young men. Among 25 to 34 year olds, 27 percent of men attended college but have less
than a four-year degree, as compared to 31 percent of women. The gender differential is even
larger among college graduates; 29 percent of men aged 25-34 have at least a bachelor’s degree,
compared to 37 percent of women in this age range.
11
Figure 3: Educational Attainment, 25-34 Year Olds
Notes: Based on Educational Attainment in the United States: 2011 (U.S. Census Bureau). “Some
college” consists of individuals who attended some college but did not receive a degree.
12
17
Goldin & Katz (1999).
18
Ibid.
19
Ibid.
20
Poterba (1997).
The High School Movement
Today, nearly 80 percent of adults 18 to 24 years old in the United States are high school
graduates. However, the nearly universal high school system we have today did not exist a
century ago. It was in the early 20th century that the “high school movement” (1910-1940)
made secondary education widely available.
17
High schools in the 19th century were considered “elitist,” only serving those whose families
were wealthy enough to send their children to college, so taxpayers did not support public
funding. However, during the early 20th century, local communities began to support
widespread secondary education, changing high schools from a system that prepared “for
college” into one that taught “for life.” The proponents of secondary education argued that, not
only is education vital to civil society, but high school graduates also earned almost twice as
much as those without diplomas. One rationale for public funding of high schools was that
private markets inefficiently transfer resources between generations. Under a public funding
system, older, taxpaying citizens in the prime years of their working lives would fund education
for cash-constrained young adults and, in turn, receive additional support when they entered
retirement or became unable to work. As education was publicly funded for them, these young
adults would then, in turn, pay for the education of the next generation. As a result of the high
school movement, high school completion rates increased tremendously, from 9 percent of
American youth in 1910 to almost 40 percent by 1935.
18
Evidence of this intergenerational compact was apparent in the early 1900s; states with a higher
fraction of older voters, as well as those that were more homogeneous in terms of ethnicity,
religion, and income, spent a larger fraction of income on public education.
19
However,
intergenerational support for public education seems to have weakened in recent decades.
Polling and case studies suggest that older voters are less likely to support tax increases or bond
measures for public education (though no less likely to support tax increases for other
objectives), and states with older populations now have lower per-pupil school expenditures.
20
Deterioration of intergenerational support for education may lead to declining levels of education
for young people, a less productive workforce, and diminished living standards for future
generations.
13
III. Why Education?
“The moral case for doing a better job of giving Americans the opportunity to succeed is very
compelling. The economic case is just as strong. If more Americans are educated, more will be
employed, their collective earnings will be greater, and the overall productivity of the American
workforce will be higher.”
–Treasury Secretary Timothy Geithner, March 15, 2012
Skill premium
There is substantial evidence that education raises earnings. Individuals with a bachelor’s degree
earn more and are less likely to be unemployed than those with only a high school diploma (see
Figure 4). In 2011, the median weekly earnings for bachelor’s degree holders were 65 percent
higher than earnings of high school graduates ($1,053 compared to $638). Those with a high
school diploma were nearly twice as likely to be unemployed as those with a college or advanced
degree. In aggregate, the additional earnings from two or four years of college (relative to only
high school) were $2.4 trillion, or 16 percent of the $15 trillion in total GDP.
21
Figure 4: Education Pays
Source: Bureau of Labor Statistics (2012). Data are for individuals age 25 and over. Earnings are for full-
time wage and salary workers.
The skill premium—usually quantified as the difference in wages between college and high
school graduates—increased rapidly during the 1980s. In 1980, college graduates earned 50
percent more than those with a high school diploma, controlling for other factors that affect
21
This assumes an 8 percent return for each year of education, consistent with most literature (see Card (1999) for a
summary), and that individuals work 52 weeks in a year. In Q1 2012, BLS estimated that approximately 26 million
individuals age 25 and older have some college or an associate’s degree; another 35 million have at least a four-year
degree. Median weekly earnings in Q1 2012 for those with some college attainment was $754; median weekly
earnings for those with at least a four-year degree was $1,158.
14
wages, such as experience. By 2004, this gap had risen to 90 percent and does not appear to
have narrowed since.
22
Figure 5: Relative Wages and Quantity of Skilled Workers
The increasing relative earnings of college graduates is a combination of
increasing earnings for college graduates and decreasing earnings for those with only a high
school diploma. Earnings differentials also understate the true difference in compensation since
high school graduates tend to have jobs that provide less generous benefits (e.g., health
insurance, paid sick leave, pension benefits, or paid vacation). A bachelor’s degree also opens
the door to further study and potentially higher earnings later in life.
Source: Autor (2010), using March Current Population Survey, 1963-2008. Both panels are in logarithms
and adjust for changes in the composition of the labor force over time. The relative supply index is a
composite measure of hours worked that adjusts for changes in productivity over time.
As depicted in Figure 5A above, the skill premium increased and then decreased before the
1980s, but has increased steadily since then. Recent evidence suggests that the earnings
differential observed today is higher than it has ever been since 1915, which is also the earliest
year for which there are estimates of the college wage gap.
23
22
Acemoglu & Autor (2010).
23
Goldin & Katz (2008).
Empirical evidence suggests that
one important driver of the rising skill premium is the continually increasing demand for skilled
15
workers and a deceleration in the supply of college graduates.
24
Since at least the early 20
th
Century, technology has allowed advanced economies to substitute physical capital for manual
labor in the production of goods and services. Machinery, computers, and other technical
infrastructure have required skilled workers to design and operate; this so-called “skill-biased
technological change” increased the relative demand for skilled workers.
25
While demand for
skilled labor has continually increased, the supply of college-educated workers has not kept pace.
The 1960s and 1970s were associated with an increase in college attendance, leading to a rapid
influx of skilled workers into the labor force in the 1970s, and thus decreasing the skill premium
in that period. However, the relative supply of college-educated workers has slowed since the
1980s, which further magnified the increases in the skill premium (see panel B in Figure 5).
26
While the financial benefits of earning a college degree are well-established, higher education
may also bring non-financial benefits to graduates as well as benefits to the economy at large.
College graduates report being in better health, have lower mortality rates and higher civic
engagement, and are less likely to draw on the social safety net.
27
Economic Mobility
Research universities also
devote significant resources to knowledge creation and innovation, which benefits not just the
university and its students, but also the general public.
While the benefit of higher education to students is substantial and well-documented, it is more
difficult to measure spillovers of higher education to the economy at large. Cross-country
comparisons have found that countries with higher educational attainment have higher GDP
growth rates. The limitation of such studies is that it is difficult to know how much of the
education-growth link reflects where countries are on the development path.
Education enhances intergenerational mobility, the ability of children to move up and down the
economic ladder independent of their parents’ economic status. The opportunities for economic
mobility are starkly different between college and high school graduates. Without a college
degree, children born in the lowest income quintile have a 45 percent chance of remaining in the
bottom quintile as adults and a nearly 70 percent chance of ending up in the bottom two quintiles
(see Figure 6). With a college degree, children born in the bottom quintile have less than a 20
percent chance of staying in the bottom quintile of the income distribution and about an equal
chance of ending up in any of the higher income quintiles.
24
Other potential drivers of increasing income inequality include decreasing rates of unionization (Card, 2001) and
declines in the real minimum wage (Lee, 1999). In addition to these sources, a large portion of the growth in the
college wage premium in the past two decades reflects strong earnings growth among those with advanced (i.e.,
post-college) degrees (Autor, Katz, & Kearney, 2008; James, 2012).
25
Katz & Murphy (1992), Berman, Bound, & Griliches (1994).
26
Goldin & Katz (2008); Acemoglu & Autor (2010); Card & Lemieux (2001).
27
Summarized in Baum, Ma, and Payea (2010).
16
Figure 6: Intergenerational Mobility
Source: Brookings analysis of the Panel Study of Income Dynamics (Isaacs, Sawhill, & Haskins, 2011).
For those at the lower end of the income distribution, increased levels of education do not make
them as likely to end up in the top part of the distribution as someone who was born into the
upper end of the distribution. Among children born into the bottom quintile (leftmost column in
each panel), those without a college degree have about a 14 percent chance of being in the top
two quintiles as adults (signified by the top two sections of each bar) while those with a college
degree have about a 41 percent chance. Those born in the top quintile (rightmost column in each
panel) who do not have a degree have approximately a 43 percent chance of earning in the top
two quintiles as adults, but those who obtain a degree have a greater than 80 percent chance of
remaining at the top of the distribution. This indicates that education among those born in the
top quintile plays a strong role in maintaining higher levels of income across generations.
Children born in the top quintile who do not obtain a college degree are almost equally likely to
end up in any of the five income quintiles. Put differently, equalizing educational attainment
would not fully equalize incomes later in life but would help to make them more equal.
Further, an individual’s level of educational attainment is highly correlated with parental income.
While students across the entire income distribution are now more likely to go to college now
than a generation ago, these gains are significantly larger for children from high-income families.
17
Figure 7: Trends in College Entry and Completion, By Birth Cohort
Source: Figure 2 and 3 from Bailey and Dynarski (2011) using the National Longitudinal Survey of Youth,
1979 and 1997. Figure depicts entry and completion probabilities for two birth cohorts, who are first
surveyed as young adults in 1979 and 1997, respectively.
For children born in the early 1960s, about 20 percent of those born in the lowest income quartile
attended college, compared to nearly 60 percent of those born at the top (see Figure 7). A
generation later, the probability of attending college increased by 22 percentage points for the
top income quartile, but only half that (10 percentage points) for those at the bottom. Gains in
completion are even more uneven. Among top quartile children, 54 percent graduated college
compared to only 36 percent in the previous generation. Over the same period, low-income
children were only 4 percentage points more likely to graduate. Continuation of these trends
may augur reduced earnings mobility.
18
IV. Access to Higher Education
“The need to dramatically elevate college attainment is an urgent one – for our students, our
families, our communities, and ultimately our nation’s future. Every capable, hard-working and
responsible student should be able to access and afford higher education – and we all have a
role to play to keep college part of the American Dream.”
– Education Secretary Arne Duncan
This section focuses on the financial cost of higher education. Costs are just one dimension of
college access, and college is only one part of the educational sequence. For example, some
economists have argued that investments in early childhood education may have extremely high
payoffs.
28
Given the immediate focus of this report, we consider the economic determinants of
access. However, the many dimensions of college preparedness and educational quality are part
of the larger conversation on educational attainment.
29
Posted tuition doubled between 1980 and 2000 (see Figure 8). While tuition at all schools
increased at similar rates before 2000, since then tuition at four-year public colleges, two-year
public colleges, and four-year private non-profit schools has diverged. Tuition growth at four-
year, public institutions has been almost twice as high as the pre-2000 period, while tuition at
private non-profit colleges has continued to grow at about the same rate. Tuition at community
colleges (i.e., two-year, public institutions) grew at a rate similar to that at private non-profit
schools, though the relatively higher costs of this latter type of schools means they had a greater
increase in dollar terms.
Tuition and Net Costs
Figure 8: Posted Tuition and Fees (1983 = 100)
Notes: From Figure 5 of Trends in College Pricing 2012
(Baum & Ma, 2012). Tuition figures have been adjusted for inflation.
28
Carneiro and Heckman (2003) argue that gaps in college attendance can be explained by differences in early
childhood. This suggests that policy interventions early in life might have higher returns than those later in a child’s
lifetime. Sawhill, Winship, and Grannis (2012) discuss policies at different stages of life that can have high payoffs.
29
For example, enrollment does not always translate into graduation. For students who started college in the 2003-
2004 academic year, only about 40 percent obtained an associate’s degree or higher within six years (National
Center for Education Statistics, Beginning Postsecondary Students Longitudinal Study 2004/09 (U.S. Department of
Education)).
19
While posted tuition has risen across the higher education sector, so has the amount of financial
aid distributed by educational institutions and the federal government. Net tuition—posted
tuition minus grants and tax benefits, like the American Opportunity Tax Credit—is a measure of
college costs that accounts for both the increased generosity of aid at all levels (federal, state, and
institutional) and higher posted fees.
30,31
The College Board reports that while posted tuition has increased steadily since 1997, increases
in net tuition have been more moderate (see
Figure 9). Posted tuition (excluding room and
board) at a four-year, public school steadily increased from approximately $3,350 in 1991 to
$8,660 in the 2012-2013 school year. Net tuition grew from $1,840 to $2,910 over that entire
period. Net tuition in 2012-2013 is slightly higher than it was in 2008 ($2,470), though the net
tuition in a given state or institution may have changed by more or less. Average posted tuition
at four-year, private non-profit schools increased 57 percent since the early 1990s, from $16,410
to $29,060, but the net tuition increased from $11,060 in 1991 to its peak of $13,870 in the 2007-
2008 school year and has dropped slightly since then. Net tuition at community colleges has
declined by $1,440 from 1991 to 2013.
32
Figure 9: Changes in Posted Tuition Compared to Net Tuition
Notes: Drawn from Table 7 and 8 of Trends in College Pricing 2012. “Net Tuition” is posted tuition minus
grants and tax benefits. Prices are in constant 2012 dollars. Figures do not include room and board.
30
Net tuition also nets out private and employer scholarships. These data are not directly collected by the
Department of Education; the College Board estimates these values based on survey data from scholarship
providers.
31
One key question in education finance is the extent to which financial aid is captured by the schools themselves,
either through higher tuition or lower institutional aid. Recent empirical evidence suggests that schools capture
approximately 16 percent of Pell grant aid, though there is significant heterogeneity across school types (Turner,
2011).
32
By convention, loans do not factor into net price since, from the perspective of students and their families, they do
not necessarily lower the total cost paid by the student. Also, these calculations do not include room and board since
living costs are incurred regardless of whether an individual is a student. However, room and board is a real
expense faced by students and can often be higher in college than if the student lived with his or her family.
Between 1997 and 2012, room and board increased at similar rates between four-year public and private non-profit
colleges, but as a percentage of the total cost of attendance, this increase has been much greater at public schools.
At both four-year, public and private schools, room and board increased by approximately $3,640 ($165 per year).
20
The combination of increasing tuition and increasing aid exacerbates the difference in actual
amount paid between those who receive grants and those who do not. For students who do not
receive any grants, the tuition increase from $16,000 to $29,000 at a four-year, private non-profit
school is a true $13,000 increase in the cost of attendance that must be met with higher personal
or family spending (including using savings), more loans, or other forms of aid, such as work-
study or private scholarships.
Trends in “tuition discounting” are similar between public and private non-profit schools.
Among public schools, the fraction of students receiving aid increased slightly between 2004 and
2008, while the size of recipients’ annual grant packages increased by $500 on average (see
Table 2). Grant aid also increased at private non-profit schools, by $1,500, but the fraction of
students receiving aid remained nearly constant.
Table 2: Changes in Grant Aid To First-Time, Full-Time Undergraduates
% of Students Receiving Grants
Average Grant Among Receivers
(2011 USD)
2003-04
2007-08
2003-04
2007-08
Public
56.3
58.0
5,037
5,579
Private non-profit
81.2
80.6
11,110
12,610
Private for-profit
72.6
72.3
5,097
4,169
Notes: Based on the DES 2010. Percentage of undergraduates receiving grants is from Table 354;
average amount of grants received is from Table 355. Includes grants from federal, state, institutional,
and private sources.
State Budgets and Higher Education
Public institutions have seen the largest increases in posted tuition, as the funding model has
shifted from state-subsidized higher education to more self-financed higher education
supplemented by financial aid. This shift fundamentally changes the distribution of benefits and
the mechanism by which students access higher education.
Tuition is the largest source of revenue for colleges, comprising 40 percent of total revenue (see
Figure 10). Colleges receive an additional 12 percent of revenue in other non-tuition funds from
the federal government, generally in the form of research grants, along with 21 percent from
state and local governments. Students and their families provide approximately 26 percent of
total revenues (in the form of tuition payments), up from 24 percent in 1999. Note that because
students and families are increasingly relying on loans that must be paid off with interest over
time to finance tuition today, these statistics can underestimate the increased cost borne by
students and their families.
21
Figure 10: Sources of Institutional Revenue, 2006-2007 Academic Year
Notes: Derived using data from the Integrated Postsecondary Education Data System (IPEDS) and the
Delta Cost Project. Figure includes public, private non-profit, and private for-profit schools at all levels.
Figure 10 averages public and private institutions together, but public and private schools depend
on different types of funding.
33
The level of state funding per student at four-year, public colleges has also declined. In 1986,
four-year, public institutions received approximately $10,726 in state support per full-time
equivalent student. By 2009, state funding had declined to $8,655 per student.
Historically, private schools have depended heavily on tuition
and endowments while public institutions are primarily funded by state and local funds as well as
tuition. However, state funding for public higher education has declined steadily as a share of
the revenue of these institutions since the 1980s.
34
Figure 11
shows that state and local funds to four-year, public schools have declined from almost 60
percent of revenue in the late 1980s to slightly below 40 percent in recent years.
35
33
Public schools receive approximately $0.21 per dollar of total revenue from the federal government, most of
which is from appropriations. Private non-profit schools receive about half as much from the federal government
($0.11 per dollar), again from appropriations. For-profit schools receive $0.20 per dollar from the U.S. government,
$0.16 of which is from grants.
34
Treasury calculations based on data from the Delta Cost Project.
35
States face tradeoffs between higher education and other budget priorities, since (with the exception of Vermont)
they must balance their budget each fiscal year (or every two years, in the case of biennial budgets). As funding
declines for other state projects, these tradeoffs become even more stark.
Public
institutions have become more reliant on tuition as a revenue source; recently, over 40 percent of
public institutions’ revenue has come from tuition, including federal financial aid, up from just
20 percent in 1987. This represents a sharp increase in tuition funding, which has doubled as a
share of revenue for four-year, public institutions over the past 25 years. In the aggregate, the
increase in tuition funding is almost identical in size to the decrease in the share of revenue
which came from state and local governments through direct payments, which has fallen by
roughly 33 percent. Recently, tuition revenue surpassed state and local government support as
22
the largest source of funding for four-year, public institutions for the first time.
36
Figure 11: Share of Revenue at Public Four-Year Institutions
The
combination of decreased state subsidies for higher education and increased federal spending on
financial aid discussed in the next section represents a shift in the responsibility for paying for
college toward a greater onus on students, families, and the federal government.
Notes: Based on data from IPEDS and the Delta Cost Project. Total revenue decreased in recent years
in part due to falling endowments. As a result, even though government support became less generous
during this period, it increased slightly as a proportion of total revenues. The right panel is measured in
2011 dollars.
The average posted tuition across four-year, public schools was approximately $7,000 in 2011,
up 67 percent since 2000. Tuition for out-of-state students is up 47 percent over the same period;
average tuition for non-residents is approximately $16,000. Out-of-state students face higher
costs and are more likely to pay full tuition since they are not eligible for state-based aid.
37
Capacity Issues and the Rise of For-Profits
Today, the nation’s community colleges enroll nearly 7 million undergraduates, or nearly 4
million full-time equivalent (FTE) students (about 35 percent of all students in higher education).
This is up from 3 million FTE students in 2000.
38
36
Data from the Delta Cost Project.
37
Out-of-state students are still eligible for federal financial aid while international students are usually ineligible for
both state and federal financial aid.
38
Tables 198 and 208, DES 2010 (Snyder & Dillow, 2011).
For comparison, FTE enrollment at four-year,
public schools today is 6 million. Enrollment at community colleges appears to grow more
slowly when the labor market is strong, growing slightly faster in the early 2000s and post-2007,
but remaining relatively flat in between.
23
Community colleges are highly dependent on state funding since, unlike four-year, public
schools, they do not have diversified revenue sources such as hospitals, endowments, or research
grants. While enrollments have been increasing, state support per student has remained
relatively flat (see Figure 12). In 2009, community colleges received approximately $6,450 per
FTE student, only slightly higher than the $6,210 in 1999.
39
Figure 12: Community College Enrollment and State Funding
Funding per student was highest in
2000, before the brief 2001 recession, and bottomed out in 2005. It had just begun to recover
when the 2007 recession began.
Notes: Based on data from IPEDS and the Delta Cost Project.
For-profit schools provide another avenue to access higher education. Community colleges are
more likely to serve low-income and first-generation student populations than four-year schools,
and these students now constitute the bulk of the student population at for-profit schools. Eighty
percent of students at for-profit schools are the first in their family to attend college while 51
percent come from low-income families (i.e., below 150 percent of the poverty level).
40
Tuition charges can differ significantly between public and for-profit schools. In 2009, average
tuition at four-year, public schools was $6,070, compared to $15,021 at four-year for-profits and
$20,845 at private non-profit schools.
41
39
Like state funding per FTE, educational expenditure per FTE student at community colleges has also slightly
increased, from $10,204 in 1999 to $10,242 in 2009 (Desrochers & Wellman, 2011). Benefits have become an
increasing share of total employee compensation costs, and community colleges have increased the number of part-
time faculty, possibly in an attempt to control rising staffing costs.
40
Department of Education (2010). The majority (over 70 percent) of low-income students still attend a public two-
year or four-year school.
41
Figure calculated using data from the Integrated Postsecondary Education Data System.
The combination of high tuition charges and an
economically disadvantaged student body largely explain why for-profit schools receive a
24
disproportionately large share of need-based federal financial aid compared to their enrollment.
The disproportionate usage of need-based aid to attend for-profit institutions raises policy
concerns about educational quality in this sector (e.g., completion, transferability of credits,
accreditation for licensure). Labor market outcomes of graduates from for-profit schools are
mixed.
42
Educational quality and earnings potential are of particular concern for students at for-
profit schools, who are more likely to take on student loans and carry, on average, larger loan
balances than their counterparts at public institutions. For these students, low education quality
and limited earning potential, combined with high student loan indebtedness, can translate into
financial hardship in the years immediately following completion of a degree. Low degree
completion rates at for-profit schools constitute an additional concern.
43
42
Deming, Goldin, & Katz (2012). Compared to observationally similar students at non-profit schools, for-profit
students earned about $2,000 less. Much of this earnings gap is because they are more likely to be unemployed and
more likely to experience substantial unemployment (defined as unemployment greater than three months). Once
employment status is included, there is no longer a statistically significant earnings differential.
43
For more on the rate and level of borrowing at for-profit institutions compared to other types of institutions, see
Borrowing at the Maximum: Undergraduate Stafford Loan Borrowers in 2007-08,” U.S. Department of Education,
NCES 2012-161, October 2011, available at
Baum and Steele (2010)
also look at cumulative student loan debt by institution.
25
V. Financial Aid and Higher Education Policy
The federal financial aid system is intended to provide broad access to credit for higher
education expenses and a subsidy for students from lower-income families. President Obama
has worked to expand federal financial aid and affordability of higher education. The
Administration has increased the size of Pell grants and created the American Opportunity Tax
Credit, both of which lower the expected annual out-of-pocket costs of college. The
Administration has also aided student borrowers by freezing the interest rates on subsidized
loans and expanding income-based repayment.
Sources of Financial Aid: Grants, Work-Study, Loans, and Tax Benefits
The federal government provides the majority of financial aid received by undergraduates in the
United States (see Figure 13). In 2009-2010, an estimated $173 billion in financial aid was
distributed to undergraduates, representing 77 percent of aggregate spending on undergraduate
education. The federal government provided $124 billion in student aid through grants, loans,
and work-study, representing 55 percent of aggregate spending on undergraduate education and
72 percent of all spending on student financial aid.
44
The remaining $49 billion in financial aid
was provided by state and local governments, the schools themselves, and private lenders or
donors. The total cost of college (i.e., tuition plus room and board) in that year was an estimated
$227 billion.
45
Figure 13: Aggregate Spending On Undergraduate Education (2009-2010)
Notes: From Table 1A of Trends in Student Aid 2012 (Baum & Payea, 2012). Average tuition plus room
and board for full-time students in 2009-2010 was $17,464. There were 13 million (full-time equivalent)
undergraduates in 2009-2010, so estimated aggregate spending for undergraduate education was $227
billion.
44
In the previous section, we excluded loans and work-study from the “net tuition” calculation, but we include them
in the financial aid definition here. Loans and work-study expand the ways students can pay for college, and hence
are important components of the overall financial aid system, but do not actually change the price they pay.
45
Average tuition plus room and board for full-time students in 2009-2010 was $17,464. There were 13 million
(full-time equivalent) undergraduates in 2009-2010.