LOW INTEREST RATES AND HIGH ASSET PRICES: AN INTERPRETATION IN TERMS OF CHANGING POPULAR MODELS doc
Bạn đang xem bản rút gọn của tài liệu. Xem và tải ngay bản đầy đủ của tài liệu tại đây (275.19 KB, 33 trang )
LOW INTEREST RATES AND HIGH ASSET PRICES:
AN INTERPRETATION IN TERMS OF CHANGING POPULAR MODELS
By
Robert J. Shiller
October 2007
COWLES FOUNDATION DISCUSSION PAPER NO. 1632
COWLES FOUNDATION FOR RESEARCH IN ECONOMICS
YALE UNIVERSITY
Box 208281
New Haven, Connecticut 06520-8281
Low Interest Rates and High Asset Prices: An Interpretation in Terms of Changing
Popular Economic Models
By Robert J. Shiller
October, 2007
2
Low Interest Rates and High Asset Prices:
An Interpretation in Terms of Changing Popular Economic Models
Abstract
There has been a widespread perception in the past few years that long-term asset prices
are generally high because monetary authorities have effectively kept long-term interest
rates, which the market uses to discount cash flows, low. This perception is not accurate.
Long-term interest rates have not been especially low. What has changed to produce high
asset prices appears instead to be changes in popular economic models that people
actually rely on when valuing assets. The public has mostly forgotten the concept of “real
interest rate.” Money illusion appears to be an important factor to consider.
Robert J. Shiller
Cowles Foundation for Research in Economics
30 Hillhouse Avenue
New Haven CT 06520-8281
3
Low Interest Rates and High Asset Prices:
An Interpretation in Terms of Changing Popular Economic Models
1
By Robert J. Shiller
It is widely discussed that we appear to be living in an era of low long-term
interest rates and high long-term asset prices. Although long rates have been increasing in
the last few years, they are still commonly described as low in the 21
st
century, both in
nominal and real terms, when compared with long historical averages, or compared with
a decade or two ago.
Stock prices, home prices, commercial real estate prices, land prices, even oil
prices and other commodity prices, are said to be very high.
2
The two phenomena appear
to be connected: if the long-term real interest rate is low, elementary economic theory
would suggest that the rate of discount for present values is low, and hence present values
should be high. This pair of phenomena, and their connection through the present value
relation, is often described as one of the most powerful and central economic forces
operating on the world economy today.
In this paper I will critique this common view about interest rates and asset prices.
I will question the accuracy and robustness of the “low-long-rate-high-asset-prices”
description of the world. I will also evaluate a popular interpretation of this situation: that
it is due to a worldwide regime of easy money.
I will argue instead that changes in long-term interest rates and long-term asset
prices seem to have been tied up with important changes in the public’s ways of thinking
1
This paper was prepared for the “Celebration of BPEA” Conference, Brookings Institution, September 6
and 7, 2007. The author is indebted to Tyler Ibbotson-Sindelar for research assistance.
2
See also my paper on real estate prices, written concurrently with this, Shiller (2007).
4
about the economy. Rational expectations theorists like to assume that everyone agrees
on the model of the economy, which never changes, and that only some truly exogenous
factor like monetary policy or technological shocks moves economic variables.
Economists then have the convenience of analyzing the world from a stable framework
that describes consistent public thinking. But, there is an odd contradiction here that is
rarely pointed out: the economists who propose these rational expectations models are
constantly changing their models of the economy. Is it reasonable to suppose that the
public is stably and consistently behind the latest incarnation of the rational expectations
model?
I propose that the public itself is, largely independently of economists, changing
its thinking from time to time. The popular economic models, the models of the economy
believed by the public, have changed massively through time, this has driven both long
rates and asset prices, and that these changes should be central to our understanding of
the major asset price movements we have seen.
3
This paper will begin by presenting some stylized facts about the level of interest
rates (both nominal and real) and the level of asset prices in the world. Next, I will
consider some aspects of the public’s understanding of the economy, including common
understandings of liquidity, the significance of inflation, and real interest rates, and how
their thinking has impacted both asset prices and interest rates. This will lead to a
conclusion that there is only a very tenuous relation between asset prices and either
nominal or real interest rates, a relation that is clouded from definitive econometric
analysis by the continual change in difficult-to-observe popular models.
3
The concept of a popular economic model is discussed in Shiller (1990).
5
Low Long-Term Interest Rates
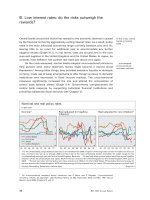
Figure 1 shows nominal long-term (roughly ten-year) interest rates for four
countries and the Euro Area. With the exception of India, all of them have been on a
massive downtrend since the early 1980s. Even India has been on a downtrend since the
mid 1990s. The lowest point for long term interest rates appears to have been around
2003, but, from a broad perspective, the up-movement in long rates since then is small,
and one can certainly say that the world is still in a period of low long rates relative to
much of the last half century.
Long rates are not any lower now than they were in the 1950s, but the high rates
of the middle part of the period are gone now. In the US, long rates are actually above the
historical average 1871-2007, which is 4.72%. The best one could say from this very
long-term historical perspective is that US long rates are not especially high now.
4
Economic theory has widely been interpreted as implying that the discount rate
used to capitalize today’s dividend or today’s rents into today’s asset prices should be the
real, not nominal, interest rate. This is because dividends and rents can be broadly
expected to grow at the inflation rate. However, as Franco Modigliani and Richard Cohn
argued nearly 30 years ago, it may, because of a popular model related to money illusion,
be the nominal rate that is used in the market to convert today’s dividend into a price.
5
4
The long-term government interest rate series for the US 1871-2007 is an update of the series I spliced
together, for my book Irrational Exuberance, 2000, 2005, from series in Sydney Homer’s A History of
Interest Rates for 1871 to 1952, and, starting in 1953, the ten-year Treasury Bond series from the Federal
Reserve.
5
Modigliani and Cohn (1979). The authors also stressed that reported corporate earnings need to be
corrected for the inflation-induced depreciation of their nominal liabilities, and investors do not make these
corrections properly.
6
The cause of the downtrend in nominal rates since the early 1980s is certainly tied
up with a downtrend in inflation rates over much of the world over the period since the
early 1980s. Figure 2 shows real ex-post real long-term interest rates based on a ten-year
maturity for the bonds. The annualized ten-year inflation rate that actually transpired was
used to correct the nominal yield. For dates since 1997, the entire ten-year subsequent
inflation is not yet known, and so for these the missing future inflation rates were
replaced with historical averages for the last ten years. Note that there has been a strong
downtrend in ex-post real interest rates over the period since the early 1980s as well.
The downtrend in the ex-post real interest rate since the early 1980s is nearly as
striking as with nominal rates. In some countries, ex-post real long-term rates became
remarkably close to zero in 2003. Just as with nominal rates, real rates have picked up
since then.
The long-term average ex-post real U.S. long-term government bond yield 1871-
1997 is 2.40%, lower than was seen in 1997 (the last year we can compute this yield
without making assumptions about the future).
6
Even today, using the latest inflation rate
as a forecast, US real long-term interest rates are not obviously low compared to this long
run average. The best we can say for the popular low long-term interest rate view is that
today interest rates remain relatively low when compared with twenty or thirty years ago.
However, ex-post real interest rates may not correspond to ex-ante or expected
real interest rates. It seems unlikely that investors expected the negative ex-post real long
rates of the 1970s which afflicted every major country except stable-inflation Germany. It
is equally unlikely that they expected the high real long rates of the 1980s. After the very
6
Ex-post real US long-term government bond yields 1871-1997 were computed using data as described in
footnote 5 above an in my book Irrational Exuberance 2005.
7
high inflation of the 1970s and the beginning of the 1980s, inflation in the United States,
and elsewhere, came crashing down. It may be that people did not believe that inflation
would stay down over the life of these long-term bonds.
Marvin Goodfriend and Robert King argued that the public rationally did not
believe in the 1980s that the lower inflation would continue. They point out that the Fed
under Chairman Paul Volcker (who served from 1979 until Alan Greenspan took over in
1987) announced its radical new economic policy to combat inflation in 1979, and then
promptly blew their credibility at the time of the January-July 1980 recession. US CPI
inflation reached an annual rate of 17.73% in the first quarter of 1980, and the Fed’s
policy had the effect of reducing that to 6.29% by the third quarter of 1980. The Fed must
have given the impression that it lost its resolve to combat inflation with that recession,
and inflation was quickly back up to 10.95% in the fourth quarter of 1980. Given the fact
that postwar Fed efforts to tame inflation before 1980 were followed in the space of a
number of years with yet higher inflation, a rational public would likely assume that
inflation would again head back up in future years. Hence the expected long-term real
interest rates were not as high in the early 1980s as Figure 2 would suggest. Goodfriend
and King pointed out that at the time Paul Volcker himself regarded the nominal long rate
as an indicator of inflationary expectations, and so implicitly assumed that the expected
long-term real rate was essentially constant
7
A look at international inflation rates suggests that Goodfriend and King’s focus
on Paul Volcker as the stimulus for change in worldwide policy stance towards inflation
may be misplaced, for, on a worldwide basis, the major turning point towards lower
inflation looks more like 1975 than 1981. This was before Volcker’s term as Federal
7
Goodfriend and King (2005).
8
Reserve Board Chairman began, so he is unlikely to be the thought leader behind this
change.
The Brookings Papers on Economic Activity certainly played a major role in the
1970s in the change of thinking among policy authorities on monetary policy. The very
first article in the very first issue, by Robert Gordon in 1970, was about the costs of
monetary policy aimed at reducing inflation. In the early 1970s, the theme of dealing with
the rising inflation without inducing excessive costs on the economy seemed to be the
most significant topic in the Brookings Papers, where some of the most authoritative new
thinking about this problem appeared. It seems more likely that it was the combined
effect of such scholarship and discourse that changed thinking on inflation policy than
that Paul Volcker single-handedly led the world into a new policy regime.
There were also opinion leaders who appealed directly to the broad public to
propose strong policies to deal with inflation. Irving S. Friedman, a former chief
economist at the International Monetary Fund, and then, at the behest of Robert
McNamara, Professor in Residence at the World Bank, wrote a book in 1973 Inflation:
A Growing Worldwide Disaster that may be representative of the kind of thought
leadership that brought down inflation. He wrote:
The social scientist no longer enjoys the luxury and leisure to theorize and
ruminate about society, economics, institutions and interpersonal relations. He is being
called to act as he was during the Great Depression of the 1930s. . . . The inflation is
clearly eroding the fabric of modern societies.
8
Another Friedman was probably far more influential in arguing, effectively, for
consistently tighter monetary policy. Milton Friedman made a career out of criticizing
monetary policy and arguing that the growth rate of the money stock should be targeted,
8
Friedman (1975), p. ix and xi.
9
no matter what effects that has on interest rates or any other economic variable. It was a
plausible-sounding, though radical, recipe for stopping inflation. He won the Nobel Prize
in economics in 1976 and chose to give his Nobel lecture on the inflation problem, which
was published as Inflation and Unemployment: The New Dimension of Politics, in 1977.
He said that:
On this analysis, the present situation cannot last. It will degenerate into
hyperinflation and radical change; or institutions will adjust to a situation of
chronic inflation; or governments will adopt policies that will produce a low rate of
inflation and less government intervention into the fixing of prices.
9
It is plausible that Milton Friedman was of all these people the most important thought
leader who led the historic break to lower inflation. His views on inflation had real
worldwide resonance. When the Volcker Fed made its momentous announcement of a
new monetary policy regime on October 6, 1979, the Federal Open Market Committee in
its official announcement described this as:
A change in method used to conduct monetary policy to support the objective of
containing growth in the monetary aggregates. . . This action involves placing
greater emphasis in day-to-day operations on the supply of bank reserves and less
emphasis on confining short-term fluctuations in the federal funds rate.
10
These words clearly ring, in sound if not fully in substance, as an acceptance of the
Friedman formula, and willingness to accept the consequences of following it.
Friedman left behind an important change in the popular model of the economy.
He created an association in the public mind between a belief in monetary policy that
tolerates large swings in interest rates to preserve monetary targeting and a general belief
in the importance of free markets, even though there is no logical connection between
these two beliefs. By tying a belief that long-run price stability is the paramount objective
9
Milton Friedman (1976). />lecture.pdf
10
Board of Governors of the Federal Reserve System, Press Release, October 6, 1979.
10
for monetary policy with the emerging worldwide faith in free markets, he assured that
this time the efforts to control inflation would not fail.
Perhaps it was thought leaders like these, now sometimes forgotten, who argued
persuasively enough that inflation must be controlled that gave Volcker and other central
bankers the political power to take important steps to do so. The view, as enunciated by
Arthur Okun in 1978, had been that reducing inflation by monetary policy alone entails a
“very costly short-run tradeoff” in increased unemployment and lost output. But the rise
of inflation led to a sense of alarm, and the failure of other measures to control inflation
led to a increasingly widespread conventional view that the nations of the world have no
choice but to tighten monetary policy considerably.
But, the change in thinking influencing policy makers may not have been so
clearly palpable to the public that they brought down their inflationary expectations.
Thus, ex-post real rates may have shot up very high even though ex-ante real rates did
not.
Market real interest rates, that is, inflation-indexed bond yields, Figure 3, have a
shorter history in major countries than do ex-post real rates. In the United Kingdom,
where the series begins in 1985, there is a distinct downtrend until the past few years. In
the United States the path has been irregular, but the general direction has been
downward since they were first created in 1997. This seems to confirm in a very rough
sense that the downtrend in ex-post real interest rates might also be a downtrend in ex-
ante real interest rates. The August 2007 US inflation-indexed bond yield, at 2.32%, is
almost exactly at the 1871-1997 average of US government ex-post real long-term bond
yields, noted above, of 2.40%.
11
But these inflation-indexed markets are still small and not central factors in the
economy and their yields may reflect inessential features of the participants in these
markets. Most of these bonds are still held by institutions, not individuals.
Moreover, the path of real interest long-term rates are substantially different
across the two countries since 1997 even though their asset price movements are fairly
similar as we shall see in the next section.
High Long-Term Asset Prices
Figure 4 shows real dividend yields on stock price indices for the same list of
countries. The period around 1980, when long term interest rates were most high, was
often a period of relatively low stock prices as indicated by the high dividend yields. In
most countries, dividend yields have been on a major downtrend since the long-term
interest rate peak in the early 1980s, though not exactly in phase with the decline in long-
term interest rates.
There was however a major upward correction in dividend yields (downward
correction in stock prices) between 2000 and 2003 unexplained by any rise in long-term
interest rates. In the US, real stock prices fell in half from peak to trough. A good part of
the downward correction has been reversed since 2003, even though over this period
long-rates have generally risen, not fallen.
Hence, one could say that the simple story that long-rates should move opposite
stock prices is consistent with these data but only in a very rough sense. Stock prices
were abnormally low just when long-rates had their enormous peak in the early 1980s,
however, shorter-run movements in the series do not match up well.
12
A remarkable boom in home prices has appeared since the peak in long rates in
the early 1980s. Figure 5 shows real (inflation corrected) home prices for seven major
countries. Five of the seven countries have shown booms. In the United States, the boom
is, for the nation as a whole, the largest since 1890.
11
Prior home price booms seem to
have been relatively contained geographically (for example, to Florida or California). The
fact that the boom has become so pervasive leads one to wonder if it is indeed tied up
with the trend in interest rates. However, the uptrend in home prices clearly does not
begin until the late 1990s, after most of the downtrend in nominal interest rates had
passed. It seems that, although it might seem at first that there is a substantial negative
correlation historically between asset prices and interest rates, this correlation is actually
very weak. However, a perception that there is such a relationship may have an influence
on the market; it may help frame today’s market as justifiably high.
12
The Dynamic Gordon Model and Dividend Yields
The model one hears most often in connection with the level of asset prices is the
Gordon Model
13
:
P
D
Rg
=
−
11
See Shiller, Irrational Exuberance, 2nd Edition, particularly Fig. 2.1, p. 13.
12
There was a mysterious sharp drop in the US TIPS yield after 1999, as can be seen in Figure 3, but it is
hard to imagine that this market, which is hardly noticed by the general public, was driving the housing
market. The TIPS yield was very high in its early years, much higher than historical real interest rates or
index-linked yields in the UK, as the US Treasury tried to entice a highly skeptical public to buy these
innovative securities. The correction down of the TIPS yield only reflects a normalization of this market.
13
Gordon (1962).
13
Where P is price, D is dividend, R is the long-term interest rate, and g is the expected
growth rate of dividends. Or,
D
P
Rg
=−
Where D is dividend per; share, P is price per share, R is the long-term interest rate, and g
is the expected long-term growth rate of dividend. R and g can be either both nominal or
both real. Of course, nominal interest rates are most commonly used, but the idea that g is
expected to be constant might better be used if we suppose it is a real growth rate.
Gordon himself derived this equation as a steady state relation, and did not have
time subscripts, but it is common today to assume that the model holds at each point of
time. John Campbell and I proposed a “dynamic Gordon model, based on a log-
linearization of the present value relation. In an efficient market as we defined it, the
dividend yield should be given by:
δρ
t
j
ttj tj
j
Er d c
=−+
++
=
∞
∑
[]
Δ
0
Where δ
t
is the log of the dividend-price ratio at time t, ρ is the discount factor implicit in
the linearization, r
t+j
is the one-period real interest rate at time t + j, d
t+j
is the log real
dividend at time t + j, and c is a constant term. Note that it is the same as the Gordon
model, essentially, except that instead of using long-term interest rates and growth rates,
we use the present value of one-period interest rates and one-period growth rates of future
dividends. This is a nice model in that it has some interesting predictions about the
changes through time in the dividend-price ratio as it relates to the expected time path of
14
future interest rates and dividend growth rates. But using a vector-autoregressive model
for δ
t
, Δd
t
– r
t
, and the earnings-price ratio, we found assuming rational expectations with
US data 1871-1987 that the correlation between the theoretical log dividend-price ratio
and the actual was only 0.309 and the ratio of the standard deviation of the theoretical
dividend-price ratio and the actual dividend-price ratio was only 0.58. (The latter is a
suggestion of excess volatility of stock prices, but it is not a proper measure of this since
real dividends show some short-run volatility.)
Notably, as one can see in Figure 4, the very high real interest rates in the late
1970s to early 1980s do seem to correspond to somewhat to high dividend yields, at least
when compared with recent years. But the correspondence with interest rates is not
compelling, and seems to apply only in comparisons with the relatively brief period of
anomalously high interest rates and inflation in the late 1970s to early 1980s. And the
high dividend yields then were not so high as interest rates would suggest. In the US, for
example, dividend yields in the early1980s were at about the same level as in the early
1950s. This fact was noted by Blanchard and Summers, who, in their Brookings paper in
1984 wrote “One would expect that a sharp increase in real interest rates at long
maturities, caused by fiscal and monetary policies, would depress stock prices
significantly. Yet in all major countries, real stock prices have been surprisingly strong.
Dividend-price ratios have in no way followed real rates on long-term bonds.”
14
14
Blanchard and Summers (1984) p. 274.
15
The Real Interest Rate in the Public Mind
The theory presumes that real interest rates are natural concepts to use to describe
public decisions. However, in fact, the real interest rate is not even a concept that many
people use to frame their decision-making when they think about asset prices.
The concept of the real interest rate dates back to 1895 with Columbia University
economics professor John Bates Clark whose name is memorialized in a prestigious
economics medal that the American Economic Association awards today. In describing
the concept, he seemed to be presenting it as a strikingly original new idea that he needed
to explain at some length. He wrote about a widespread confusion, that he discerned in
the then-current debate about bimetallism, about the interpretation of interest rates.
Discussing the example of a debtor in an environment with one percent deflation, he
noted that “If he pays a nominal rate of five percent in interest, he may pay a real rate of
six.”
15
In the following year, 1896, Yale University’s Irving Fisher wrote about the same
popular confusion, but did not use the term “real rate” but instead “virtual interest in
commodities.” He also noted the lack of public understanding of the basic concept: “It is
an astonishing fact that the connection between the rate of interest and appreciation has
been almost completely overlooked, both in economic theory and in its bearing upon the
bimetallic controversy.”
16
He was right to be astonished, for indeed the significance of
any interest rate depends critically on the inflation rate, and referring to nominal interest
rates alone may be regarded as almost meaningless.
17
15
Clark (1895) p. 62.
16
Fisher (1896) p. 4.
17
In his 1898 book Geldzins und Güterpreise Knut Wicksell spoke of the related concept of the “natural
rate of interest.”
16
Clark’s long discourse on the elementary concept of real interest rates and
Fisher’s astonishment at the lack of public understanding reflect their recognition of the
importance of what today are classified as behavioral biases in popular economic
thinking, notably a bias called “money illusion,” a term coined by Fisher in 1928. But,
failure to think in terms of real interest rates rather than nominal rates, while it may be
described as an “illusion,” is perhaps better described as just an abject failure to
understand the concept. The concept of real interest rate remains totally absent from the
popular model of the economy.
Indeed, long after they first discussed it, the concept of the real interest rate still
did not even enter the language. People need to understand the concept of real interest
rate if they are to make the dynamic Gordon model work. If they cannot grasp the
concept, then it is hard to see how they will immunize themselves from the money
illusion described by Modigliani and Cohn.
Of course, if people had clearly in mind the nominal growth rate of dividends, the
g in the Gordon formula above, and framed it, as well as the r in r-g, in nominal terms,
there would be no error. But I have not been able to find any popular discussions about
adjusting the projected growth rate of dividends for changes in projected inflation, and it
appears most unlikely that most people do so.
Also, of course, if the pricing of financial assets were exclusively the domain of a
small group of sophisticated investors, the so-called “marginal investors,” then it would
not matter that the general public was making mistakes. However, as I argued in my 1984
Brookings Paper, and as Andrei Shleifer and Rob Vishny also argued, there are many
17
reasons to think that this “smart money” cannot rectify long-term mispricings of major
asset classes.
Modigliani and Cohn made it part of their argument in 1979 that stock prices are
determined by nominal, not real rates, that few news media or business people ever refer
to the concept of real interest rates for the discounting of future corporate cash flows or to
the correction that must be made to corporate earnings for the real value of the interest
owed by the corporation:
. . . the financial press kept asserting that earnings-price ratios had to be
compared with nominal interest rates, while not even mentioning the fact that
profits of firms with large debts should be adjusted for the inflation premium. To be
sure, the financial press may not be the best source of information about how
investors value equities. We therefore endeavored to secure recent memoranda
from large brokerage firms advising institutional investors; in virtually every case,
it was clear that analysts did not add back to earnings the gain on debt, and that
they also relied at least partly on the capitalization of earnings at a nominal rate.
18
With modern day search procedures, we can do a more thorough job of
discovering how often nominal interest rates are corrected for inflation. Based on a
Proquest search of major newspapers, I found that the term “real interest rate” was first
used in the popular press in the modern meaning, quoting an Institute of Life Insurance
study, in 1946, fifty years after the concept was established in professional economics
journals.
19
The words “real interest rate” were occasionally used before that to refer to
other things (for example in criticizing bad lending practices that calculated interest rates
from a fictitious base).
Figure 6 shows the relative incidence of the term “real interest rate” when used in
its modern meaning in US newspapers in the Proquest Newspapers data bases (historical
18
Modigliani and Cohn (1979) p. 35.
19
Christian Science Monitor, “ ‘Real Return’ on Saving Found 43 P. C. below 1939,” November 26, 1946,
p. 15.
18
and modern) relative to “interest rate” since 1960. Between 1890 and 1960 there was
only one reference to real interest rates (as noted above, in 1946). The frequency of
references to real interest rates has been extremely low, never more than a few percent of
references to interest rates. Even those levels of references to real interest rates have been
dropping off precipitously. The concept of “real interest rate” appears to have had its day
and is dying. Note that the frequency of use of “real interest rate” picked up with the
inflation of the 1970s, but can hardly be described as an automatic response to high
inflation since there were earlier high inflation periods that had no use of the term.
It was suggested that perhaps the term “real interest rate” has merely been
replaced over time by “interest rate adjusted for inflation” and so that Figure 6 might
misrepresent the actual use of the concept of real interest rate. I did a search among
newspapers in the Proquest modern newspapers database for “interest rate adjusted for
inflation” or “inflation-adjusted interest rate” or “inflation-indexed interest rate.” These
terms together are indeed much rarer than “real interest rate,” and articles that mentioned
any of these terms never amounted to 0.25% of the number of articles that mentioned
“interest rate.” Moreover, the pattern of the usage of these terms is much the same as
shown in Figure 1, declining in recent years, though usage of these terms as a fraction of
usage of “interest rate” peaked somewhat later, in 1990.
Figure 7 shows the use of the term real interest rate in annual reports in the
Proquest database of corporations’ annual reports, within five-year time periods at five-
year intervals. The same spike in usage of the term appears in these reports in 1980-4.
Remarkably, not a single annual report used the term “real interest rate” in 1995-9 or
2000-4, among over 2000 annual reports in the database in both of those five-year
19
intervals.
20
As with the newspaper data set, the number of annual reports that used the
term “real interest rate” peaked at only 1.8% of the number of annual reports that used
the term “interest rate.” Note also that the word “interest rate” has grown dramatically
over this sample, from 17.7% of annual reports in 1960 to 93.5% in 1980, and has stayed
at around 90% ever since. The effect of the 1980 interest rate peak had its effect on both
“real interest rate” and “interest rate,” but the effect was permanent only on the latter.
The real interest rate concept still seems highly relevant in judging the high asset
prices we observe, but the public won’t buy it. I know this from personal experience,
when I talk with news reporters and attempt to refer to the concept. They listen patiently
and change the subject, and sometimes even offer that their readers don’t relate to such a
concept.
The Treasury Inflation-Protected Security (TIPS) market started in the US in
1997. The term “real interest rate” did not take off with the development of this market.
The US Treasury does not use the term “real interest rate” in association with their sale
and marketing, instead they refer just to “yield” on the Inflation-Indexed Security. The
stark reality and central importance suggested by John Bates Clark’s term was never
suggested by the words that surround TIPS. Part of the relative lack of popularity of TIPS
(only 8% of the US Federal national debt) is that they have not been marketed as solving
fundamental problems or providing important price discovery.
21
20
A search was done in the same annual report database for “interest rate adjusted for inflation,” or
“inflation adjusted interest rate,” or “inflation-adjusted interest rate.” Amazingly, none of these terms was
ever used in any annual report in this database.
21
According to Treasury Bulletin, federal debt securities held by the public first passed $5 trillion in
February 2007 (Table FD-1), and in that month TIPS amounted to $411 billion (Table FD-2). Federal
Reserve Flow of Funds Accounts, Table B100, show household net worth at $56.2 trillion in the first
quarter of 2007, and hence TIPS amount to well under one percent of net worth, and even that held largely
by institutions and foreigners.
20
In my book New Financial Order: Risk in the 21
st
Century (2003) I argued that
governments around the world should adopt new units of measurement for real values,
indexed units of account, like the Unidad de Fomento that Chile adopted in 1967, and
educate their publics to use these units for contracts instead of currency. I proposed that
the units be called “baskets” so that people can appreciate that by trading in these terms,
they are trading in the market baskets that underlie the consumer price index. Only a
major step like this could eliminate money illusion.
Liquidity in the Public Mind
If one looks at the things people actually say, the concepts that come naturally to
them rather than those that are attributed to them by economic theorists, one discovers
that they typically frame the level of asset prices in entirely different terms.
The idea that the world is “awash with liquidity” is part of the lore of the market
recently. I tabulated the occurrence of the phrase “awash with liquidity” in English
language newspapers with a Lexi-Nexis search. I found that the use of the phrase soared
during the stock market boom of the late 1990s, and then soared even higher during the
housing boom, starting 2004. The term was also used rather frequently in the mid 1980s,
just before the stock market crash of 1987.
Reading some of the many recent newspaper accounts of this supposed
phenomenon, it seems clear that some of these popular writings are confused about some
of the most basic principles of economics. It definitely seems that the popular model is
that when people buy stocks their money goes “into” the stock market and sits there, and
so higher stock prices mean that there must be more money (liquidity) to pay for them.
21
An example of the kind of thinking appears in a recent Wall Street Journal article:
“Lenders have been doling out increasingly large sums of money and
accepting increasingly crummy conditions and meager returns on their loans.
Remember those “low-doc” loans that got subprime home buyers in trouble—the
ones that required minimal proof of ability to repay? These are their corporate
cousins.
Waves of money are coming at the markets from investors around the
world. Bond and loan buyers have to put this money to work, even if the deals are
shoddy.”
22
This passage indicates a sort of popular model that is miles away from the idea
that low long-term interest rates are fed into present value formulas to justify high asset
prices.
23
22
Dennis K. Berman, “Sketchy Loans Abound: With Capital Plentiful, Debt Buyers Take Subprime-Type
Risks,” Wall Street Journal, March 27, 2007, p. C1.
23
Some economists have tried to give a more sensible interpretation of what these writers might be saying.
Adrian and Shin (2007) argued that the phenomenon that those who use these terms might be interpreted as
describing is that there is a feedback mechanism operating within investment banks and to a lesser extent
commercial banks that causes them to demand more investments when asset inflation has inflated the assets
on their balance sheets, so that higher asset prices tend to create through this mechanism yet higher asset
prices.
22
Conclusion
We have seen here that the big movements in stock prices and real estate prices in
the last decade or so do not line up with movements in long-term interest rates over the
same time period. This appears to confirm the 1988 results of Campbell and Shiller that
stock prices relative to dividends or earnings are not well explainable in terms of present-
value models with time-varying interest rates. Yet if we are doing very broad
comparisons of the present time with another time, comparing the early 1980s when
interest rates were very high with today, we might say that lower nominal interest rates
are indeed a factor in the relatively higher asset prices we see today.
The money-illusion theory that low nominal interest rates help propel real long-
term asset prices upwards in a time of declining inflation may seem a little unsatisfactory
since it describes people as understanding enough about inflation so as to push nominal
rates down in declining-inflation periods but not understanding it well enough that they
should realize that these lower nominal rates should not be used to discount today’s
dividend into a higher price. It may not seem like a sound approach to economic
theorizing to assume that people understand some applications of a concept and not
others.
But we have seen above that people do not even talk about the concept of real
interest rates today, and so it certainly stands as plausible that they would be vulnerable
to errors in handling all ramifications of the concept equally well. The natural framing of
stock market reports involves dividend-price ratios and earnings-price ratios, which are
already framed so that they can easily be compared with nominal interest rates.
Moreover, public understanding about a world “awash with liquidity” may be reinforced
23
by their perception of an era of low nominal rates, and may help reinforce errors in
pricing. Behavioral economics has always had to confront a public’s partial
understanding of economic concepts, of mental compartments, of framing effects that
distort judgment.
This paper has discussed one simple explanation of the asset booms since the mid
1990s, that they are a direct consequence of falling long-term interest rates. I concluded
that changes in popular economic models should be viewed as more central to our
understanding of these high asset prices. I have not offered a complete theory of the high
asset prices. Presumably, as I discussed in Irrational Exuberance, there are many factors,
including among other things speculative feedback and social epidemics, that have
contributed to high asset prices today.
24
0
2
4
6
8
10
12
14
16
18
1940 1950 1960 1970 1980 1990 2000 2010 2020
Date
Percent per Annum
US
Euro
UK
Japan
India
Figure 1, Long-Term (approximately ten-year) Nominal Interest Rates, 4 countries and
Euro Area, monthly, 1950-2007 Source: Global Financial Data.