An economic tsunami the cost of diabetes in Canada pptx
Bạn đang xem bản rút gọn của tài liệu. Xem và tải ngay bản đầy đủ của tài liệu tại đây (11.08 MB, 13 trang )
An economic tsunami
the cost of diabetes in Ca nada
December 2009
2 |
An economic tsunami: the cost of diabetes in Canada | 1
Table of contents
Executive summary 2
Introduction 5
What is diabetes? 5
Canadian Diabetes Cost Model 8
Diabetes in Canada: cause for alarm 10
The economic burden of diabetes 12
Action on diabetes: an ounce of prevention 15
The Canadian Diabetes Cost Model and its potential 18
The need for action 19
References 21
About this report
This report was commissioned by the Canadian Diabetes
Association to understand for the first time the true
economic costs of diabetes using Canadian data. This
initiative became a priority for the Association as we
observed the dramatic rise in diabetes prevalence in
Canada and world-wide. The Association is a leading
authority on diabetes in Canada and around the
world. It has a heritage of excellence and leadership,
and its co-founder, Dr. Charles Best, along with Dr.
Frederick Banting, is credited with the co-discovery of
insulin. Across the country, the Association leads the
fight against diabetes by helping people with diabetes
live healthy lives while it works to find a cure. The
Association is supported in its efforts by a community-
based network of volunteers, employees, healthcare
professionals, researchers, and partners. By providing
education and services, advocating on behalf of people
This initiative was supported by an unrestricted educational
grant provided by
We thank Novo Nordisk Canada Inc. for its ongoing
commitment to diabetes in Canada.
with diabetes, supporting research, and translating
research into practical applications, the Association is
delivering on its mission.
The Canadian Diabetes Association sought to determine
the economic impact of diabetes on Canadian society,
both now and in the future. To accomplish this,
Informetrica Limited developed a forecasting model,
The Canadian Diabetes Cost Model, on behalf of the
Association to determine the costs associated with
diabetes. The Model also projects the incidence and
prevalence of this disease, as well as several key co-
morbidities among the population with diabetes, to
2025. Informetrica is one of the pioneers of economic
forecasting in Canada. It provides industrial and
geographic forecasts and analysis to a wide variety of
government and private sector clients.
The final report was prepared by Robin Somerville of
The Centre for Spatial Economics (C
4SE) using the
Model to produce Canadian Diabetes Association-
specific scenarios for this report. The C
4SE monitors,
analyzes and forecasts economic and demographic
change throughout Canada at virtually all levels of
geography. It also prepares customized studies on
the economic, industrial and community impacts of
various fiscal and other policy changes, and develops
customized impact and projection models for in-house
client use.
2 |
An economic tsunami: the cost of diabetes in Canada | 3
The economic burden
Diabetes is a personal crisis for people living with the
disease, and for their family. Diabetes is also a financial
crisis for our healthcare system. It is consuming an
ever-larger share of provincial and territorial healthcare
budgets, and will force an increase in those expenditures.
The economic burden of diabetes in Canada is expected
to be about $12.2 billion in 2010, measured in inflation-
adjusted 2005 dollars. This is an increase of $5.9 billion
or nearly double its level in 2000. The cost of the disease
is expected to rise by another $4.7 billion by 2020. The
direct cost of diabetes now accounts for about 3.5% of
public healthcare spending in Canada and this share is
likely to continue rising given the expected increase in
the number of people living with diabetes in Canada.
The Canadian Diabetes Cost Model
– its potential and next steps
The Model provides the first comprehensive picture
of the economic impact of type 1 and type 2 diabetes
on Canadian society. It has the potential to accomplish
much more with respect to developing provincial
costing models and cost benefit assessments of diabetes
intervention and prevention strategies.
The Canadian Diabetes Association will be exploring
these and other ways that the Model can assist the
Association and governments in developing effective
diabetes policies and strategies. In the meantime, the
Association calls upon governments to take immediate
action in a number of key areas, including the
enhancement of the Canadian Diabetes Strategy and the
renewal of the Aboriginal Diabetes Initiative, enhanced
tax strategies for people living with diabetes and further
investment into diabetes research.
Executive summary
This report highlights the dramatic
increase in the prevalence of diabetes in
Canada over the last decade and provides
a sobering view of the outlook for the next
decade. Diabetes is a chronic disease that
affects not only the health of people living
with diabetes, but also imposes significant
direct and indirect costs on them and
on society as a whole. These costs have
escalated sharply over the last decade and
are expected to continue their rapid ascent
for the foreseeable future.
This report introduces a Canadian Diabetes Cost Model
that, for the first time, uses Canadian National Diabetes
Surveillance System (NDSS) data and the Economic
Burden of Illness (EBIC) in Canada approach to calculate
the prevalence and the economic burden of diabetes
in Canada. The Model is a powerful tool designed to
provide insight into the prevalence and costs of diabetes.
In addition, it explores the potential benefits of initiatives
designed to delay or prevent the onset of type 2 diabetes
and reduce the occurrence and severity of complications
arising from the disease for people living with diabetes.
Prevalence
The number of people diagnosed with diabetes in Canada
is expected to double between 2000 and 2010, from
1.3 million to about 2.5 million. More than 20 people
are diagnosed with the disease every hour of every day.
While the number of diagnosed Canadians is large, it is
estimated that an additional 700,000 have the disease but
don’t know it.
From 2010 to 2020, another 1.2 million people are
expected to be diagnosed with diabetes, bringing the total
to about 3.7 million. These increases escalate the share
of the total population with diabetes from 4.2% in 2000
to 7.3% in 2010 to 9.9% in 2020. Rising obesity rates,
sedentary lifestyles, an aging population, and changes in
the ethnic mix of new immigrants have and will continue
to drive these increases.
[ More than 20 people are
diagnosed with the disease
every hour of every day. ]
4 |
An economic tsunami: the cost of diabetes in Canada | 5
4 |
The analysis in this report was conducted using the Canadian Diabetes Cost Model. This
Model was constructed by Informetrica Limited
1
and is the first model to use Canadian
National Diabetes Surveillance System (NDSS) data and the Economic Burden of Illness in
Canada (EBIC) approach to determine the economic impact of type 1 and type 2 diabetes on
Canadian society, both now and in the future.
Introduction
The Model can:
• Project the costs, incidence and prevalence of
diabetes, as well as the co-morbidities common
among people with the disease;
• Determine, where efficacy data exists, the financial
cost-benefit of initiatives designed to delay or
prevent the onset of type 2 diabetes and to reduce the
occurrence and severity of complications arising from
the disease for persons with diabetes; and
• Be developed further to provide province-specific
information that will allow for even broader
applications to assess the cost effectiveness of
potential diabetes interventions, programs and
services that could aid governments in developing
future diabetes strategies.
The Model is an important tool in the fight against
diabetes in Canada. Future enhancements could expand
the variety of analyses possible with this Model.
1. Informetrica Limited.
Economic Cost of Diabetes in Canada: An Overview.
Toronto, ON: Canadian Diabetes Association; 2009.
2. Canadian Diabetes Association, Diabetes Dictionary. Available at www.
diabetes.ca/about-diabetes/what/dictionary/.
[ The Canadian Diabetes Cost
Model is an important tool
in the fight against diabetes
in Canada. ]
What is diabetes?
Diabetes is a chronic, often debilitating, and sometimes
fatal disease in which the body either cannot produce
insulin or cannot properly use the insulin it produces.
This leads to high levels of glucose in the blood, which
can damage organs, blood vessels and nerves. The body
needs insulin to use glucose as an energy source.
There are three types of diabetes:
2
•Type 1 diabetes is an autoimmune disease that occurs
when the pancreas no longer produces any insulin or
produces very little insulin. Type 1 diabetes usually
develops in childhood or adolescence and affects up
to 10% of people with diabetes. There is no cure. It
is treated with lifelong insulin injections and careful
attention to diet and physical activity. Type 1 diabetes
was formerly known as insulin-dependent diabetes or
juvenile diabetes.
•Type 2 diabetes is a disease that occurs when the
pancreas does not produce enough insulin to meet
the body’s needs and/or the body is unable to
respond properly to the actions of insulin (insulin
resistance). Type 2 diabetes usually occurs later in life
(although it can occur in younger people) and affects
approximately 90% of people with diabetes. There
is no cure. It is treated with careful attention to diet
and exercise and usually also diabetes medications
(oral antihyperglycemic agents) and/or insulin.
Type 2 diabetes was formerly known as non-insulin-
dependent diabetes or adult-onset diabetes.
6 |
An economic tsunami: the cost of diabetes in Canada | 7
• Gestational diabetes is first diagnosed or first
develops during pregnancy. It affects 2% to 4% of all
pregnancies. Blood glucose levels usually return to
normal following delivery. Both mother and child are
at higher risk of developing type 2 diabetes later in
life.
3
Prediabetes refers to a condition where a person’s blood
glucose levels are higher than normal, but not yet
high enough to be diagnosed as type 2 diabetes (i.e. a
fasting plasma glucose level of 7.0 mmol/L or higher).
It is estimated that nearly six million Canadians are
living with prediabetes. Although not everyone with
prediabetes will develop type 2 diabetes, many people
will (nearly 50%). Research has shown that some long-
term complications associated with diabetes – such as
heart disease and nerve damage – may begin during
prediabetes.
4
Approximately 90% of all diabetes cases are type 2
diabetes. Type 2 diabetes is usually diagnosed in people
40 years of age or older, although it is increasingly being
diagnosed in children and adolescents. The number of
people with type 2 diabetes is rising dramatically due to a
number of factors:
5
• An aging population – the risk of developing type 2
diabetes rises with age;
• Rising obesity rates – obesity dramatically increases
the likelihood of developing type 2 diabetes;
• Increasingly sedentary lifestyles are contributing to
rising obesity rates, particularly in younger Canadians,
which can lead to type 2 diabetes;
• People of Aboriginal descent are three to five times
more likely than the general population to develop
type 2 diabetes; and
• Almost 80% of new Canadians are from populations
that have a higher risk for type 2 diabetes. These
include people of Hispanic, Asian, South Asian, or
African descent.
Diabetes can lead to serious complications and premature
death:
• 80% of Canadians with diabetes die from a heart attack
or a stroke;
6A
• 42% of new kidney dialysis patients in 2004 had
diabetes;
6B
• Diabetes is the single leading cause of blindness in
Canada;
6C
• 7 of 10 non-traumatic limb amputations are the result
of diabetes complications;
6D
• 25% of people with diabetes suffer from depression;
6E
• The life expectancy for people with type 1 diabetes
may be shortened by as much as 15 years;
6F
and
• The life expectancy for people with type 2 diabetes
may be shortened by 5 to 10 years.
6F
Older Canadians are more likely to have diabetes: In
2005–2006, 22% of people (approximately 1 in 5) in the
75- to 79-year-old age group had been diagnosed with
diabetes. This was almost ten times the proportion seen
in Canadian adults aged 35 to 39, where the prevalence
was 2.3%, or one in 43.
7
Treatment depends on the type of diabetes, and can
include lifestyle modifications and/or medications,
including insulin.
A healthy diet, regular physical activity and maintaining
a healthy body weight are important factors for effective
management of type 2 diabetes. Controlling blood
glucose, blood pressure and cholesterol levels are also
necessary to reduce the complications associated with
diabetes. Self-management of diabetes is an essential
part of overall care. Regular screening for complications
and early treatment can also reduce or delay the
complications of diabetes by as much as 50%.
8
6A. Heart/Stroke: (
Source: Canadian Diabetes Association 2003 CPGs, pg. 58.
6B. Kidney: (CIHI): ( />page=media_07feb2007_e ): Source: CORR Reports - Treatment of End-Stage
Organ Failure in Canada 1995 to 2004 (2006 Annual Report) Date published:
February 7, 2007.
6C. Blindness: Source: Canadian Diabetes Association 2008 CPGs, pg. S2.
6D. Amputation: ( />id=67&morg_id=0&gsec_id=0&item_id=1312&type=atlas); Sources: ICES,
Ontario Diabetes Atlas 2003.
6E. Depression: ( Source:
Canadian Diabetes Association 2008 CPGs, pg. S2.
6F. Life Expectancy: (CDA) />pdf.
7. Public Health Agency of Canada.
The Face of Diabetes in Canada.
Available at
www.phac-aspc.gc.ca.
8. Canadian Diabetes Association.
The Prevalence and Costs of Diabetes.
Available at www.diabetes.ca.
3. Canadian Diabetes Association Clinical Practice Guidelines Expert
Committee. Canadian Diabetes Association 2008 Clinical Practice Guidelines
for the Prevention and Management of Diabetes in Canada.
Canadian Journal
of Diabetes.
2008;32(supplement 1):S1-S201.
4. Public Health Agency of Canada. National Diabetes Fact Sheet, Canada 2007.
and Canadian Diabetes Association.
Prediabetes: The Chance to Change the
Future.
Available at www.diabetes.ca/about-diabetes/what/prediabetes/.
5. Canadian Diabetes Association.
The Prevalence and Costs of Diabetes.
Available at www.diabetes.ca.
[ A healthy diet, regular
physical activity and
maintaining a healthy
body weight are
important factors for
effective management
of type 2 diabetes. ]
8 |
An economic tsunami: the cost of diabetes in Canada | 9
Canadian Diabetes Cost Model
The analysis in this report was conducted using the Canadian Diabetes Cost Model. This
Model was constructed by Informetrica Limited and provides the first comprehensive picture
of the economic impact of type 1 and type 2 diabetes on Canadian society, both now and in
the future. The Model also projects the costs, incidence and prevalence of the disease, as well
as the co-morbidities common among people with diabetes.
Forecasting diabetes prevalence
The Model estimates the number of diabetes cases
prevalent in the population using national estimates
(2005 data) from the National Diabetes Surveillance
System (NDSS) of the rate of new incident cases and
the all-cause mortality rate for persons with diabetes.
This information is combined with Statistics Canada’s
medium population projection to estimate the total
number of persons with diagnosed diabetes through
time.
Projecting health system activity
NDSS provides estimates of all-cause health system usage
for persons with and without diabetes. The difference
between the risks for the two groups is calculated
as a net rate. This net rate, defining the incremental
risk attributable to diabetes, is used to project net or
incremental system activity measures, such as:
• All-cause hospitalization in days;
• Visits to general practitioners (GPs);
• Visits to specialists;
• Hospitalization for cardiovascular disease (CVD); and
• Hospitalization for amputation.
Projecting costs
The treatment and service costs are determined by
applying the rates of occurrence or use to the number
of people with diabetes by age and sex over time. Cost
data for these treatments and services are derived from
Health Canada’s Economic Burden of Illness in Canada
(EBIC)
9
report and are expressed in 2005 (inflation-
adjusted) dollars.
Health costs can be partitioned into two categories,
direct and indirect. The direct costs, representing
healthcare outlays, include:
• Direct hospitalization costs (including amputation,
dialysis, etc.);
• Net (incremental) CVD hospitalization costs;
• Net (incremental) general practitioner costs;
• Net (incremental) specialist costs; and
• Diabetes medication costs.
The specific net elements are estimated as the difference
between the costs incurred by people with diabetes
and those without diabetes; thus, they represent the
incremental costs attributable to diabetes.
The indirect costs capture the economic costs of
diabetes that occur outside the healthcare system. These
costs represent the loss of economic output arising
from either illness (morbidity costs) or premature death
(mortality costs) attributable to diabetes.
9. Health Canada.
Economic Burden of Illness in Canada, 1998.
Ottawa, ON:
Health Canada; 2002. Available at www.hc-sc.gc.ca.
It is important to note that numerous other costs can
also be attributed to diabetes, but are not captured in the
Model. These include long-term care costs, public health
spending and capital spending by the healthcare sector,
and the direct costs associated with third-party support
such as family caregivers or volunteer healthcare activity.
Summary of key assumptions
The prevalence and cost of diabetes provided in this
report is driven by the following assumptions:
• Statistics Canada’s medium growth population
projection;
• Incidence rates for males and females for all age
groups up to age 69 are assumed by the Canadian
Diabetes Association in the reference case to rise at a
rate of 0.75% a year – well below the 1.8% national
average annual increase observed between 1998 and
2005. This forecast may reflect future developments
better than the constant age-sex incidence rate
assumption made by NDSS and in other standard
forecasts;
• Mortality rates by age and sex are fixed at the average
of the last three years of available NDSS data;
• Rates of occurrence/use – for hospitalizations, doctor
visits, medication use, etc. – are assumed to remain
unchanged from their last observed values; and
• The per unit cost of these treatments/services is
assumed to remain unchanged from the EBIC values
inflated to 2005 dollars using appropriate health price
weights obtained from Statistics Canada and contained
in the Model. All costs in the Model are in 2005
dollars.
These assumptions could well be conservative and lead
the Model to understate the prevalence and cost of
diabetes in the future, rather than to overstate it.
Sensitivity and scenario analysis
The Model supports analysis of the sensitivity of the
prevalence and cost estimates to changes in national
demographic data, incidence and mortality rates by
age and sex, and the average annual number of net
general practitioner and specialist visits by people with
diabetes. Future enhancements could expand the variety
of analysis possible with the Model. In particular, the
Model could be used to determine, where efficacy data
exists, the financial cost-benefit of initiatives designed
to delay or prevent the onset of type 2 diabetes and to
reduce the occurrence and severity of complications
arising from the disease for persons with diabetes.
Areas for future research and
development
In order to remain relevant, the Model should be updated
to include revisions to NDSS data and other data.
The Model should also be updated to reflect expected
improvements and methodological revisions in the EBIC
data. Finally, the development of specific provincial
models would allow for even broader applications
to assess the cost effectiveness of potential diabetes
interventions, programs and services that could aid
governments in developing future diabetes strategies.
These models would likely incorporate a combination of
national and province-specific data due to data limitations
at the provincial level.
10 |
An economic tsunami: the cost of diabetes in Canada | 11
Diabetes in Canada: cause for alarm
Diabetes is a global pandemic. Where 30 million people lived with diabetes in 1980, it is
anticipated that more than 400 million people world-wide will have the disease by 2030.
10
According to the Canadian Diabetes Cost Model, the
number of people diagnosed with diabetes in Canada is
expected to nearly double between 2000 and 2010, from
1.3 million to about 2.5 million. More than 20 people
are diagnosed with the disease every hour of every day.
While the number of Canadians diagnosed with diabetes
is large, it is estimated that an additional 700,000 people
have the disease but don’t know it.
9
Figure 3
Factors Driving the Increase in Prevalence
from 2010 to 2020
FIG 3
Current Demographic
Structure 68%
1.2 million new
people living
with diabetes
projected (48% rise)
Population
Increase 9%
Population
Aging 13%
Rising
Incidence Rates
10%
Source: Canadian Diabetes Cost Model
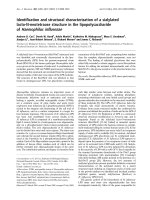
Third, the likelihood of developing diabetes has risen
sharply over the last few years (as much as 1% per year
for nearly all age groups up to age 70 for both sexes).
12
Rising obesity rates, sedentary lifestyles and changes
in the ethnic mix of new immigrants have driven these
increases. These factors are likely to remain, and even
intensify from 2010 to 2020. This report assumes a
0.75% annual increase in incidence rates for both men
and women for all age groups up to age 70 over the
next decade (a conservative assumption), and constant
mortality rates for all age groups. Rising incidence rates
account for about 10% of the increase in the number of
people with diabetes over the next decade (see Figure 3).
10. International Diabetes Federation.
IDF Diabetes Atlas.
(4th ed). Brussels,
Belgium: International Diabetes Federation; 2009. Available at www.
diabetesatlas.org.
11. The Conference Board of Canada.
How Canada Performs: A Report Card
on Canada (Health).
Available at www.conferenceboard.ca/HCP/Details/
Health/mortality-diabetes.aspx#rates.
12. Public Health Agency of Canada.
Diabetes in Canada – Facts and Figures.
National Diabetes Fact Sheets, Canada 2008. Available at www.phac-aspc.
gc.ca/publicat/2008/ndfs-fnrd-08/index-eng.php.
The increased prevalence of diabetes is indeed dramatic.
Canada now has the third-highest rate of mortality due
to diabetes among its peer countries, and the mortality
rate from diabetes has risen steadily since the 1980s.
11
What are the demographic
forces driving the increase?
First, an increase in the population over the period,
not surprisingly, is in part responsible. Statistics
Canada’s medium growth population projection calls
for the population to rise 8% over the period, and this
is responsible for 9% of the increase in the number of
people with diabetes over the next decade.
Second, Canada’s population will continue to age
over the same period. Since the incidence of diabetes
increases with age (see Figure 2), this factor will escalate
the number of people with diabetes and accounts for
13% of the increase over the next decade.
Figure 2
Incidence Rates for Males and Females in 2010
1
to
19
20
to
24
25
to
29
30
to
34
35
to
39
40
to
44
45
to
49
50
to
54
55
to
59
60
to
64
65
to
69
70
to
74
75
to
79
80
to
84
>
=
85
0
5
10
15
20
25
Males Females
Rate Per Thousand
FIG 2
Source: Canadian Diabetes Cost Model
[ More than 20 people
are diagnosed with the
disease every hour of
every day. ]
From 2010 to 2020, the number of people with diabetes
is expected to rise by another 1.2 million, bringing the
total to about 3.7 million. These increases escalate the
proportion of the total population with diabetes from
4.2% in 2000 to 7.3% in 2010 and to 9.9% by 2020 (see
Figure 1).
Figure 1
Diabetes in Canada: 2000 to 2020
Millions of Patients
Prevalence Rate
People with diabetes (left axis)
0.0
2000 2010 2020
1.0
2.0
3.0
4.0
2.0%
4.0%
6.0%
8.0%
10.0%
Share of the population (right axis)
Source: Canadian Diabetes Cost Model
12 |
An economic tsunami: the cost of diabetes in Canada | 13
The economic burden of diabetes
People with diabetes incur medical costs that are up to three times higher than those without
diabetes. A person with diabetes can face direct costs for medication and diabetes supplies
ranging from $1,000 to $15,000 per year.
13
To help determine the overall cost to society,
Health Canada has published a number of reports examining the economic burden of illness
in Canada. Its methodology considers both direct and indirect costs of illness:
• Direct costs include all costs for which payment
was made and resources were used in the treatment,
care and rehabilitation of an illness or injury. These
costs include hospital and institutional care, primary
(general and specialist) care and medication.
• Indirect costs include the value of economic output
lost due to illness, injury-related work disability or
premature death.
The Canadian Diabetes Cost Model uses this same
methodology to determine the current and future
economic burden of diabetes in Canada.
Figure 4
Cost of Diabetes in Canada: 2000 to 2020
Billions of 2005 Dollars
0
2
4
6
8
10
12
14
16
18
Direct costs Indirect costs
FIG 4
2000
$5.2
$1.1
$2.1
$10.1
$3.1
$13.8
2010 2020
Source: Canadian Diabetes Cost Model
Figure 5
Economic Cost of Diabetes in Canada by Source in 2010
FIG 5
Direct Hospitalization 8%
Net Mortality 67%
Long-Term Disability 16%
Projected total cost in 2010:
$12.2 billion in 2005 dollars
Net CVD Hospitalization 1%
Net Doctor Visits: General Practioner 2%
Net Doctor Visits: S
p
ecialist 2%Dru
g
s/Medications for Diabetes 4%
Source: Canadian Diabetes Cost Model
The distribution of direct and indirect costs of the
economic burden of diabetes is shown in Figure 5. The
cost associated with premature death accounts for about
two-thirds of total costs expected in 2010. Direct costs
represent about 17% of the total, with hospitalization
costs accounting for over half of that share.
The demographic forces driving the increase in the
number of people with diabetes between 2010 and 2020
yield a similar distribution for each factor with respect
to the economic burden of diabetes. The increase in the
population accounts for 11% of the increase in costs,
population aging for 8% and higher incidence rates for
14%, while the current demographic structure accounts
for 67% of the increase in costs (see Figure 6).
14. Harris SB, Ekoé JM, Zdanowicz Y, et al. Glycemic control and morbidity
in the Canadian primary care setting (results of the diabetes in Canada
evaluation study).
Diabetes Research and Clinical Practice.
2005;70(1):90-97.
15. Public Health Agency of Canada.
Diabetes in Canada – Facts and Figures.
National Diabetes Fact Sheets, Canada 2008. Available at www.phac-aspc.
gc.ca/publicat/2008/ndfs-fnrd-08/index-eng.php.
13. Canadian Diabetes Association.
The Prevalence and Costs of Diabetes.
Available at www.diabetes.ca/about-diabetes/what/prevalence/.
Figure 4 shows that the economic burden of diabetes in
Canada is expected to be approximately $12.2 billion in
2010 (measured in 2005 dollars). This is an increase of
$5.9 billion, or nearly double the level in 2000. The cost
of the disease is expected to rise by another $4.7 billion
by 2020. The direct cost of diabetes now accounts for
about 3.5% of public healthcare spending in Canada;
this share is likely to continue rising given the expected
increase in the number of people with diabetes in
Canada.
The direct costs estimated by the Canadian Diabetes
Cost Model include:
14,15
• Direct hospitalization costs (including amputation,
dialysis, etc.);
• CVD-related hospitalization costs;
• General practitioner costs;
• Specialist costs; and
• Diabetes medication costs.
The indirect costs estimated by the Model represent the
loss of economic output from the impact of diabetes on
society, and include:
14,15
• Mortality costs: the value, in terms of lost production,
of premature death as a result of both type 1 and type
2 diabetes; and
• Long-term disability costs: the value, in terms of lost
production, of reduced productivity and time away
from work that can be attributed to diabetes.
Figure 6
FIG 6
Factors Driving the Increase in the
Cost of Diabetes from 2010 to 2020
Current Demographic
Structure 67%
Pro
j
ected cost increase of $4.7 billion in 2005 dollars
(
39% rise
)
Population
Increase 11%
Population
Aging 8%
Rising
Incidence Rates
14%
Source: Canadian Diabetes Cost Model
Figure 7
Average Annual Inflation-Adjusted Growth in the
Cost of Diabetes in Canada between 2010 and 2020
Total
Long-Term Disability
Net Mortality
Drugs/Medications for Diabetes
Net Doctor Visits: Specialist
Net Doctor Visits: General Practioner
Net CVD Hospitalization
Direct Hospitalization
0.0% 0.5% 1.0% 1.5% 2.0% 2.5% 3.0% 3.5% 4.0% 4.5%
FIG 7
Source: Canadian Diabetes Cost Model
The average inflation-adjusted cost of diabetes in Canada
is expected to rise 3.3% per year between 2010 and 2020
(see Figure 7). Direct costs – such as hospitalization
for CVD and primary care visits – are expected to rise
the fastest, by 4.3% and 3.9%, respectively. These cost
increases will severely tax the healthcare system over the
next decade.
14 |
An economic tsunami: the cost of diabetes in Canada | 15
This rise in spending is a result of significant increases in
the amount of time spent in hospitals, visits to doctors’
offices and medical procedures such as amputations.
In 2005, one in ten hospital admissions was due to the
treatment of diabetes and its complications.
16
Figure 8
shows that the number of days spent by people living
with diabetes in hospital is expected to rise from 1.9
million in 2000 to 3.6 million in 2010 to 5.4 million by
2020.
Figure 8
Source: Canadian Diabetes Cost Model
16. Hux JE, Booth GL, Slaughter PM, et al, eds.
Diabetes in Ontario. An ICES
Practice Atlas.
Toronto, ON: Institute for Clinical Evaluative Sciences; 2003.
17. Canadian Diabetes Association Clinical Practice Guidelines Expert
Committee. Canadian Diabetes Association 2008 Clinical Practice
Guidelines for the Prevention and Management of Diabetes in Canada.
Canadian Journal of Diabetes.
2008;32(supplement 1):S1-S201.
18. Public Health Agency of Canada.
Report from the National Diabetes
Surveillance System: Diabetes in Canada,
2008. Available at www.phac-
aspc.gc.ca.
19. Gaede P, Lund-Andersen H, Parving HH, Pedersen O.
Effect of a
multifactorial intervention on mortality in type 2 diabetes.
N Engl J Med.
2008 Feb 7;358(6):580-91.
20. Canadian Diabetes Association Clinical Practice Guidelines Expert
Committee. Canadian Diabetes Association 2008 Clinical Practice
Guidelines for the Prevention and Management of Diabetes in Canada.
Canadian Journal of Diabetes.
2008;32(supplement 1):S1-S201.
21. Ékoé J, Aras M, Markon P, et al.
Insight Into Canadians Living With Type
2 Diabetes: A Survey Of Patients And Physicians.
Presentation from
the 2008 Canadian Cardiovascular Society annual meeting; Montréal,
Québec.
22. Diabetes Task Force.
Report to the Ministry of Health and Long-Term
Care.
Toronto, ON: 2004.
Action on diabetes: an ounce of prevention
Diabetes is a personal crisis for people living with the disease, and for their family. Diabetes
is also causing a financial crisis for our healthcare system. Treatment of the disease and its
related complications are consuming an ever-larger share of healthcare budgets, and will
soon force a tremendous increase in those budgets. Both personal and policy changes are
needed.
Currently, there is no known way to prevent type 1
diabetes. Therefore, investments need to be made in
access to health services, education, research, and
supplies and devices that will assist those with type 1
diabetes manage their disease effectively. While there is
a genetic predisposition for diabetes, it is estimated that
more than 50% of type 2 diabetes cases could be delayed
– or even prevented – with healthier eating and increased
physical activity.
17
Weight loss of 5% to 10% of initial
body weight – approximately 4.5 to 9.0 kg for a 90-kg
person – has been shown to significantly reduce the risk
of diabetes.
18
For those with diabetes, achieving the optimal blood
glucose, cholesterol and blood pressure targets
recommended by the Canadian Diabetes Association’s
2008 Clinical Practice Guidelines will help avoid or
delay diabetes complications. Intensive multi-factorial
intervention to improve blood pressure, cholesterol
and glycemic control can reduce cardiovascular events
by 60% and mortality by 56% in patients with type 2
diabetes.
19
Moreover, weight loss of 5% to 10% of initial
body weight in people with diabetes can substantially
improve insulin sensitivity, glycemic control, blood
pressure, and cholesterol levels.
20
Unfortunately, fewer than half of Canadians with type 2
diabetes are at the recommended A1C target – more than
half do not know what their recommended target level
should be.
21
Fewer than half of all people with type 2
diabetes are regularly tested for A1C, blood pressure and
cholesterol levels, or kidney function. Surveys indicate
that people with diabetes receive too little education and
too little support.
22
Visits to general practitioners will rise from 5 million
in 2000 to more than 14 million by 2020, while visits
to specialists will rise from 3.2 million in 2000 to
9.1 million by 2020. Furthermore, the number of
amputations is expected to rise from 210,000 in 2000
to 630,000 in 2020. These activities will require a
significant addition to the capacity of the healthcare
system in this country, resulting in higher costs for
governments and taxpayers.
Net Hospitalization Volume in Days: 2000 to 2020
Millions of Days
0.0
1.0
2.0
3.0
4.0
5.0
6.0
2000 2020
Net General Practioner Visits: 2000 to 2020
Millions of Visits
0.0
2.0
4.0
6.0
8.0
10.0
12.0
14.0
16.0
2000 2020
2010
Net People with Diabetes Hospitalized
due to Amputation: 2000 to 2020
Millions of Procedures
0.00
0.10
0.20
0.30
0.40
0.50
0.60
0.70
2000 2020
20102010
Net Specialist Visits: 2000 to 2020
Millions of Visits
0.0
2.0
4.0
6.0
8.0
10.0
2000 2010 2020
16 |
An economic tsunami: the cost of diabetes in Canada | 17
Reducing the prevalence of diabetes in Canada will take
time and happen very gradually. It will require broad-
based personal and societal change. The Canadian
Diabetes Cost Model was used to estimate the impact of
an effective campaign to:
(i) Reduce the number of people developing diabetes
over the next decade; and
(ii) Reduce the number of complications arising from the
disease and decrease the number of patient visits to
family doctors and specialists.
Figure 9
Diabetes Prevention Impact
Millions of People
0.0
0.5
1.0
1.5
2.0
2.5
3.0
3.5
4.0
Status Quo Prevention Strategy
FIG 9
People with diabetes in 2020
$3.1
Net Increase in People
with diabetes 2010-2020
190,000 (16%) fewer diabetes
patients over the next decade
Source: Canadian Diabetes Cost Model
Figure 10
Diabetes Prevention Impact on Prevalence Rates in 2020
Diabetes Patients per 1,000 People
91
92
93
94
95
96
97
98
99
100
FIG 10
Status Quo Prevention Strate
gy
Source: Canadian Diabetes Cost Model
In this estimate, the incidence rate of new cases is
assumed to fall 2% per year relative to the incidence
rates used in the previous section and, reflecting better
health outcomes, the number of annual visits per patient
to family doctors and specialists is assumed to fall 0.5%
per year. While these assumptions are arbitrary, they
demonstrate the benefits of robust, positive action to
reduce the personal and societal burden of diabetes.
Positive action to reduce the number of complications
would also affect hospitalization rates, amputation rates,
medication use, etc. The Canadian Diabetes Cost Model
does not have the capability to simulate direct changes in
the demand for these services and treatments, although
it is an enhancement that is expected in the next version
of the Model.
Figure 11
Diabetes Prevention Impact on Costs in 2020
Billions of 2005 Dollars
0.0
2.0
4.0
6.0
8.0
10.0
12.0
14.0
16.0
Status Quo Prevention Strategy
FIG 11
Direct Costs in 2020 Indirect Costs in 2020
Direct costs fall $0.3 billion by 2020 (9%)
Indirect costs fall $1.0 billion by 2020 (7%)
$3.1
$2.8
$13.8
$12.9
Source: Canadian Diabetes Cost Model
Figure 12
Diabetes Prevention Impact on Doctor Visits in 2020
Millions of Visits
0.0
2.0
4.0
6.0
8.0
10.0
12.0
14.0
16.0
Status Quo Prevention Strategy
FIG 12
Net General Practioner Visits in 2020
$3.1
Net Specialist Visits in 2020
General pactioner visits fall by 2.7 million by 2020 (19%)
Specialist visits fall 1.6 million by 2020 (18%)
Source: Canadian Diabetes Cost Model
Figure 9 shows the impact of this program in reducing
the number of people with diabetes in 2020 to 3.5
million from 3.7 million in the current forecast. Despite
a 16% drop in the number of new diagnoses of diabetes
over the decade, the overall number of people with the
disease still rises by about 1.0 million people.
The prevalence of the disease falls from more than 99
cases per 1,000 to about 94 cases per 1,000 in 2020. This
is still significantly higher than the 73 per 1,000 cases
expected in 2010 (see Figure 10). There is no quick
solution. Reducing the number of people with diabetes
in Canada will require long-term planning and action.
While the lack of dramatic progress in eliminating
the disease may be discouraging, these efforts make a
difference to the cost of diabetes. Direct costs in 2020 are
9% below what would be expected without taking action
(see Figure 11). This reduction will make it easier for
governments to ensure that healthcare spending keeps
up with the increased demand.
The larger percentage decline in direct costs relative to
indirect costs is driven by the assumption that improved
education and healthcare management could reduce the
number of times that patients need to visit their family
doctor or a specialist each year (i.e. better management
leads to fewer medical crises). Figure 12 shows that
visits to general practitioners and specialists fall 19% and
18%, respectively, by 2020.
18 |
Next steps
The Canadian Diabetes Cost Model and its potential
The Model is based on the data that existed at the time it was developed. In order to remain
relevant, the Model must be updated routinely to take into account new and revised data
and other considerations, including:
• The approach to forecasting the prevalence of diabetes
generally replicates the NDSS forecasting methodology
at the national level. The initial revisions and updates to
the Model will focus on the inclusion of revised NDSS
data;
• The economic costs are extrapolated from the 2000
EBIC data, which is currently being updated. Extensions
to the standard EBIC approach include:
– The recognition of co-morbidities such as
cardiovascular disease; and
– The use of all-cause mortality rates to highlight the
higher risks of death experienced by people with
diabetes due to co-morbid conditions.
• Over the course of the next year, it will be necessary
to incorporate data improvements and methodological
revisions that are expected in the EBIC data, as well as a
change in the base year of analysis from 2000 to a more
recent year; and
• Revised population forecasts that incorporate the most
recent census estimates will soon be available. This will
affect the demographic structure to a modest extent.
This Report highlights the serious burden of diabetes in
Canada. The bearers of this burden go well beyond those
directly affected by the disease itself. All Canadians, due
to the direct and indirect cost of diabetes, pay the price.
While the Model provides a more comprehensive picture
of the economic impact of diabetes on Canadian society, it
has the potential to accomplish much more. The Model’s
potential includes:
• The development of specific costing estimates of the
burden of diabetes at the community, regional and
provincial levels;
• More sophisticated impact studies incorporating
detailed assumptions from epidemiological models to
assess the cost effectiveness of diabetes intervention
and prevention strategies; and
• A detailed treatment of co-morbidities and associated
health status impacts with complex linkages to costs.
The Canadian Diabetes Association will be exploring
these and other ways the Model can assist the
Association and governments in more effectively
developing diabetes policies and strategies. However,
while the use of this Model can be further explored, it
should not stop governments from taking action today.
The Canadian Diabetes Association is already working to
address the economic burden of diabetes in Canada by:
• Focusing our efforts and resources on the needs of
people living with diabetes or prediabetes;
• Providing people with diabetes and healthcare
professionals with education and services;
• Advocating on behalf of people living with diabetes;
• Supporting diabetes research; and
• Translating research into practical applications for
both healthcare providers and people living with
diabetes.
The need for action
While the Canadian Diabetes Association is leading the fight against diabetes by helping
people with diabetes live healthy lives as it works to find a cure, we cannot do it alone.
Governments must recognize this growing burden and take immediate action.
An economic tsunami: the cost of diabetes in Canada | 19
That action should include, but not be limited to, the
following:
1. Canadian Diabetes Strategy
and Aboriginal Diabetes Initiative
The Canadian Diabetes Strategy requires significant
enhancements and the current Aboriginal Diabetes
Initiative is due to expire in 2010. The federal
government must renew and significantly enhance these
two strategies with a focus on:
• Increasing investment levels for both the Canadian
Diabetes Strategy and the Aboriginal Diabetes
Initiative;
• Establishing an arms-length partnership body with
clear annual and multi-year targets in a number of
clearly defined areas;
• Establishing programs and services for those living
with diabetes and prediabetes;
• Translating research into practical applications for
managing diabetes for both healthcare professionals
and people living with diabetes; and
• Meeting the specific and cultural needs of populations
at risk.
2. An enhanced tax strategy for
Canadians living with diabetes
The out-of-pocket costs associated with diabetes are
perceived as a major barrier to those living with diabetes
in effectively managing their disease. In fact, 57% of
Canadians living with diabetes say they do not comply
with their prescribed therapy due to cost and lack of
access to medications, devices, supplies, and health
providers. This leads to higher hospitalization rates,
increased healthcare system costs and even more serious
co-morbidities and complications.
Action is needed to ensure that people living with
diabetes can afford to manage their disease. The federal
government is urged to take action to address the cost
and access to medications, devices and supplies through
increased tax credits, medical expense deductions and
other forms of income support.
20 |
3. Increased investment in
high-quality, investigator-driven research
Insulin was discovered in Canada and the Canadian
Diabetes Association’s funding continues to ensure that
Canadian researchers remain at the forefront of diabetes
breakthroughs. Since 1975, the Association has invested
more than $95 million to support excellence in diabetes
research in Canadian universities, institutions and
hospitals.
The United States recently invested $21.5 billion in
research and development. Canada needs a comparable
commitment to investment in research to preserve and
build on the accomplishments that previous investments
in research have achieved.
Public sector investment in diabetes prevention will
reduce both direct healthcare costs and the cost to the
economy from reduced production. A recent report
determined that the long-term receipt of appropriate
clinical procedures by patients with type 2 diabetes may
result in the avoidance of $4 in acute care cost for every
$1 in physician costs.
23
23. Krueger H.
The Benefits of Investing in Appropriate Diabetes Care.
Saarbrücken, Germany: VDM Verlag; 2008.
References
Canadian Diabetes Association, Diabetes Dictionary. Available at
www.diabetes.ca/about-diabetes/what/dictionary/.
Canadian Diabetes Association.
Prediabetes: The Chance to Change
the Future.
Available at www.diabetes.ca/about-diabetes/what/
prediabetes/.
Canadian Diabetes Association.
The Prevalence and Costs of Diabetes.
Available at www.diabetes.ca/about-diabetes/what/prevalence/.
Public Health Agency of Canada. National Diabetes Fact Sheet,
Canada 2007.
Canadian Diabetes Association Clinical Practice Guidelines Expert
Committee. Canadian Diabetes Association 2008 Clinical Practice
Guidelines for the Prevention and Management of Diabetes in
Canada.
Canadian Journal of Diabetes.
2008;32 (supplement
1):S1-S201.
The Conference Board of Canada.
How Canada Performs: A Report
Card on Canada (Health).
Available at www.conferenceboard.ca/HCP/
Details/Health/mortality-diabetes.aspx#rates.
Diabetes Task Force.
Report to the Ministry of Health and Long-Term
Care.
Toronto, ON; 2004.
Ékoé J, Aras M, Markon P, et al.
Insight Into Canadians Living With Type
2 Diabetes: A Survey Of Patients And Physicians.
Presentation from
the 2008 Canadian Cardiovascular Society annual meeting; Montréal,
Québec.
Harris SB, Ekoé JM, Zdanowicz Y, et al. Glycemic control and morbidity
in the Canadian primary care setting (results of the diabetes in
Canada evaluation study).
Diabetes Research and Clinical Practice.
2005;70(1):90-97.
Health Canada.
Economic Burden of Illness in Canada, 1998.
Ottawa,
ON: Health Canada; 2002. Available at www.hc-sc.gc.ca.
Hux JE, Booth GL, Slaughter PM, et al, eds.
Diabetes in Ontario. An
ICES Practice Atlas.
Toronto, ON: Institute for Clinical Evaluative
Sciences; 2003.
Informetrica Limited.
Economic Cost of Diabetes in Canada: An
Overview.
Toronto, ON: Canadian Diabetes Association; 2009.
International Diabetes Federation.
IDF Diabetes Atlas.
(4th ed).
Available at www.diabetesatlas.org.
Krueger H.
The Benets of Investing in Appropriate Diabetes Care.
Saarbrücken, Germany: VDM Verlag; 2008.
Heart/Stroke: ( />prevalence/): Source: Canadian Diabetes Association 2003 CPGs, pg.
58.
Kidney: (CIHI): ( />page=media_07feb2007_e ): Source: CORR Reports - Treatment
of End-Stage Organ Failure in Canada 1995 to 2004 (2006 Annual
Report) Date published: February 7, 2007.
Blindness: Source: Canadian Diabetes Association 2008 CPGs, pg. S2.
Amputation: ( />id=67&morg_id=0&gsec_id=0&item_id=1312&type=atlas); Sources:
ICES, Ontario Diabetes Atlas 2003.
Depression: (
Source: Canadian Diabetes Association 2008 CPGs, pg. S2.
Life Expectancy: (CDA) />costs.pdf.
Public Health Agency of Canada.
The Face of Diabetes in Canada.
Available at www.phac-aspc.gc.ca.
Public Health Agency of Canada.
Report from the National Diabetes
Surveillance System: Diabetes in Canada, 2008.
Available at www.
phac-aspc.gc.ca.
Gaede P, Lund-Andersen H, Parving HH, Pedersen O. Effect of a
multifactorial intervention on mortality in type 2 diabetes. N Engl J
Med. 2008 Feb 7;358(6):580-91.
[ The Canadian Diabetes
Association is already
working to address the
economic burden of
diabetes in Canada. ]
22 |
An economic tsunami: the cost of diabetes in Canada | 23
An economic tsunami
the cost of diabetes in Ca nada
December 2009
This initiative was supported by an unrestricted
educational grant provided by
We thank Novo Nordisk Canada Inc. for its ongoing
commitment to diabetes in Canada.
About the Canadian Diabetes Association
Across the country, the Canadian Diabetes Association is
leading the fight against diabetes by helping people with
diabetes live healthy lives while we work to find a cure.
We are supported in our efforts by a community-based
network of volunteers, employees, healthcare professionals,
researchers and partners. By providing education and
services, advocating on behalf of people with diabetes,
supporting research, and translating research into practical
applications – we are delivering on our mission.
1-800-BANTING (226-8464) diabetes.ca