Báo cáo khoa học: "From Single to Multi-document Summarization: A Prototype System and its Evaluation" pptx
Bạn đang xem bản rút gọn của tài liệu. Xem và tải ngay bản đầy đủ của tài liệu tại đây (56.78 KB, 8 trang )
From Single to Multi-document Summarization:
A Prototype System and its Evaluation
Chin-Yew Lin and Eduard Hovy
University of Southern California / Information Sciences Institute
4676 Admiralty Way
Marina del Rey, CA 90292
{cyl,hovy}@isi.edu
Abstract
NeATS is a multi-document
summarization system that attempts
to extract relevant or interesting
portions from a set of documents
about some topic and present them
in coherent order. NeATS is among
the best performers in the large scale
summarization evaluation DUC
2001.
1 Introduction
In recent years, text summarization has been
enjoying a period of revival. Two workshops
on Automatic Summarization were held in
2000 and 2001. However, the area is still
being fleshed out: most past efforts have
focused only on single-document
summarization (Mani 2000), and no standard
test sets and large scale evaluations have been
reported or made available to the English-
speaking research community except the
TIPSTER SUMMAC Text Summarization
evaluation (Mani et al. 1998).
To address these issues, the Document
Understanding Conference (DUC) sponsored
by the National Institute of Standards and
Technology (NIST) started in 2001 in the
United States. The Text Summarization
Challenge (TSC) task under the NTCIR (NII-
NACSIS Test Collection for IR Systems)
project started in 2000 in Japan. DUC and
TSC both aim to compile standard training and
test collections that can be shared among
researchers and to provide common and large
scale evaluations in single and multiple
document summarization for their participants.
In this paper we describe a multi-document
summarization system NeATS. It attempts to
extract relevant or interesting portions from a
set of documents about some topic and present
them in coherent order. We outline the
NeATS system and describe how it performs
content selection, filtering, and presentation in
Section 2. Section 3 gives a brief overview of
the evaluation procedure used in DUC-2001
(DUC 2001). Section 4 discusses evaluation
metrics, and Section 5 the results. We
conclude with future directions.
2 NeATS
NeATS is an extraction-based multi-document
summarization system. It leverages techniques
proved effective in single document
summarization such as: term frequency (Luhn
1969), sentence position (Lin and Hovy 1997),
stigma words (Edmundson 1969), and a
simplified version of MMR (Goldstein et al.
1999) to select and filter content. To improve
topic coverage and readability, it uses term
clustering, a ‘buddy system’ of paired
sentences, and explicit time annotation.
Most of the techniques adopted by NeATS are
not new. However, applying them in the
proper places to summarize multiple
documents and evaluating the results on large
scale common tasks are new.
Given an input of a collection of sets of
newspaper articles, NeATS generates
summaries in three stages: content selection,
filtering, and presentation. We describe each
stage in the following sections.
2.1 Content Selection
The goal of content selection is to identify
important concepts mentioned in a document
collection. For example, AA flight 11, AA
flight 77, UA flight 173, UA flight 93, New
York, World Trade Center, Twin Towers,
Osama bin Laden, and al-Qaida are key
concepts for a document collection about the
September 11 terrorist attacks in the US.
Computational Linguistics (ACL), Philadelphia, July 2002, pp. 457-464.
Proceedings of the 40th Annual Meeting of the Association for
In a key step for locating important sentences,
NeATS computes the likelihood ratio λ
(Dunning, 1993) to identify key concepts in
unigrams, bigrams, and trigrams
1
, using the
on- topic document collection as the relevant
set and the off-topic document collection as the
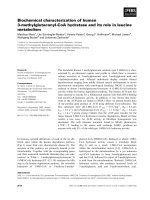
irrelevant set. Figure 1 shows the top 5
concepts with their relevancy scores (-2λ) for
the topic “Slovenia Secession from
Yugoslavia” in the DUC-2001 test collection.
This is similar to the idea of topic signature
introduced in (Lin and Hovy 2000).
With the individual key concepts available, we
proceed to cluster these concepts in order to
identify major subtopics within the main topic.
Clusters are formed through strict lexical
connection. For example, Milan and Kucan
are grouped as “Milan Kucan” since “Milan
Kucan” is a key bigram concept; while
Croatia, Yugoslavia, Slovenia, republic, and
are joined due to the connections as follows:
• Slovenia Croatia
• Croatia Slovenia
• Yugoslavia Slovenia
• republic Slovenia
1
Closed class words (of, in, and, are, and so on)
were ignored in constructing unigrams, bigrams and
trigrams.
• Croatia republic
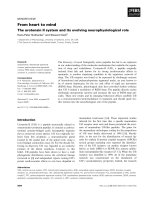
Each sentence in the document set is then
ranked, using the key concept structures. An
example is shown in Figure 2. The ranking
algorithm rewards most specific concepts first;
for example, a sentence containing “Milan
Kucan” has a higher score than a sentence
contains only either Milan or Kucan. A
sentence containing both Milan and Kucan but
not in consecutive order gets a lower score too.
This ranking algorithm performs relatively
well, but it also results in many ties.
Therefore, it is necessary to apply some
filtering mechanism to maintain a reasonably
sized sentence pool for final presentation.
2.2 Content Filtering
NeATS uses three different filters: sentence
position, stigma words, and maximum
marginal relevancy.
2.2.1 Sentence Position
Sentence position has been used as a good
important content filter since the late 60s
(Edmundson 1969). It was also used as a
baseline in a preliminary multi-document
summarization study by Marcu and Gerber
(2001) with relatively good results. We apply
a simple sentence filter that only retains the
lead 10 sentences.
2.2.2 Stigma Words
Some sentences start with
• conjunctions (e.g., but, although, however),
• the verb say and its derivatives,
• quotation marks,
• pronouns such as he, she, and they,
and usually cause discontinuity in summaries.
Since we do not use discourse level selection
criteria à la (Marcu 1999), we simply reduce
the scores of these sentences to avoid including
them in short summaries.
2.2.3 Maximum Marginal Relevancy
Figure
2
.
Top 5 unigram, bigram, and trigram concepts for topic "Slovenia Secession from Yugoslavia".
Rank Unigram
(-2
λ
)
Bigram
(-2
λ
)
Trigram
(-2
λ
)
1 Slovenia 319.48 federal army 21.27 Slovenia central bank 5.80
2 Yugoslavia 159.55 Slovenia Croatia 19.33 minister foreign affairs 5.80
3 Slovene 87.27 Milan Kucan 17.40 unallocated federal debt 5.80
4 Croatia 79.48 European Community 13.53 Drnovsek prime minister 3.86
5 Slovenian 67.82 foreign exchange 13.53 European Community countries 3.86
Figure
1
.
Sample key concept structure.
n1
(:S URF " WEBCL -SUMM MARIZ ER-KU CAN"
:C AT S- NP
:C LASS I-EN- WEBCL -SIGN ATURE -KUCAN
:L EX 0 .6363 63636 36363 6
:S UBS
( ((KUC AN-0)
(:S URF " Milan Ku can"
:C AT S- NP
:C LASS I-EN- WEBCL -SIGN ATURE -KUCAN
:L EX 0. 63636 36363 63636
:S UBS
((( KUCAN -1)
(:S URF " Ku can"
:C AT S- NP
:C LASS I-EN- WEBCL -SIGN ATURE -KUCAN
:L EX 0. 63636 36363 63636 ))
(( KUCAN -2)
(:S URF " Milan "
:C AT S- NP
:C LASS I-EN- WEBCL -SIGN ATURE -KUCAN
:L EX 0. 63636 36363 63636 ))))) ))
The content selection and filtering methods
described in the previous section only concern
individual sentences. They do not consider the
redundancy issue when two top ranked
sentences refer to similar things. To address
the problem, we use a simplified version of
CMU’s MMR (Goldstein et al. 1999)
algorithm. A sentence is added to the
summary if and only if its content has less than
X percent overlap with the summary. The
overlap ratio is computed using simple
stemmed word overlap and the threshold X is
set empirically.
2.3 Content Presentation
NeATS so far only considers features
pertaining to individual sentences. As we
mentioned in Section 2.2.2, we can demote
some sentences containing stigma words to
improve the cohesion and coherence of
summaries. However, we still face two
problems: definite noun phrases and events
spread along an extended timeline. We
describe these problems and our solutions in
the following sections.
2.3.1 A Buddy System of Paired Sentences
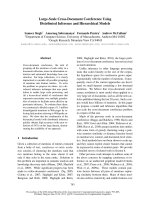
The problem of definite noun phrases can be
illustrated in Figure 3. These sentences are
from documents of the DUC-2001 topic US
Drought of 1988. According to pure sentence
scores, sentence 3 of document AP891210-
0079 has a higher score (34.60) than sentence
1 (32.20) and should be included in the shorter
summary (size=“50”). However, if we select
sentence 3 without also including sentence 1,
the definite noun phrase “The record $3.9
billion drought relief program of 1988” seems
to come without any context. To remedy this
problem, we introduce a buddy system to
improve cohesion and coherence. Each
sentence is paired with a suitable introductory
sentence unless it is already an introductory
sentence. In DUC-2001 we simply used the
first sentence of its document. This assumes
lead sentences provide introduction and
context information about what is coming next.
2.3.2 Time Annotation and Sequence
One main problem in multi-document
summarization is that documents in a
collection might span an extended time period.
For example, the DUC-2001 topic “Slovenia
Secession from Yugoslavia” contains 11
documents dated from 1988 to 1994, from 5
different sources
2
. Although a source
document for single-document summarization
might contain information collected across an
extended time frame and from multiple
sources, the author at least would synchronize
them and present them in a coherent order. In
multi-document summarization, a date
expression such as Monday occurring in two
different documents might mean the same date
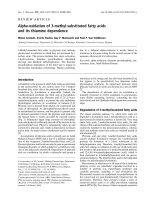
or different dates. For example, sentences in
the 100 word summary shown in Figure 4
come from 3 main time periods, 1990, 1991,
and 1994. If no absolute time references are
given, the summary might mislead the reader
to think that all the events mentioned in the
four summary sentences occurred in a single
week. Therefore, time disambiguation and
normalization are very important in multi-
document summarization. As the first attempt,
we use publication dates as reference points
and compute actual dates for the following
date expressions:
• weekdays (Sunday, Monday, etc);
• (past | next | coming) + weekdays;
• today, yesterday, last night.
We then order the summary sentences in their
chronological order. Figure 4 shows an
2
Sources include Associated Press, Foreign
Broadcast Information Service, Financial Times,
San Jose Mercury News, and Wall Street Journal.
<multi size="50" docset="d50i">
AP891210-0079 1 (32.20
) (12/10/89) America's 1988 drought captured attention everywhere, but especially in
Washington where politicians pushed through the largest disaster relief measure in U.S. history.
AP891213-0004 1 (34.60) (12/13/89) The drought of 1988 hit …
</multi>
<multi size="100" docset="d50i">
AP891210-0079 1 (32.20
) (12/10/89) America's 1988 drought captured attention everywhere, but especially in
Washington where politicians pushed through the largest disaster relief measure in U.S. history.
AP891210-0079 3 (41.18) (12/10/89) The record $3.9 billion drought relief program of 1988, hailed as
salvation for small farmers devastated by a brutal dry spell, became much more _ an unexpected, election-
year windfall for thousands of farmers who collected millions of dollars for nature's normal quirks.
AP891213-0004 1 (34.60) (12/13/89) The drought of 1988 hit …
</multi>
Figure
3
.
50 and 100 word summaries for topic "US Drought of 1988".
example 100 words summary with time
annotations. Each sentence is marked with its
publication date and a reference date
(MM/DD/YY) is inserted after every date
expression.
3 DUC 2001
Before we present our results, we describe the
corpus and evaluation procedures of the
Document Understanding Conference 2001
(DUC 2001).
DUC is a new evaluation series supported by
NIST under TIDES, to further progress in
summarization and enable researchers to
participate in large-scale experiments. There
were three tasks in 2001:
(1) Fully automatic summarization of a single
document.
(2) Fully automatic summarization of multiple
documents: given a set of document on a
single subject, participants were required to
create 4 generic summaries of the entire set
with approximately 50, 100, 200, and 400
words. 30 document sets of approximately 10
documents each were provided with their 50,
100, 200, and 400 human written summaries
for training (training set) and another 30
unseen sets were used for testing (test set).
(3) Exploratory summarization: participants
were encouraged to investigate alternative
approaches in summarization and report their
results.
NeATS participated only in the fully automatic
multi-document summarization task. A total
of 12 systems participated in that task.
The training data were distributed in early
March of 2001 and the test data were
distributed in mid-June of 2001. Results were
submitted to NIST for evaluation by July 1
st
.
3.1 Evaluation Procedures
NIST assessors who created the ‘ideal’ written
summaries did pairwise comparisons of their
summaries to the system-generated summaries,
other assessors’ summaries, and baseline
summaries. In addition, two baseline
summaries were created automatically as
reference points. The first baseline, lead
baseline, took the first 50, 100, 200, and 400
words in the last document in the collection.
The second baseline, coverage baseline, took
the first sentence in the first document, the first
sentence in the second document and so on
until it had a summary of 50, 100, 200, or 400
words.
3.2 Summary Evaluation
Environment
NIST used the Summary Evaluation
Environment (SEE) 2.0 developed by one of
the authors (Lin 2001) to support its human
evaluation process. Using SEE, the assessors
evaluated the quality of the system’s text (the
peer text) as compared to an ideal (the model
text). The two texts were broken into lists of
units and displayed in separate windows. In
DUC-2001 the sentence was used as the
smallest unit of evaluation.
SEE 2.0 provides interfaces for assessors to
judge the quality of summaries in
grammatically
3
, cohesion
4
, and coherence
5
at
five different levels: all, most, some, hardly
any, or none. It also allows assessors to step
through each model unit, mark all system units
sharing content with the current model unit,
and specify that the marked system units
3
Does a summary follow the rule of English
grammatical rules independent of its content?
4
Do sentences in a summary fit in with their
surrounding sentences?
5
Is the content of a summary expressed and
organized in an effectiv e way?
Figure
4
.
100 word summary with explicit time annotation.
<multi size="100" docset="d45h">
AP900625-0160 1 (26.60) (06/25/90) The republic of Slovenia plans to begin work on a constitution
that will give it full sovereignty within a new Yugoslav confederation, the state Tanjug news agency
reported Monday (06/25/90).
WSJ910628-0109 3 (9.48) (06/28/91) On Wednesday (06/26/91), the Slovene soldiers manning this border
post raised a new flag to mark Slovenia's independence from Yugoslavia.
WSJ910628-0109 5 (53.77) (06/28/91) Less than two days after Slovenia and C
roatia, two of Yugoslavia's
six republics, unilaterally seceded from the nation, the federal government in Belgrade mobilized
troops to regain control.
FBIS3-30788 2 (49.14) (02/09/94) In the view of Yugoslav diplomats, the normalization of relations
between Slovenia and the Federal Republic of Yugoslavia will certainly be a strenuous and long-term
project.
</multi>
express all, most, some or hardly any of the
content of the current model unit.
4 Evaluation Metrics
One goal of DUC-2001 was to debug the
evaluation procedures and identify stable
metrics that could serve as common reference
points. NIST did not define any official
performance metric in DUC-2001. It released
the raw evaluation results to DUC-2001
participants and encouraged them to propose
metrics that would help progress the field.
4.1.1 Recall, Coverage, Retention and
Weighted Retention
Recall at different compression ratios has been
used in summarization research (Mani 2001) to
measure how well an automatic system retains
important content of original documents.
Assume we have a system summary S
s
and a
model summary S
m
. The number of sentences
occurring in both S
s
and S
m
is N
a
, the number
of sentences in S
s
is N
s
, and the number of
sentences in S
m
is N
m
. Recall is defined as
N
a
/N
m
. The Compression Ratio is defined as
the length of a summary (by words or
sentences) divided by the length of its original
document. DUC-2001 set the compression
lengths to 50, 100, 200, and 400 words for the
multi-document summarization task.
However, applying recall in DUC-2001
without modification is not appropriate
because:
1. Multiple system units contribute to
multiple model units.
2. S
s
and S
m
do not exactly overlap.
3. Overlap judgment is not binary.
For example, in an evaluation session an
assessor judged system units S1.1 and S10.4 as
sharing some content with model unit M2.2.
Unit S1.1 says “Thousands of people are
feared dead” and unit M2.2 says “3,000 and
perhaps … 5,000 people have been killed”.
Are “thousands” equivalent to “3,000 to
5,000” or not? Unit S10.4 indicates it was an
“earthquake of magnitude 6.9” and unit M2.2
says it was “an earthquake measuring 6.9 on
the Richter scale”. Both of them report a “6.9”
earthquake. But the second part of system
unit S10.4, “in an area so isolated…”, seems
to share some content with model unit M4.4
“the quake was centered in a remote
mountainous area”. Are these two equivalent?
This example highlights the difficulty of
judging the content coverage of system
summaries against model summaries and the
inadequacy of using recall as defined.
As we mentioned earlier, NIST assessors not
only marked the sharing relations among
system units (SU) and model units (MU), they
also indicated the degree of match, i.e., all,
most, some, hardly any, or none. This enables
us to compute weighted recall.
Different versions of weighted recall were
proposed by DUC-2001 participants.
McKeown et al. (2001) treated the
completeness of coverage as threshold: 4 for
all, 3 for most and above, 2 for some and
above, and 1 for hardly any and above. They
then proceeded to compare system
performances at different threshold levels.
They defined recall at threshold t, Recall
t
, as
follows:
summary model in the MUs ofnumber Total
aboveor at marked MUs ofNumber t
We used the completeness of coverage as
coverage score, C, instead of threshold: 1 for
all, 3/4 for most, 1/2 for some, and 1/4 for
hardly any, 0 for none. To avoid confusion
with the recall used in information retrieval,
we call our metric weighted retention,
Retention
w
, and define it as follows:
summary model in the MUs ofnumber Total
marked) MUs of(Number C•
if we ignore C and set it always to 1, we obtain
an unweighted retention, Retention
1
. We used
Retention
1
in our evaluation to illustrate that
relative system performance changes when
different evaluation metrics are chosen.
Therefore, it is important to have common and
agreed upon metrics to facilitate large scale
evaluation efforts.
4.1.2 Precision and Pseudo Precision
Precision is also a common measure.
Borrowed from information retrieval research,
precision is used to measure how effectively a
system generates good summary sentences. It
is defined as N
a
/ N
s
. Precision in a fixed length
summary output is equal to recall since N
s
=
N
m
. However, due to the three reasons stated
at the beginning of the previous section, no
straightforward computation of the traditional
precision is available in DUC-2001.
If we count the number of model units that are
marked as good summary units and are
selected by systems, and use the number of
model units in various summary lengths as the
sample space, we obtain a precision metric
equal to Retention
1
. Alternatively, we can
count how many unique system units share
content with model units and use the total
number of system units as the sample space.
We define this as pseudo precision, Precision
p
,
as follows:
summary system in the SUs ofnumber Total
marked SUs ofNumber
Most of the participants in DUC-2001 reported
their pseudo precision figures.
5 Results and Discussion
We present the performance of NeATS in
DUC-2001 in content and quality measures.
5.1 Content
With respect to content, we computed
Retention
1
, Retention
w
, and Precision
p
using
the formulas defined in the previous section.
The scores are shown in Table 1 (overall
average and per size). Analyzing all systems’
results according to these, we made the
following observations.
(1) NeATS (system N) is consistently ranked
among the top 3 in average and per size
Retention
1
and Retention
w
.
(2) NeATS’s performance for averaged pseudo
precision equals human’s at about 58% (P
p all
).
(3) The performance in weighted retention is
really low. Even humans
6
score only 29% (R
w
all
). This indicates low inter-human agreement
(which we take to reflect the undefinedness of
the ‘generic summary’ task). However, the
unweighted retention of humans is 53%. This
suggests assessors did write something similar
in their summaries but not exactly the same;
once again illustrating the difficulty of
summarization evaluation.
(4) Despite the low inter-human agreement,
humans score better than any system. They
outscore the nearest system by about 11% in
averaged unweighted retention (R
1 all
: 53% vs.
42%) and weighted retention (R
w all
: 29% vs.
18%). There is obviously still considerable
room for systems to improve.
(5) System performances are separated into
two major groups by baseline 2 (B2: coverage
baseline) in averaged weighted retention. This
confirms that lead sentences are good
summary sentence candidates and that one
does need to cover all documents in a topic to
achieve reasonable performance in multi-
document summarization. NeATS’s strategies
of filtering sentences by position and adding
lead sentences to set context are proved
effective.
(6) Different metrics result in different
performance rankings. This is demonstrated
by the top 3 systems T, N, and Y. If we use
the averaged unweighted retention (R
1 all
), Y is
6
NIST assessors wrote two separate summaries per
topic. One was used to judge all system summaries
and the two baselines. The other was used to
determine the (potential) upper bound.
Table 1. Pseudo precision, unwe
ighted retention, and weighted retention for all summary lengths: overall
average, 400, 200, 100, and 50 words.
SYS Pp All R1 All Rw All Pp 400 R1 400 Rw 400 Pp 200 R 1 200 Rw 200 Pp 100 R1 100 Rw 100 Pp 50 R1 50 Rw 50
HM 58.71% 53.00% 28.81% 59.33% 52.95% 33.23% 59.91% 57.23% 33.82% 58.73% 54.67% 27.54% 56.87% 47.16% 21.62%
T 48.96%
35.53%
(3)
18.48%
(1)
56.51%
(3)
38.50%
(3)
25.12%
(1)
53.85%
(3)
35.62%
21.37%
(1)
43.53%
32.82%
(3)
14.28%
(3)
41.95%
35.17%
(2)
13.89%
(2)
N
*
58.72%
(1)
37.52%
(2)
17.92%
(2)
61.01%
(1)
41.21%
(1)
23.90%
(2)
63.34%
(1)
38.21%
(3)
21.30%
(2)
58.79%
(1)
36.34%
(2)
16.44%
(2)
51.72%
(1)
34.31%
(3)
10.98%
(3)
Y 41.51%
41.58%
(1)
17.78%
(3)
49.78%
38.72%
(2)
20.04% 43.63%
39.90%
(1)
16.86% 34.75%
43.27%
(1)
18.39%
(1)
37.88%
44.43%
(1)
15.55%
(1)
P 49.56% 33.94% 15.78%
57.21%
(2)
37.76%
22.18%
(3)
51.45% 37.49% 19.40% 46.47% 31.64% 13.92% 43.10% 28.85% 9.09%
L
51.47%
(3)
33.67% 15.49% 52.62% 36.34% 21.80% 53.51% 36.87% 18.34%
48.62%
(3)
29.00% 12.54%
51.15%
(2)
32.47% 9.90%
B2 47.27% 30.98% 14.56% 60.99% 33.51% 18.35% 49.89% 33.27% 17.72% 47.18% 29.48% 14.96% 31.03% 27.64% 8.02%
S
52.53%
(2)
30.52% 12.89% 55.55% 36.83% 20.35%
58.12%
(2)
38.70%
(2)
19.93%
(3)
49.70%
(2)
26.81% 10.72%
46.43%
(3)
19.23% 4.04%
M 43.39% 27.27% 11.32% 54.78% 33.81% 19.86% 45.59% 27.80% 13.27% 41.89% 23.40% 9.13% 31.30% 24.07% 5.05%
R 41.86% 27.63% 11.19% 48.63% 24.80% 12.15% 43.96% 31.28% 15.17% 38.35% 27.61% 11.46% 36.49% 26.84% 6.17%
O 43.76% 25.87% 11.19% 50.73% 27.53% 15.76% 42.94% 26.80% 13.07% 40.55% 25.13% 9.36% 40.80% 24.02% 7.03%
Z 37.98% 23.21% 8.99% 47.51% 31.17% 17.38% 46.76% 25.65% 12.83% 28.91% 17.29% 5.45% 28.74% 18.74% 3.23%
B1 32.92% 18.86% 7.45% 33.48% 17.58% 9.98% 43.13% 18.60% 8.65% 30.23% 17.42% 6.05% 24.83% 21.84% 4.20%
W 30.08% 20.38% 6.78% 38.14% 25.89% 12.10% 26.86% 21.01% 7.93% 28.31% 19.15% 5.36% 27.01% 15.46% 3.21%
U 23.88% 21.38% 6.57% 31.49% 29.76% 13.17% 24.20% 22.64% 8.49% 19.13% 17.54% 3.77% 20.69% 15.57% 3.04%
the best, followed by N, and then T; if we
choose averaged weighted retention (R
w all
), T
is the best, followed by N, and then Y. The
reversal of T and Y due to different metrics
demonstrates the importance of common
agreed upon metrics. We believe that metrics
have to take coverage score (C, Section 4.1.1)
into consideration to be reasonable since most
of the content sharing among system units and
model units is partial. The recall at threshold t,
Recall
t
(Section 4.1.1), proposed by
(McKeown et al. 2001), is a good example. In
their evaluation, NeATS ranked second at t=1,
3, 4 and first at t=2.
(7) According to Table 1, NeATS performed
better on longer summaries (400 and 200
words) based on weighted retention than it did
on shorter ones. This is the result of the
sentence extraction-based nature of NeATS.
We expect that systems that use syntax-based
algorithms to compress their output will
thereby gain more space to include additional
important material. For example, System Y
was the best in shorter summaries. Its 100-
and 50-word summaries contain only
important headlines. The results confirm this
is a very effective strategy in composing short
summaries. However, the quality of the
summaries suffered because of the
unconventional syntactic structure of news
headlines (Table 2).
5.2 Quality
Table 2 shows the macro-averaged scores for
the humans, two baselines, and 12 systems.
We assign a score of 4 to all, 3 to most, 2 to
some, 1 to hardly any, and 0 to none. The
value assignment is for convenience of
computing averages, since it is more
appropriate to treat these measures as stepped
values instead of continuous ones. With this in
mind, we have the following observations.
(1) Most systems scored well in
grammaticality. This is not a surprise since
most of the participants extracted sentences as
summaries.
But no system or human scored perfect in
grammaticality. This might be due to the
artifact of cutting sentences at the 50, 100, 200,
and 400 words boundaries. Only system Y
scored lower than 3, which reflects its headline
inclusion strategy.
(2) When it came to the measure for cohesion
the results are confusing. If even the human-
made summaries score only 2.74 out of 4, it is
unclear what this category means, or how the
assessors arrived at these scores. However, the
humans and baseline 1 (lead baseline) did
score in the upper range of 2 to 3 and all others
had scores lower than 2.5. Some of the
systems (including B2) fell into the range of 1
to 2 meaning some or hardly any cohesion.
The lead baseline (B1), taking the first 50, 100,
200, 400 words from the last document of a
topic, did well. On the contrary, the coverage
baseline (B2) did poorly. This indicates the
difficulty of fitting sentences from different
documents together. Even selecting
continuous sentences from the same document
(B1) seems not to work well. We need to
define this metric more clearly and improve
the capabilities of systems in this respect.
(3) Coherence scores roughly track cohesion
scores. Most systems did better in coherence
than in cohesion. The human is the only one
scoring above 3. Again the room for
improvement is abundant.
(4) NeATS did not fare badly in quality
measures. It was in the same categories as
other top performers: grammaticality is
between most and all, cohesion, some and
most, and coherence, some and most. This
indicates the strategies employed by NeATS
(stigma word filtering, adding lead sentence,
and time annotation) worked to some extent
but left room for improvement.
6 Conclusions
Table 2.
Averaged grammaticality, cohesion, and
coherence over all summary sizes.
SYS Grammar Cohesion Coherence
Human 3.74 2.74 3.19
B1 3.18 2.63 2.8
B2 3.26 1.71 1.65
L 3.72 1.83 1.9
M 3.54 2.18 2.4
N
*
3.65 2 2.22
O 3.78 2.15 2.33
P 3.67 1.93 2.17
R 3.6 2.16 2.45
S 3.67 1.93 2.04
T 3.51 2.34 2.61
U 3.28 1.31 1.11
W 3.13 1.48 1.28
Y 2.45 1.73 1.77
Z 3.28 1.8 1.94
We described a multi-document
summarization system, NeATS, and its
evaluation in DUC-2001. We were encouraged
by the content and readability of the results.
As a prototype system, NeATS deliberately
used simple methods guided by a few
principles:
• Extracting important concepts based on
reliable statistics.
• Filtering sentences by their positions and
stigma words.
• Reducing redundancy using MMR.
• Presenting summary sentences in their
chronological order with time annotations.
These simple principles worked effectively.
However, the simplicity of the system also
lends itself to further improvements. We
would like to apply some compression
techniques or use linguistic units smaller than
sentences to improve our retention score. The
fact that NeATS performed as well as the
human in pseudo precision but did less well in
retention indicates its summaries might include
good but duplicated information. Working
with sub-sentence units should help.
To improve NeATS’s capability in content
selection, we have started to parse sentences
containing key unigram, bigram, and trigram
concepts to identify their relations within their
concept clusters.
To enhance cohesion and coherence, we are
looking into incorporating discourse
processing techniques (Marcu 1999) or Radev
and McKeown’s (1998) summary operators.
We are analyzing the DUC evaluation scores
in the hope of suggesting improved and more
stable metrics.
References
DUC. 2001. The Document Understanding
Workshop 2001.
projects/duc/2001.html.
Dunning, T. 1993. Accurate Methods for the
Statistics of Surprise and Coincidence.
Computational Linguistics 19, 61–74.
Edmundson, H.P. 1969. New Methods in
Automatic Abstracting. Journal of the
Association for Computing Machinery.
16(2).
Goldstein, J., M. Kantrowitz, V. Mittal, and J.
Carbonell. 1999. Summarizing Text
Documents: Sentence Selection and
Evaluation Metrics. Proceedings of the 22
nd
International ACM Conference on
Research and Development in Information
Retrieval (SIGIR-99), Berkeley, CA, 121–
128.
Lin, C Y. and E.H. Hovy. 2000. The
Automated Acquisition of Topic
Signatures for Text Summarization.
Proceedings of the COLING
Conference. Saarbrücken, Germany.
Lin, C Y. 2001. Summary Evaluation
Environment.
Luhn, H. P. 1969. The Automatic Creation of
Literature Abstracts. IBM Journal of
Research and Development 2(2), 1969.
Mani, I., D. House, G. Klein, L. Hirschman, L.
Obrst, T. Firmin, M. Chrzanow ski, and B.
Sundheim. 1998. The TIPSTER SUMMAC
Text Summarization Evaluation: Final
Report. MITRE Corp. Tech. Report.
Mani, I. 2001. Automatic Summarization. John
Benjamins Pub Co.
Marcu, D. 1999. Discourse trees are good
indicators of importance in text. In I. Mani
and M. Maybury (eds), Advances in
Automatic Text Summarization, 123–136.
MIT Press.
Marcu, D. and L. Gerber. 2001. An Inquiry
into the Nature of Multidocument
Abstracts, Extracts, and their Evaluation.
Proceedings of the NAACL -2001 Workshop
on Automatic Summarization. Pittsburgh,
PA.
McKeown, K., R. Barzilay, D. Evans, V.
Hatzivassiloglou, M-Y Kan, B, Schiffman,
and S. Teufel 2001. Columbia Multi-
Document Summarization: Approach and
Evaluation. DUC-01 Workshop on Text
Summarization. New Orleans, LA.
Radev, D.R. and K.R. McKeown. 1998.
Generating Natural Language Summaries
from Multiple On-line Sources.
Computational Linguistics, 24(3):469–500.