ECONOMIC DEVELOPMENT, TRADE AND INVESTMENT IN THE EASTERN AND SOUTHERN MEDITERRANEAN REGION pptx
Bạn đang xem bản rút gọn của tài liệu. Xem và tải ngay bản đầy đủ của tài liệu tại đây (591.35 KB, 69 trang )
The views and opinions expressed here reflect the authors’ point of view and
not necessarily those of CASE Network.
This paper has been prepared within the agenda of FP7 funded project (Grant
Agreement No. 244578) on “Prospective Analysis for the Mediterranean Region
(MEDPRO)”
Keywords: Southern and Eastern Mediterranean, Middle East and North
Africa, economic growth, trade liberalization, FDI, private sector develop-
ment, business climate, privatization, unemployment, inequality
JEL codes: F15, O53, O55
© CASE – Center for Social and Economic Research, Warsaw, 2013
Graphic Design: Agnieszka Natalia Bury
EAN 9788371785788
Publisher:
CASE-Center for Social and Economic Research on behalf of CASE Network
al. Jana Pawla II 61, office 212, 01-031 Warsaw, Poland
tel.: (48 22) 206 29 00, fax: (48 22) 206 29 01
e-mail:
The CASE Network is a group of economic and social research centers in Po-
land, Kyrgyzstan, Ukraine, Georgia, Moldova, and Belarus. Organizations in the
network regularly conduct joint research and advisory projects. The research co-
vers a wide spectrum of economic and social issues, including economic effects of
the European integration process, economic relations between the EU and CIS,
monetary policy and euro-accession, innovation and competitiveness, and labour
markets and social policy. The network aims to increase the range and quality of
economic research and information available to policy-makers and civil society,
and takes an active role in on-going debates on how to meet the economic chal-
lenges facing the EU, post-transition countries and the global economy.
The CASE network consists of:
CASE – Center for Social and Economic Research, Warsaw, est.
1991, www.case-research.eu
CASE – Center for Social and Economic Research – Kyrgyzstan,
est. 1998, www.case.elcat.kg
Center for Social and Economic Research – CASE Ukraine, est.
1999, www.case-ukraine.kiev.ua
CASE –Transcaucasus Center for Social and Economic Research,
est. 2000, www.case-transcaucasus.org.ge
Foundation for Social and Economic Research CASE Moldova, est.
2003, www.case.com.md
CASE Belarus – Center for Social and Economic Research Belarus,
est. 2007, www.case-belarus.eu
Center for Social and Economic Research CASE Georgia, est. 2011
Marek Dabrowski, Luc De Wul
f
CASE Network Reports No. 111
4
Contents
Abstract 9
Introduction 10
1.Economic Growth and Macroeconomic Challenges 12
1.1. The Economic Status of the MED11 Region 12
1.2. Overview of Economic Growth Record 13
1.3. Monetary and Fiscal Stability 15
1.4. The Impact of the Arab Spring 17
1.5. Drivers of Growth in MED11 Countries 18
2.Trade and Economic Integration 20
2.1. General Picture 20
2.2. Protectionist Legacy 22
2.3. Trade Logistics Barriers 24
2.4. Determinants of MED Trade Flows 25
2.5. Scenarios of Euro-MED Trade Liberalization 25
2.6. Scenarios of Intra-Regional Integration 27
2.7. Policy Recommendations 29
3.Private Sector Development and FDI 30
3.1. Indicators of Business and Investment Climate 30
3.2. Financing Private Business 32
3.3. Foreign Direct Investment 34
3.4. Drivers of Foreign Direct Investment 36
3.5. Prospective Analysis: FDI Flows under MEDPRO Scenarios 37
4.Privatization Policies 39
4.1. Regional Overview 39
4.2. Privatization Progress In Individual MED Countries 40
4.2.1.
Algeria 40
4.2.2. Egypt 41
4.2.3. Israel 41
4.2.4. Jordan 41
4.2.5. Lebanon 42
4.2.6. Libya 42
4.2.7. Morocco 42
4.2.8. Palestinian Autonomy 43
4.2.9. Syria 43
4.2.10.Tunisia 43
4.2.11.Turkey 44
4.3. Prospects of Privatization and Private Sector Development 44
E
CONOMIC DEVELOPMENT, TRADE AND INVESTMENT IN THE EASTERN AND…
CASE Network Reports No. 111
5
5.Sectors of Particular Importance 46
5.1. Transport Infrastructure 46
5.2. Information and Communication Technologies 48
5.3. Tourist Services 50
5.4. Agriculture 51
5.5. Textile Industry 53
6.Social Determinants of Economic Development 54
6.1. Demographic Factors, Labor Market And Migration 54
6.2. Income Inequality 57
6.3. Gender Inequality 58
6.4. Education 59
7.Summary and Conclusions 61
Literature 64
Marek Dabrowski, Luc De Wul
f
CASE Network Reports No. 111
6
List of Figures and Tables
Figure 1. MED11: GDP per capita, current international dollars,
in PPP terms, 2010 12
Figure 2. Real GDP growth in selected regions, 1980-2010, annual average, in % . 13
Figure 3. MED11: general government gross debt in % of GDP, 2001-2011 17
Figure 4. Average MFN tariffs applied by selected MED countries 22
Figure 5. An estimation of AVEs of NTBs in selected MED countries (%) 23
Figure 6. Overall trade protection in selected MED countries:
tariffs and NTBs (%) 23
Figure 7. The Logistics Performance Index in the Euromed area (scores, 2010*) 24
Figure 8. Change in MED’s imports from the EU (optimistic scenarios), in % 26
Figure 9. Change in MED’s exports to the EU (optimistic scenarios), in % 26
Figure 10. Change in MED’sintra-regional imports (optimistic scenarios), in % . 28
Figure 11. Change in MED’s intra-regional exports (optimistic scenarios), in % 28
Figure 12. Share of state banks in total banking sector assets (%), 1970-2005 33
Figure 13. FDI Flows by regions, 1995-2009, % of GDP 35
Figure 14. FDI Flows as % of GDP, 1995-2009, MED11 countries 35
Figure 15. Privatization Revenues by Region (% of total revenues for developing
countries) 39
Figure 16. Average years of schooling for adult population (ages 15+), 2010 60
Table 1. MED11 countries: annual growth rates, 2001-2011 14
Table 2. MED11: inflation (end of year) in %, 2005-2011 16
Table 3. MED11: General Government net lending/borrowing in % of GDP,
2001-2011 16
Table 4. MED11 economies: structure by major sectors and the role
of trade, 2007 20
Table 5. Indicators of business climate in MED11 countries 30
Table 6. Domestic Credit to the Private Sector in MED11, % of GDP 32
Table 7. Market capitalization of listed companies (% of GDP) 34
Table 8. FDI flows under four MEDPRO 2030 scenarios, in % of GDP 37
Table 9. Additions to transport infrastructure for each MEDPRO scenario 46
Table 10. Annual transport investment, as % of GDP 47
Table 11. Road and rail investment impacts on annual GDP growth (increase in
GDP annual growth rate, percentage points) 47
E
CONOMIC DEVELOPMENT, TRADE AND INVESTMENT IN THE EASTERN AND…
CASE Network Reports No. 111
7
Table 12. Telecommunication infrastructure in MED11, 2009, % of population . 49
Table 13. Status of competition in ICT in MED11 countries (2010) 49
Table 14. Tourism and travel contribution to GDP, as a% of total 50
Table 15. Employment in the tourist sector (as a share of total employment) 50
Table 16. Total unemployment rates in MED11, % of labor force,
age 15+, 2009 55
Table 17. Youth unemployment in MED countries, % of labor force in
age 15-24, 2007 55
Table 18. MED11: Migrant remittances in % of GDP, 1980-2011 56
Table 19. Income Inequality in MED countries 57
Table 20. Indicators of Gender Inequality 58
Table 21. Literacy rates in MED11 countries 59
Marek Dabrowski, Luc De Wul
f
CASE Network Reports No. 111
8
The authors
Marek Dabrowski, CASE Fellow, Chairman of the Supervisory Council and
President of CASEuntil 2011, Member of the Scientific Council of the E.T. Gaidar
Institute for Economic Policy in Moscow; Former First Deputy Minister of Fi-
nance (1989-1990), Member of Parliament (1991-1993) and Member of the Mone-
tary Policy Council of the National Bank of Poland (1998-2004); Since the end of
the 1980s he has been involved in policy advising and policy research in Azerbai-
jan, Belarus, Bosnia and Herzegovina, Bulgaria, Egypt, Georgia, Iraq, Kazakhstan,
Kyrgyzstan, Macedonia, Moldova, Mongolia, Poland, Romania, Russia, Serbia,
Syria, Turkmenistan, Ukraine, Uzbekistan and Yemen, as well as in a number of
international research projects related to monetary and fiscal policies, currency
crises, international financial architecture, EU and EMU enlargement, perspectives
of European integration, European Neighborhood Policy and political economy of
transition; World Bank and UNDP Consultant; Author of several academic and
policy papers, and editor of several book publications.
Luc De Wulf, CASE Fellow and former staff member of the International
Monetary Fund (Fiscal Affairs and Asian Departments -1972-88) and the World
Bank (African and Middle East Departments -1988-2000). Since 2000, he has
worked as an independent consultant for the World Bank, the IMF, DFID, SADC,
and SACU. His main responsibility in recent years has been to lead teams of ex-
perts that analysed the progress of integration between the European Union and
Mediterranean countries in the context of several large EU funded projects. Aside
from regional integration, his other areas of expertise cover fiscal policy, trade
facilitation and customs reform. In addition to a number of academic papers, he
co-editored “Customs Modernization Initiatives” (World Bank, 2004) and “Cus-
toms Modernization Manual” (World Bank, 2005). Since 2000 he has mainly
worked in African and Middle Eastern countries.
E
CONOMIC DEVELOPMENT, TRADE AND INVESTMENT IN THE EASTERN AND…
CASE Network Reports No. 111
9
Abstract
Despite its many advantages, the Eastern and Southern Mediterranean region
remains relatively backward in economic and social terms and is rightly consid-
ered a potential source of social and political instability. Its average GDP per capi-
talags behind the global average and is increasing slowly due to weak economic
policies, poor governanceand rapid population growth. The region suffers from
high unemployment (especially among women and youth), poor education, high
levels of income inequality, gender discrimination, underdeveloped infrastructure,
continuous trade protectionism, and a poor business climate. To overcome these
development obstacles, MED countries should conduct comprehensive reforms of
their economic, social and political systems with the aim of ensuring macroeco-
nomic stability, increasing trade and investment openness, improving the business
climate and governance system, and upgrading infrastructure and human capital.
The main economic and political partners of the MED countries, especially the
EU, can actively support this modernization agenda through liberalizing trade in
some sensitive sectors (like agriculture and services), adopting a more flexible
approach to MED labor migration, and cooperating in mitigating climate changes,
improving educational outcomes, and promoting science and culture. This will
require renewed initiatives with dedicated technical assistance and continued and
enhanced financial assistance, particularly to improve infrastructure.There is also a
lot of room for improvement in intra-MED cooperation but this requires resolving
the protracted political conflicts in the region and taking bolder steps to remove
trade and investment barriers.
Marek Dabrowski, Luc De Wul
f
CASE Network Reports No. 111
10
Introduction
The purpose of this report is to provide an overview of economic challenges
and prospective scenarios faced by agroup of 11 countries located in the Eastern
and Southern Mediterranean region (MED11). This group includes the 10 coun-
tries of the Middle East and North Africa participating in the Barcelona process
and the European Neighborhood Policy, identified in many documents and anal-
yses as the ‘Southern Mediterranean’ neighbors of the EU (Algeria, Egypt, Israel,
Jordan, Lebanon, Libya, Morocco, Palestinian Autonomy, Syria, and Tunisia) plus
Turkey, anEU candidate country and an important economic and political player in
this region.
The report summarizes the major streams of research work undertaken within
Work Package 5 (WP5) on ‘Economic development, trade and investment’ of the
‘
Prospective Analysis for the Mediterranean Region (MEDPRO),’ a collabora-
tive project funded under the European Union (
EU)’s Seventh Framework Pro-
gram and conducted by aconsortium of 17 institutes led by the Center for Europe-
an Policy Studies (CEPS) between March 1, 2010 and February 28, 2013 (Grant
Agreement No. 244578).
The report concentrates on analytical findings and a discussion of potential
prospective scenarios and less soon detailedpolicy recommendations which are the
subject of another publication within the same project (see Dabrowski & De Wulf,
2012).
The report’s structure follows major research topics and tasks undertaken with-
in WP5 of the MEDPRO project. Section 2 briefly presents the economic situa-
tionin theMED11 and the region’s role in the global economy and then analyzes
key macroeconomic challenges such as growth, inflationand fiscal imbalances.
Section 3 focuses on trade flows between MED11 countries and the EU and on
intra-regional trade as well as on the factors and mechanisms which could facili-
tate further trade expansion in both dimensions. Section 4 addresses the issues of
private sector development, business and investment climate and foreign direct
investment (FDI). Section 5 provides an overview of privatization policies in the
region. Section 6 reports on the key findings of a few sectors that are particularly
important for MED11 economies: transportation and ICT infrastructure, tourism,
agriculture and the textile industry. Section 7 provides a brief overview of the
E
CONOMIC DEVELOPMENT, TRADE AND INVESTMENT IN THE EASTERN AND…
CASE Network Reports No. 111
11
social factors and policies which are crucial for economic development in the ana-
lyzed region. Section 8 offers a summary and conclusions.
Our report draws extensively from more than 10 reports and papers prepared
within WP5 as well as from a few other studies prepared within other work pack-
ages of the MEDPRO project. We have also benefited directly and indirectly (via
the mentioned background reports and papers) from other studies and data sources,
including those published by the World Bank, IMF, UNCTAD, UNDP, OECD,
and many other institutions. However, the authors of this paper accept sole respon-
sibility for the content and quality of this report. The opinions and conclusions
presented can be attributed exclusively to the authors and not to any institution
they have been associated with orany source they have used in this paper. Private
sector development.
Marek Dabrowski, Luc De Wul
f
CASE Network Reports No. 111
12
1. Economic Growth and
Macroeconomic Challenges
1.1. The Economic Status of the MED11 Region
The total population of the MED11 group of countries amounted to 274 million
in 2010, i.e. ca. 4% of the world total population, according to the IMF World
Economic Outlook database. However, in terms of the share in global GDP, the
region’s contribution is lower: it amounts to only 3.3%, 1.3% of which is account-
ed for by Turkey. This means that the region’s GDP per capita level is below the
global average.
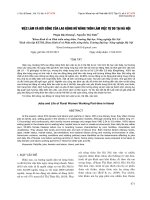
Figure 1. MED11: GDP per capita, current international dollars, in PPP terms, 2010
Note. Data on the Palestinian Autonomy is not available.
Source: IMF WEO database, April 2012.
Figure 1 confirms this finding. Israel, with its GDP per capita level (in PPP
terms) close to 30,000 USD, is the only country that belongs to the high-income
group according to the World Bank classification.Six countries (Algeria, Jordan,
Lebanon, Libya, Tunisia, and Turkey) are part of the upper-middle income catego-
7 112
6 417
29 602
5 767
15 168
14 384
4 794
5 041
9 454
13 275
0
5 000
10 000
15 000
20 000
25 000
30 000
Algeria
Egypt
Israel
Jordan
Lebanon
Libya
Morocco
Syria
Tunisia
Turkey
E
CONOMIC DEVELOPMENT, TRADE AND INVESTMENT IN THE EASTERN AND…
CASE Network Reports No. 111
13
ry, and the three remaining countries (Egypt, Morocco and Syria) are lower-
middle income economies.
1
1.2. Overview of Economic Growth Record
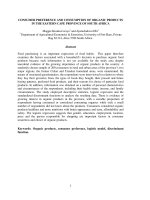
As analyzed by Couthino (2012) and presented in Figure 2,
2
the pace of eco-
nomic growth in this region was not particularly impressive for quite a long time
(especially in the 1980s) comparedto other developing regions.
Figure 2. Real GDP growth in selected regions, 1980-2010, annual average, in %
Note. LAC – Latin America and Caribbean, MENA – Middle East and North Africa, SSA
– Sub-Saharan Africa.
Source: IMF WEO database, April 2012.
In the 1970s, the MEDregion greatly benefited from the oil price boom,
through a sharp increase in exports and investments in oil-producing countries
such as Algeria, Libya and, to a lesser extent, Egypt, Syria, and Tunisia. These
gains spilledover to their neighbors through significant increases in worker remit-
1
See />groups#High_income.
2
Figure 2 contains data for the Middle East and North Africa (MENA) region, which co-
vers eight economies analyzed in the MEDPRO project (all but Israel, Palestinian Auton-
omy and Turkey) plus six Gulf states, Yemen, Iraq, Iran, Djibouti, Sudan and Mauritania.
Thus it can provide only a very rough estimate of the historical growth record of the
MED11 group.
0
2
4
6
8
10
1980-1989 1990-1999 2000-2010
Dvlp Asia LAC MENA SSA
Marek Dabrowski, Luc De Wul
f
CASE Network Reports No. 111
14
tances, trade, and capital flows. However, a substantial part of these windfall gains
were misused for pursuing expensive and inefficient import-substitution strategies,
prestige infrastructure investment projects, and populist social policies involving,
among others, huge price subsidies.
The economic model which dominated in several Arab countries in the 1960s
and 1970s, especially in Algeria, Egypt, Libya, Syria and Iraq and, to a lesser extent
in Tunisia, and was sometimes referred to as Arab socialism, relied heavily on pub-
lic ownership, administrative interference in market forces, central planning, the
militarization of the economy and trade protectionism (Dabrowski, 2012; MENA,
2004a). Israel also followed a kind of ‘socialist’ economic model at that time, with a
large share of public and collective ownership, and heavy government regulation.
When oil prices collapsed in the mid-1980s, the region had to accommodate to
this adverse shock. The deterioration in external economic conditions and poor
economic performance became a catalyst for economic reforms in a number of
countries (Abed & Davoodi, 2003): thebeginning of trade liberalization, incentives
to FDI, increased exchange rate flexibility (and the elimination of multiple ex-
change rate regimes), and a range of fiscal reforms spanning from tax and benefits
reforms (e.g. the introduction of value-added taxes and a partial phasing out of
food and energy subsidies) to the reform of public expenditure management.
Countries such as Egypt, Jordan, Morocco, Tunisia, and Turkeythat pursued re-
formssubsequently reported relatively high rates of per capita GDP growth. How-
ever, if one takes into account the continuous high rate of population growth (over
2% annually – see Section 7.1), the growth rates recorded in the last decade (Table
1) allow for only a moderate improvement in GDP per capita level. Furthermore,
they were volatile and suffered both from the global financial crisis in 2008-2009
and the Arab Spring (see Section 2.4).
Table 1. MED11 countries: annual growth rates, 2001-2011
Country 2001 2002 2003 2004 2005 2006 2007 2008 2009 2010 2011
Algeria 2.7 4.7 6.9 5.2 5.1 2.0 3.0 2.4 2.4 3.3 2.4
Egypt 3.5 3.2 3.2 4.1 4.5 6.8 7.1 7.2 4.7 5.1 1.8
Israel -0.2 -0.6 1.5 4.8 4.9 5.6 5.5 4.0 0.8 5.7 4.6
Jordan 5.3 5.8 4.2 8.6 8.1 8.1 8.2 7.2 5.5 2.3 2.6
Lebanon 4.0 3.4 3.2 7.5 1.0 0.6 7.5 9.3 8.5 7.0 1.5*
Libya -1.8 -1.0 13.0 4.5 11.9 6.5 6.4 2.4 -1.4 3.7* -59.7*
Morocco 7.6 3.3 6.3 4.8 3.0 7.8 2.7 5.6 4.9 3.7 4.9
Syria 3.7 5.9 -2.0 6.9 6.2 5.0 5.7 4.5 5.9 3.4 n/a
Tunisia 4.9 1.7 5.5 6.0 4.0 5.7 6.3 4.5 3.1 3.1 -1.8
Turkey -5.7 6.2 5.3 9.4 8.4 6.9 4.7 0.7 -4.8 9.2 8.5*
Notes. * IMF estimates; no data for Palestinian Autonomy.
Source: IMF World Economic Outlook database, October 2012.
E
CONOMIC DEVELOPMENT, TRADE AND INVESTMENT IN THE EASTERN AND…
CASE Network Reports No. 111
15
It is also worth remembering that the prospects forthe economic growth of ma-
jor hydrocarbon producers (Libya, Algeria and, to a lesser extent, Syria) remain
highly dependent on oil and natural gas prices. Indirectly, through intra-MENA
3
trade, migrant remittances, tourism and capital flows, other countries (especially
Egypt and Lebanon) have also benefited from the oil boom of the 2000s. If hydro-
carbon prices decline seriously (as they didin the second half of 2008 but only for
a few months), their major producers in the MED region can face a danger of fis-
cal and balance of payments crises and economic downturn, especially in the con-
text of not always prudent management of oil windfall.
1.3. Monetary and Fiscal Stability
Better macroeconomic management in the 1990s and 2000s led to relative mac-
roeconomic stability. In particular, sounder monetary and fiscal policiesresulted in
lower rates of inflation (Table 2) and lower fiscal deficits (Table 3) and public
debts (Figure 3).
However, the sustainability of this macroeconomic stability may raise legiti-
mate concerns at least in some countries in the region. First, moderate inflation
pressures persist in Egypt and Turkey as seen in Table 2. Second, in spite of high
growth rates, Egypt, Jordan and Lebanon ran high fiscal deficits thorough the en-
tire decade of the 2000s. After the global financial crisis, fiscal balances also dete-
riorated in Morocco and, to a lesser extent, in Israel. The Arab Spring brought
fiscal deterioration in Tunisia, Libya, Egypt and Syria, at least in the short term.
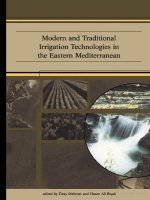
As a result, the gross public debt-to-GDP exceeds 60% in Egypt, Israel, Jordan,
and Lebanon and it has increased in most countries since 2008, reversing earlier
moderate gains.
The two biggest fiscal challenges in the region relate to universal price subsi-
dies and socially motivated overemployment in the public sector (Dabrowski &
De Wulf, 2012). Large price subsidies to food, electricity, and fuel continue to
create a huge fiscal burden in several MED11 countries, especially Egypt (over
10% of GDP), Algeria, and Lebanon. The IMF (2011, p. 44) estimated their total
cost in MENAP
4
countries at the level of USD 200 billion, i.e. 7.8% of their GDP.
3
i.e. including the Gulf countries and Iraq, which are even larger hydrocarbon producers
than the MED11 countries.
4
This abbreviation stands for the Middle East, North Africa, Afghanistan and Pakistan and
includes 22 countries. It covers eight of the economies analyzed in the MEDPRO project
Marek Dabrowski, Luc De Wul
f
CASE Network Reports No. 111
16
Table 2. MED11: inflation (end of year) in %, 2005-2011
Country
2005 2006 2007 2008 2009 2010 2011
Algeria 1.7 3.8 4.8 4.9 5.8 3.6 5.2
Egypt 4.7 7.2 8.6 20.2 10.0 10.7 11.8
Israel 2.4 -0.1 3.4 3.8 4.0 2.6 2.2
Jordan 4.2 7.5 5.1 9.1 2.7 6.1 3.3
Lebanon 0.5 7.2 6.0 6.4 3.4 5.1 3.1
Libya 3.0 7.2 7.6 9.7 0.3 3.3* 26.6*
Morocco 2.1 3.3 2.0 4.2 -1.6 2.2 0.9
Syria 4.9 6.7 4.8 15.4 1.7 6.3 n/a
Tunisia 3.8 3.3 5.1 4.0 4.0 4.1 3.5
Turkey 7.7 9.7 8.4 10.1 6.5 6.4 10.4
Notes. * IMF estimate; no data for the Palestinian Autonomy.
Source: IMF WEO database, October 2012.
Table 3. MED11: General Government net lending/borrowing in % of GDP, 2001-
2011
Country 2001 2002 2003 2004 2005 2006 2007 2008 2009 2010 2011
Algeria 3.7 1.2 4.9 5.3 13.6 13.9 6.2 9.0 -5.1 -0.9 -0.2
Egypt n/a -9.2 -9.0 -8.3 -8.4 -9.2 -7.5 -8.0 -6.8 -7.8 -9.9
Israel -6.3 -7.8 -7.9 -6.0 -4.8 -2.4 -1.3 -3.4 -6.0 -4.6 -4.0*
Jordan -3.0 -4.1 -2.0 -1.1 -5.6 -4.0 -4.7 -4.3 -8.5 -5.6 -6.8
Lebanon -20.7 -15.9 -13.6 -9.5 -8.4 -10.4 -10.8 -9.5 -8.3 -7.7 -6.1
Libya -0.7 6.5 5.6 11.3 30.4 30.9 26.6 26.3 -2.0 18.0 -24.5
Morocco -4.3 -4.9 -4.2 -3.8 -6.2 -2.0 -0.1 0.7 -1.8 -4.4 -6.9
Syria 2.3 -2.0 -2.7 -4.2 -4.4 -1.1 -3.0 -2.9 -2.9 -4.8* n/a
Tunisia -2.1 -2.2 -2.2 -2.2 -2.8 -2.6 -2.0 -0.6 -1.2 -1.0 -3.2
Turkey n/a -13.9 -10.0 -3.9 -0.3 0.0 -1.7 -2.4 -5.6 -2.7 -0.2*
Notes. * IMF estimate; no data for the Palestinian Autonomy.
Source: IMF WEO database, October 2012.
Universal price subsidies are both costly and inefficient as tools to fight pov-
erty (their main social policy justification). In reality, higher- and middle-income
groups are the main beneficiaries of these subsidies. In addition, the subsidies have
a devastating microeconomic and structural impact. They discourage producers of
the subsidized energy and food products from increasing their output and quality
parameters. They stimulate excessive and wasteful consumption, damage the envi-
ronment, and hamper the development of renewable energy, etc. (see Bergasse,
2012 for the analysis of energy subsidies). Price subsidies should be replaced by
(all but Israel, Palestinian Autonomy and Turkey) plus six Gulf states, Yemen, Iraq, Iran,
Afghanistan, Pakistan, Djibouti, Sudan, and Mauritania (see IMF, 2011, p. ix).
E
CONOMIC DEVELOPMENT, TRADE AND INVESTMENT IN THE EASTERN AND…
CASE Network Reports No. 111
17
targeted social safety nets, including targeted cash transfers, following the experi-
ences of Iran, Jordan and Turkey.
Figure 3. MED11: general government gross debt in % of GDP, 2001-2011
Note. No data for the Palestinian Autonomy.
Source: IMF WEO database, October 2012.
1.4. The Impact of the Arab Spring
It is too early to assess the impact of the 2011-2012 Arab Spring on long-term
economic policies and growth performance. Obviously, in the short term, the polit-
ical turbulence caused a lot of damage in growth performance and macroeconomic
stability, especially in countries which have suffered from violent conflict (Libya
and Syria). Political instability also produced populist policy decisions. For exam-
ple, the phasing-out of subsidies has been reversed in some countries as social
unrest puts pressure on governments to offset the impact of surging global food
and fuel prices, showing that once reforms have been conducted, they should not
be considered irreversible (see IMF, 2011).
A review of the experience of countries that managed a successful transition to
democracy suggests that growth declined by about 3% during the transition, but
recovered the pre-transition rate within two years. Investment took about five
years to recover (MENA, 2011, p. 2). The important lesson of this analysis sug-
gests that with the right policies, the dip in growth rates being experienced in some
MED11 countries can be temporary and that the long term growth trend can be
resumed.
0
20
40
60
80
100
120
140
160
180
Algeria
Egypt
Israel
Jordan
Lebanon
Libya
Morocco
Syria
Tunisia
Turkey
2001
2005
2008
2011
Marek Dabrowski, Luc De Wul
f
CASE Network Reports No. 111
18
1.5. Drivers of Growth in MED11 Countries
Econometric analyses of long-term drivers of economic growth in MED11
countries conducted by Couthino (2012) suggests the following conclusions:
A convergencehas been observed in growth across countries on both sides
of the Mediterranean, i.e. between MED11 and MED4 (France, Greece, Ita-
ly and Spain) groups. This implies that, on average, countries with relatively
low levels of GDP per capita have been growing faster than countries with
high levels.
Macroeconomic stability, as measured by low rates of inflation, has in gen-
eral been rewarded with better growth performance. Deeper analysis of the
determinants of inflation suggests that inflation is positively related to fiscal
imbalances (hence the importance ofcontaining the large fuel and food sub-
sidies that strain many of the budgets in the region) and current account def-
icits.
Efforts to reduce unemployment through additional public sector employ-
ment, either in civil service or in public enterprises, strain public finances,
stimulate consumption and dampen productivity, thus generating upward
pressure on prices and inflation that isharmful for economic growth. In addi-
tion, these policies substantially decreasethe quality and effectiveness of
civil service and public sector companies and stimulate nepotism and cor-
ruption. Thus, strategies to create employment will need to rely on improv-
ing internal and external competitiveness, which will depend on factors such
as improving human capital, attracting foreign investment and increasing
theopenness of the economy to the outside world (see Sections 3, 4 and 7.4).
Financial development as proxied by the initial level of capital account
openness is robustly correlated with better growth performance (see Chinn
and Ito, 2008, and Ayadi et al, 2011).
Openness to trade is associated with better growth performance.
FDI inflows stimulate growth. They are positively correlated with better in-
stitutions. Factors such as bureaucracy, corruption, but also information, the
banking sector, and legal institutions are important determinants of inward
FDI (see Bénassy-Quéré et al., 2007 and Section 4.4 of this paper).
Infrastructureindicators such as thenumber of fixed telephone lines per 100
persons are also positively correlated with growth performance (see Section
6.2).
Human capital proxied by secondary completion rates is insignificant and
evenhas an unexpected negative sign (the same result holds if the average
E
CONOMIC DEVELOPMENT, TRADE AND INVESTMENT IN THE EASTERN AND…
CASE Network Reports No. 111
19
years of total schooling are used instead). This is in line with the findings
that returns from education in some analyzed countries are low, with young
graduates often remaining unemployed (see Arbak, 2011; Sections 7.1 and
7.4 of this paper). When using the ratio of public expenditures on education
to GDP, the coefficient becomes significant and positive. These last results
are in line with the findings of growth studies that look at the detailed com-
position of public expenditure (see e.g. Bose et al., 2007).
In general, Coutinho’s findings (2012) confirm that growth will be fostered by
maintaining macroeconomic stability and openness to trade, investment, and FDI.
A good business climate and a predictable macroeconomic environment are essen-
tial, as are developing financial markets, improving infrastructure and paying at-
tention to the quality of human resources. While this growth agenda is not unique
to the MED11 countries, the analysis has shown that each of the above variables
should be addressed and that they are mutually supportive of a growth environ-
ment. Closer interaction with the EU would certainly assist in implementing the
growth agenda, not only through the mobilization of additional resources to fi-
nance it, but also through greater trade and FDI openness and upgrading institu-
tions in MED11 countries.
Growth is not the only objective of MED11 societies, as clearly shown by ex-
perience of the 2011-2012 Arab Spring. Persistent unemployment (see Section
7.1), growing income disparities (Section 7.2), an unequal level playing field in
business, high levels of corruption and nepotism (Section 4.1), poor govern-
ance,theconspicuous consumption of a small elite, and the lack of political voice
wereprominent motivating factorsfor the Arab Spring activists.Economic growth
can provide the resources to address major social challenges. Hence the new polit-
ical leaders that will emerge from the Arab Spring, and those leaders that are ad-
justing their policy stance following the Arab Spring in neighboring countries
should conduct growth-friendly economic policies.
Marek Dabrowski, Luc De Wul
f
CASE Network Reports No. 111
2
0
2. Trade and Economic Integration
2.1. General Picture
Trade plays a crucial role in most of the analyzed economies which are rela-
tively small (apart from Turkey which can be considered medium-sized) and often
heavily dependent on energy and other commodity exports. Their relative under-
industrialization and continuous high share of agriculture production in GDP (see
columns 2 and 3 in Table 4) make their modernization prospects additionally de-
pendent on free imports and investment openness. Indeed, as illustrated incolumns
5 and 6 of Table 4, the share of both exports and imports in individual countries’
GDP is considerable but it does not necessarily reflect the existing potential of
increasing trade flows due to a strong protectionist legacy (see Section 3.2).
Table 4. MED11 economies: structure by major sectors and the role of trade, 2007
Country
Value added by sector (% of GDP)
Trade in goods and
services (% of GDP)
Agricul-
ture
Industry
Services,
etc.
Exports Imports
Algeria 8.2 61.1 30.7 46.8 23.4
Egypt 14.1 36.3 49.6 30.3 34.8
Israel
#
2.7 30.2 67.1 43.9 43.9
Jordan 3.2 29.4 67.4 57.9 99.3
Libya
~
17.0 23.0 59.0
Morocco 13.7 27.3 59.0 35.8 44.9
Syria 18.1 35.0 46.9 41.4 40.5
Palestinian Autonomy
(2006)*
8.0 13.0 79.0
Tunisia 10.4 29.6 60.0 54.1 56.5
Lebanon 6.4 24.0 69.6 25.3 49.9
Turkey (2006)** 8.7 28.3 63.0 22.1 27.2
Notes:
#
Israel’s value added per sector is taken from the CIA Factbook; values are for 2007 ;
~
Libya’s value added per sector is taken from the CIA Factbook; values are for 2004
* Values for the Palestinian Authority are from CIA Factbook for 2006.
** Value is PPP 2006;
data for other countries are taken from the World Development Indicators of the World
Bank 2007.
Source: De Wulf, Maliszewska et al. (2009), Appendix 1, Table 1.
E
CONOMIC DEVELOPMENT, TRADE AND INVESTMENT IN THE EASTERN AND…
CASE Network Reports No. 111
21
The product structure of merchandise exports differs strongly country by coun-
try. The exports of two countries – Algeria and Libya – are totally dominated by
oil and natural gas. Fuels also play an important role in Syria’s exports and less so
– in Egypt. Other countries, including Egypt, represent a more diversified structure
of exports.
Agriculture and food products are important export items in Syria, Morocco,
the Palestinian Autonomy, and Egypt and, to a lesser extent, in Jordan, Lebanon
and Turkey. Several countries, especially Jordan, Israel, Morocco and Egypt, have
a strong export position in chemical products. Machinery and transport equipment
play an import role in the exports of Tunisia, Turkey, Israel, Lebanon and Moroc-
co. Finally, Tunisia, Turkey, Jordan and Egypt are important textile exporters (see
Section 6.5). One should also remember about the role of service exports, especial-
ly the tourist industry (see Section 6.3).
The product structure of imports is less differentiated across the analyzed coun-
tries. Machinery, transport equipment and other manufactured goods dominate the
imports structure everywhere in the region. In all countries but Turkey, food im-
ports also play an important role. Finally, except for Algeria, Libya and Israel, fuel
imports represent a substantial share of total imports.
In terms of geographical structure, the EUisthe major trade partner of the ana-
lyzed region.In 2007, the EU’s share in MED11 exports accounted for 17.1% in
Lebanon, 28.8% in Egypt, 29.9% in Israel, 43.0% in Syria, 43.6% in Algeria,
51.9% in Turkey, 71.9% in Morocco and 79.2% in Tunisia. Jordan and the Pales-
tinian Autonomy are exceptions. The share of the EU’s market in their total ex-
ports amounted to 3.2% and 5.2% respectively (in 2007). The former has large
shares of exports to the Gulf countries, the US and the rest of the world while the
latter trades mostly with Israel and through Israel. The US and other NAFTA
countries are destinationsfor Algerian and Israeli exports.The Gulf countries are
one of the main destinations for Lebanese and Syrian exports. The EU’s share in
MED11 imports was in the range between 22.3% in Egypt and 64.3% in Tunisia;
in the case of Palestinian Autonomy, this share amounted to 7.8% of its total im-
ports (see De Wulf, Maliszewska et al.,2009, Table 3, p. 46).
In spite of several intra-regional trade liberalization initiatives in the last dec-
ade, the role of intra-MED trade is still limited (6.9% of total exports and 5.8% of
total imports in 2007), except for Palestinian Autonomy (92% for exports and 78%
for imports). Intra-regional trade for Syria, Lebanon and, to a lesser extent, Jordan
is slightly more than the regional average (De Wulf, Maliszewska et al.,2009, Ta-
ble 3, p. 46).
Marek Dabrowski, Luc De Wul
f
CASE Network Reports No. 111
2
2
2.2. Protectionist Legacy
MED11 countries remained relatively closed to the external world, including
their near neighbors, for a quite a long time as a result of the import-substitution
strategies of the1970s and 1980s (see Section 2.2), trade and investment protec-
tionism, current and capital account restrictions,
5
excessive government regula-
tions, underdeveloped regional infrastructure, closed borders (for political rea-
sons), restrictions to the movement of people, etc. In spite of some progress ac-
complished as a result of trade liberalization in the 1990s and 2000s, the average
applied import tariff rate on manufactured goods remains stay high in most of the
region (apart from Israel, Lebanon and Turkey – see Figure 4
6
).
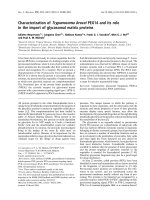
Figure 4. Average MFN tariffs applied by selected MED countries
Source: Ghoneim, Peridy et al (2011), Annex 3.
The Barcelona Process and the bilateral association and free trade agreements
signed between the EU and individual MED11 countries have beenprimarily fo-
cused on tariff reduction and achieved little progress in the area of non-tariff barri-
ers (NTB) and other obstacles to free trade. As these agreements have been con-
cluded gradually since the mid-1990s and their agendas have varied country by
country, the progress in import tariffs reduction differs among MED11 countries.
Israel and Turkey have removed almost all tariff protection against EU imports.
5
Until the early 2000s, most of the MED11 countries had inconvertible currencies, i.e.
they continued current account restrictions and multiple exchange rates and did not meet
the requirements of Article VIII of the IMF Articles of Agreement.
6
Figure 4 reflects findings based on the latest available data, and probably overestimates
the tariff rates that prevail in 2012.
6.7
7.3
9.3
14.6
14.9
20.2
20.8
29.4
31.8
0
5
10
15
20
25
30
35
Israel
(2008)
Lebanon
(2007)
Turkey
(2009)
Jordan
(2007)
Syria
(2002)
Algeria
(2009)
Morocco
(2009)
Egypt
(2008)
Tunisia
(2006)
E
CONOMIC DEVELOPMENT, TRADE AND INVESTMENT IN THE EASTERN AND…
CASE Network Reports No. 111
23
Morocco and Lebanon have also made significant progress, with small average
tariffs applied to EU imports. On the other hand, Tunisia, Syria and Algeria show
the highest tariffs (up to 18% for Tunisia), whereas Jordan and Egypt are in an
intermediate position.
Figure 5. An estimation of AVEs of NTBs in selected MED countries (%)
Source: Ghoneim, Peridy et al (2011), Annex 3.
Figure 6. Overall trade protection in selected MED countries: tariffs and NTBs (%)
Source: Ghoneim, Peridy et al (2011), Annex 3.
Ghoneim, Peridy et al. (2011, Annex 3) estimated the tariff ad valorem equiva-
lents (AVEs) of the NTBs using the recent methodology developed by Kee et al.
(2009), which was applied in two stages. The first included an estimation of the
quantity impact of NTBs on imports. Then, this impact was transformed into price
22.1
22.1
23.0
27.8
33.3
35.6
0
5
10
15
20
25
30
35
40
Morocco Egypt Tunisia Lebanon Jordan Algeria
0
10
20
30
40
50
60
Morocco Egypt Lebanon Jordan Tunisia Algeria
NTMs (AVEs) tarifs
Marek Dabrowski, Luc De Wul
f
CASE Network Reports No. 111
2
4
effects, using the import demand elasticities calculated in Kee et al. (2008). The
data came from the TRAINS database, with eight groups of NTBs such as specific
charges and taxes, administration process, financial measures, automatic licenses,
non-automatic licenses and other quantitative restrictions, monopolistic measures
as well as technical or quality regulations.
Figure 5 shows that NTB protection is strongest in Algeria and Jordan where it
amounts to more than 33% in tariff equivalent. Conversely, Morocco, Tunisia
andEgypt havethe lowest AVEs (less than 25%). Figure 6 presents the overall
level of protection, i.e. the sum of tariffs and NTBs, which looks very high espe-
cially in the cases of Algeria, Tunisia and Jordan.
2.3. Trade Logistics Barriers
Apart from protectionist policies (which manifest themselves in the form of tar-
iff and non-tariff barriers), poor transport infrastructure and logistics areanother
barrier to trade.
Figure 7. The Logistics Performance Index in the Euromed area (scores, 2010*)
Note. *year 2007 concerning Morocco.
Source: World Bank (2011).
Ghoneim, Peridy et al. (2011) estimated transport costs based on Maersk statis-
tics and the logistics performance index (LPI) of the World Bank (World Bank,
2.0
2.5
3.0
3.5
4.0
4.5
Germany
Sweden
Netherlands
Luxembourg
United Kingdom
Belgium
Ireland
Finland
Denmark
France
Austria
Italy
Spain
Czech Republic
Poland
Israel
Portugal
Lebanon
Latvia
Slovak Republic
Turkey
Estonia
Cyprus
Lithuania
Hungary
Greece
Slovenia
Romania
Tunisia
Bulgaria
Malta
Syrian Arab Republic
Egypt. Arab Rep.
Jordan
Morocco*
Algeria
Libya
E
CONOMIC DEVELOPMENT, TRADE AND INVESTMENT IN THE EASTERN AND…
CASE Network Reports No. 111
25
2011). The LPI is built as a weighted average of seven sub-indexes: (1) the effi-
ciency of the clearance process by customs and other border agencies, (2) the qual-
ity of transport and information technology infrastructure for logistics, (3) the ease
of arranging international shipments, (4) thecompetence of the local logistics in-
dustry, (5) theability to trace and check international shipments, (6) domestic lo-
gistics costs,and (7) the timeliness of shipments in reaching their destinations. All
of theseare computed based on a worldwide survey of the companies involved in
logistics services. Figure 7 suggests that the LPIs in the MED11 countries are con-
siderably lower thanthose of the EU countries.
2.4. Determinants of MED Trade Flows
Based on the application of a specific gravity model with trade costs, Ghoneim,
Peridy et al. (2011) estimated the impact of various factors (tariffs, NTBs,
transport and logistics costs, cultural factors like common language and colonial
legacy, etc.) on the imports of selected MED countries fromthe EU. The results
suggest that the NTBs have a particularly detrimental impact on MED imports
(particularly for Algeria and Egypt), followed by transport costs. The negative
impact of tariffs on MED imports is also significant. Finally, the traditional trade
gravity variables (GDP and cultural factors) provide the expected signs and are
also significant.
A similar analysis for MED countryexports shows that EU tariffs have no im-
pact since their level is very low. As the EU’s NTBs are lower than those of MED
countries,
7
their negative impact on MED countryexports is also lower. Finally,
MED countries’ exports are significantly reduced by their low LPI.
2.5. Scenarios of Euro-MED Trade Liberalization
Ghoneim, Peridy et al. (2011) have developed four scenarios of further Euro-
Med trade liberalization: shallowand deep integration, both in two variants - par-
tial (pessimistic) and full (optimistic). Shallow integration refers to trade integra-
tion that is based on the reduction/elimination of tariffs. Deep integration assumes
7
Kee et al. (2009) estimate AVE with respect to EU imports at the level of 13.4%.