Pollution and Industrial Poultry Production in America potx
Bạn đang xem bản rút gọn của tài liệu. Xem và tải ngay bản đầy đủ của tài liệu tại đây (3.97 MB, 36 trang )
Pollution and Industrial
Poultry Production in America
Cover photos, from left: David Harp, Robert Bennett/AGStock Images, David Harp
Chesapeake Bay Bridge: Michael Lutzky/The Washington Post/Getty Images
www.PewEnvironment.org
Chicken, once a distant third to beef and pork, is
now the most popular meat in the United States.
The average American eats almost 84 pounds
of chicken a year, more than twice the amount
eaten in 1970.
The American poultry industry has matched this
change in appetite with an exponential increase
in production. In 2007, for instance, 8.9 billion
chickens were raised and sold as food in the
United States, a jump of more than 1,400 percent
since 1950. At the same time, chicken farms
have mushroomed in size; by 2006, a typical
operation produced an average of 605,000 birds
in vast buildings of 20,000 square feet or more.
Meanwhile, the number of individual farms raising
chickens for food has plummeted by 98 percent
in just over half a century. This transformation
of the industry has been accompanied by an
environmental challenge: In many cases, these
large poultry farms pose major pollution problems
for regional communities.
The Pew Environment Group’s new report,
“Big Chicken: Pollution and Industrial Poultry
Production in America,” describes how the
industrialization and consolidation of the poultry
business have concentrated production in what
is now known as the Broiler Belt. In this area,
which extends from eastern Texas through the
Joshua S. Reichert
Managing Director
Pew Environment Group
July 27, 2011
southeastern United States and north to Maryland
and Delaware, chickens outnumber people by as
much as 400 to 1.
The waste produced by these concentrated
poultry operations raises serious concerns about
treatment and disposal, particularly along the
shores of the largest estuary system in the United
States, the Chesapeake Bay. The 523 million
chickens produced each year in just Maryland
and Delaware generate roughly 42 million cubic
feet of chicken waste—enough to fill the dome
of the U.S. Capitol about 50 times, or almost
once a week.
Traditionally, farmers have managed this manure
by spreading it on fields. But the combination
of industrial-level production and the diminishing
amount of cropland in these two states has
resulted in more manure than crops can use, and
the excess flows untreated into the streams and
rivers that feed into the Chesapeake.
“Big Chicken” examines 50 years of data to take
a fresh look at industrial poultry production and
to make policy recommendations for managing
chicken waste to mitigate its toll on our land and
water. For more information about this serious
problem, I encourage you to visit us at www.
PewEnvironment.org/BigChicken.
Source Information
Broiler numbers and acreage were taken from
the U.S. Department of Agriculture’s Census of
Agriculture, a five-year survey of American farms.
Data were gathered from the most recent Census
of Agriculture (2007) and from 2002, 1997, 1992,
1987, 1982 and 1978, for each state and for each
Maryland and Delaware county. For a historical
perspective, Pew also gathered data at the state
level from the 1950 Census of Agriculture. For each
state and county, data were gathered from each
of the censuses under the following categories:
Broilers and Other Meat-Type Chickens Sold;
Broiler Operations With Sales; and Total Cropland,
which includes cropland harvested, cropland
used only for pasture or grazing, cropland idle or
used for cover crops or soil improvement but not
harvested and not pastured or grazed, cropland
on which all crops failed or were abandoned, and
cropland in cultivated summer fallow.
In some instances, USDA does not disclose the
number of operations with sales at the state and/
or county level so as not to identify individual
farms within an area. This absence of data does
not signify that the state or county is not a
potential home to broilers or broiler operations.
States or counties in which these data were not
disclosed are not represented on the relevant
maps, however.
State population data cited in the report are taken
from the U.S. Census Bureau’s 2010 Census.
© The Pew Environment Group | Washington, D.C. | www.PewEnvironment.org
July 2011
The Pew Campaign to Reform Industrial Animal Agriculture
Joshua S. Reichert, Managing Director, Pew Environment Group
Karen Steuer, Director, Government Relations, Pew Environment Group
Velma Smith, Officer, Government Relations, Pew Environment Group
Robert Martin, Senior Officer, Reforming Industrial Animal Agriculture
Julie Janovsky, Manager, Reforming Industrial Animal Agriculture
Micaela Fischer, Senior Associate, Reforming Industrial Animal Agriculture
Acknowledgments
We would like to thank our many Pew Environment Group colleagues who contributed to this report:
Adam Enatsky, Carol Hutchinson, Elizabeth Jennings, Alicia LaPorte, Jonathan Meyers, Jessica O’Neal,
Mallory Shelter, Amanda Teuscher, Jerry Tyson and Liz Visser. We also thank Juan Thomassie for graphics
and Albert Berces for report design. We owe special thanks to our colleague Pete Janhunen and to
Jamie Shor for their assistance with communications.
The Pew Environment Group
The Pew Environment Group is the conservation arm of The Pew Charitable Trusts, a nongovernmental
organization that works globally to establish pragmatic, science-based policies that protect our oceans,
preserve our wildlands and promote clean energy.
CONTENTS
01
03
04
05
06
08
09
15
22
24
28
Overview
More Chickens, Fewer Farms
A Frenzy of Consolidation
Diminishing Options for Contract Growers
Bigger and Faster
Geographic Consolidation
Big Chicken, Big Waste
The Chesapeake Bay—Front and Center
Conclusion and Recommendations
Endnotes
Glossary
Pollution and Industrial Poultry Production in America
BIG CHICKEN
B I G C H ICK E N
Pollution and Industrial Poultry Production in America
www.PewEnvironment.org
OVERVIEW
In nuggets, wings or strips, destined for the grill
or cooked in the store, chicken is an American
favorite. According to the American Meat Institute,
chicken has become the No. 1 source of meat
consumed by Americans, surpassing beef and
pork by a significant margin.
1
This shift in demand has been accompanied
by a major change in how and where chickens
are produced in the United States. As poultry
consumption has grown, the number of
businesses that raise the animals has dropped
significantly, and the nature and geography of
those operations have also changed.
In just over 50 years, the number of chickens
produced annually in the United States has
increased by more than 1,400 percent while
the number of farms producing those birds has
dropped by 98 percent. In 2011, a historically
small number of operations, controlled by even
fewer meat processing companies, known as
integrators, dominates the production of American
chicken. The size of individual operations has
grown just as dramatically, and now the typical
broiler chicken—a chicken raised for its meat—
comes from a facility that produces more than
600,000 birds a year. These large-scale operations
occupy a limited geographic area known as the
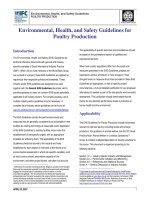
U.S. Per Capita Meat Consumption
100
90
80
70
60
50
40
30
20
10
0
1970 1972 1974 1976 1978 1980 1982 1984 1986 1988 1990 1992 1994 1996 1998 2000 2002 2004 2006 2008
P O U N D S
Chicken
Beef
Pork
Turkey
Source: USDA Economic Research Center, Food Availability Data System, Feb. 1, 2010.
02
B I G C H ICK E N
Pollution and Industrial Poultry Production in America
The Pew Environment Group
inadequate policies and practices that govern
industrial poultry production are reformed,
environmental challenges will grow as broiler
production continues to rise.
The Pew Campaign to Reform Industrial Animal
Agriculture recommends the following changes:
• Caps on total animal density.
• Shared financial and legal responsibility for
proper waste management between farmers
and corporate integrators.
• Monitoring and regulation of waste transported
off concentrated animal feeding operation
(CAFO) sites.
• A requirement that all medium and large CAFOs
obtain Clean Water Act permits.
Industrial poultry production presents a host of
concerns not addressed in this report. These
include the overuse of antibiotics, pollution
caused by egg production, air quality problems
and the relationship between large corporations
and contract farmers. The Pew Charitable Trusts
will examine some of these issues in future reports.
American Broiler Belt. In many instances, they
pose difficult environmental challenges for nearby
and downstream communities.
Industrial poultry operations generally dispose
of broiler waste by spreading it on open fields
or cropland. However, many of them have little
cropland associated with their facilities. As a
result, an increasing number of farms and
counties have more manure than can be used
by local crops, and pollution problems occur
when excess nutrients from manure are washed
off the land and into local streams, rivers and
other bodies of water. Nowhere has this problem
of concentrated poultry production and manure-
associated pollution become more evident than
in the Chesapeake Bay region.
The poultry industry has evolved into a
streamlined system of industrial mass production.
But the requirements for responsible waste
treatment and disposal have not kept pace,
and today’s 600,000-bird production factories
continue to be regulated like the small family
farms they no longer resemble. Unless the
Photo: David Harp
» Broiler chickens on the Delmarva Peninsula often spend their short lives in cavernous buildings.
03
B I G C H ICK E N
Pollution and Industrial Poultry Production in America
www.PewEnvironment.org
plants traded with one another in a system
of open, often local markets. Farmers raising
chickens for meat would sell to those who offered
the best prices. In 1950, more than 1.6 million
farms spread across the country were growing
chickens for American consumers. By 2007, fully
98 percent of those chicken farms were gone,
despite the fact that Americans were consuming
even more chicken—more than 85 pounds per
person per year, according to the U.S. Department
of Agriculture (USDA).
4
Over that same period,
broiler sales jumped by 8 billion birds, or more
than 1,400 percent.
During the early part of the 20th century, chickens
were raised on small farms throughout the United
States, and their meat was principally a byproduct
of the egg industry. However, production of broilers—
young chickens raised specifically for meat—nearly
tripled between 1940 and 1945,
2
in part because
poultry, unlike beef, pork, veal and lamb, was not
rationed during World War II. The availability of
chicken encouraged consumption, as did research
and technology developments that allowed the
emerging broiler industry to expand rapidly.
3
As the industry took hold, independent feed
mills, hatcheries, producers and butchering
MORE CHICKEN,
FEWER FARMS
Photo: Jane Thomas
» These poultry houses are a short distance from the Chester River on Maryland’s Eastern Shore.
04
B I G C H ICK E N
Pollution and Industrial Poultry Production in America
The Pew Environment Group
A FRENZY
OF CONSOLIDATION
As commercial opportunities for chicken meat
sales expanded, the structure of the industry
began to change. By the early 1940s, a few feed
dealers who wanted to broaden the market began
extending credit to farmers raising chickens and
then accepting payment when the birds were sold
to processing plants. These types of arrangements
marked the beginning of a consolidation process
in which a single entity gained control over
various aspects of poultry production. In the early
years of this “vertical integration,” feed store
owners held a level of control at the front end of
poultry production. A short time later, the meat
processing companies took control further along
the production chain. Today known as integrators,
such companies now control virtually all aspects
of the business, from breeding of chicks, through
processing and retailing, and often transporting a
wide range of poultry products to grocery stores
and restaurants.
In the past, as now, an integrator would attempt
to ensure a supply of chickens sufficient to keep
larger and larger processing plants running close
to or at capacity. But rather than raising the
chickens, integrators contracted with individual
growers to manage their flocks.
By the mid-1950s, the broiler industry had
transformed from an open-market system to
one that would come to define industrial animal
production: extensive vertical integration, based
almost exclusively on contracts with farmers
for raising the birds.
5
According to the USDA,
95 percent of broiler producers in 1950 were
independent; five years later, the number of
independent growers had plummeted, accounting
for only 10 percent of broiler production. At that
point, 88 percent of broilers were produced
under contract, and 2 percent were produced in
company-owned broiler facilities.
6
In pursuit of further efficiencies and profits,
integrators engaged in a frenzy of consolidation
throughout the 1950s and 1960s. Many of the
independent poultry-producing businesses closed
or were bought out by the integrators. These
larger entities could coordinate production
at each stage to avoid either overproduction
or shortages and could purchase medicine,
equipment and other supplies at bulk discounts.
Photo: David Harp
» Chickens are processed for market
at a Delaware plant.
05
B I G C H ICK E N
Pollution and Industrial Poultry Production in America
www.PewEnvironment.org
DIMINISHING
OPTIONS
FOR CONTRACT
GROWERS
Today, integrators generally breed their own
chickens, not only to achieve the desired level
of quality and characteristics that allow rapid
weight gain with minimal feed, but also to
produce birds of a uniform size that can be
slaughtered, packaged and processed by machine
rather than individually cut and prepared. The
integrator chooses when to deliver chicks to a
contract grower and when to collect grown birds
for delivery to a processing facility.
Contracts between the integrators and individual
growers typically specify that the integrators provide
the chicks, the feed and veterinary services as well
as other management direction. The growers provide
the labor and chicken houses built to integrators’
specifications and generally are responsible for
water and fuel for heating, management of manure,
and disposal of other waste, including dead birds.
7
Under common contract terms, the grower
does not own or sell the birds and is not paid
on a straightforward measure of weight and
quality. Instead, the grower is paid for services
and must follow the integrator’s directions as
stipulated in the contract and provided by the
integrator’s field staff. Although the grower
may hold a mortgage on poultry houses in
the range of a quarter million dollars or more,
the contract frequently lasts only as long as
it takes to raise a flock of chickens—in some
cases, a matter of weeks.
8
Numerous integrators
compete for broiler sales in the national retail
food and restaurant market, but one firm often
will dominate a growing region or territory.
Growers rarely receive multiple competitive
contract offers.
9
Photo: David Harp
» Newly hatched chickens don’t yet fill a Delmarva poultry house. As they grow, they will fill it wall to wall.
06
B I G C H ICK E N
Pollution and Industrial Poultry Production in America
The Pew Environment Group
BIGGER
AND FASTER
In just over 50 years, the number of chickens
produced annually in the United States has
increased by more than 8 billion birds—a 1,400
percent increase—while the number of broiler
farms has plummeted from more than 1.6 million
in 1950 to just over 27,000 in 2007, a 98 percent
decline. These seemingly conflicting statistics
result from the shifting of poultry production
from traditional farms to an industrialized system
of processing plants served by massive growing
operations that produce not only more chickens,
but bigger chickens at a faster rate.
U.S. Broiler Farms: What They Produce
1950 1978 1987 1997 2007
Farms
10
1,636,705 31,743 27,645 27,737 27,091
Chickens
581,038,865 3,062,154,490 4,361,975,630 7,366,526,456 8,914,828,122
Unknown under 200,000,000 200,000,000 to 399,999,999 400,000,000 to 599,999,999 600,000,000 to 799,999,999 800,000,000 and over
Numbers of Broiler Chickens Per State—1950 and 2007
1950 2007
Source: USDA Census of Agriculture
Source: USDA Census of Agriculture
07
B I G C H ICK E N
Pollution and Industrial Poultry Production in America
www.PewEnvironment.org
mortgages to pay for the initial investment and
to finance upgrades required by new contracts.
11
With the development of these large-scale
concentrated animal feeding operations (CAFOs),
barnyards have virtually disappeared, and many
of today’s broiler operations have little land
associated with them, other than land for the
chicken houses and access roads. A 2009 USDA
report noted that one-third of modern broiler
operations have no associated cropland.
12
This
lack of associated cropland can have a profound
impact on pollution and waste management.
Today, the number of birds raised by a single
industrial poultry operation is staggering.
According to a USDA report, the typical broiler
in 2006 came from an operation that produced
about 605,000 birds a year, compared with an
operation producing 300,000 birds a year in 1987.
The same report noted that whereas a typical
chicken house built in the 1960s was about
12,750 square feet, newer houses average more
than 20,000 square feet, and large houses built
in 2005 and 2006 were larger still—up to 36,000
square feet. Increasingly, individual growers
rely on multiple houses, and many carry large
Percentage of Broiler Operations by Size—1987 and 2007
19872007
90%
80%
70%
60%
50%
40%
30%
20%
10%
0%
500,000 broilers or more
300,000 to 499,999
200,000 to 299,999
100,000 to 199,999
60,000 to 99,999
90%
80%
70%
60%
50%
40%
30%
20%
10%
0%
Operations with:
Delaware
Delaware
Arkansas
Arkansas
Maryland
Maryland
Georgia
Georgia
» The size of
individual broiler
operations has
soared in recent
decades in the
United States.
Source: USDA Census of Agriculture
08
B I G C H ICK E N
Pollution and Industrial Poultry Production in America
The Pew Environment Group
GEOGRAPHIC
As vertical integration of broiler production
was developing in the early 1950s, the poultry
industry began to form a distinctive geographic
footprint. Development of poultry regions was
driven by a desire to limit the transportation
costs for chicks, feed and live broilers
13
and,
according to some agricultural historians, by a
cultural acceptance of the evolving contracting
practices in some areas.
14
By the late 20th century,
most broiler farms were under contract to a single
nearby processor.
15
Today, virtually all commercial
broiler production is carried out under contract,
generally within 25 to 35 miles of processing
and feed mills.
16
The Delmarva Peninsula on the Eastern Shore of
the Chesapeake Bay, with its proximity to large
markets in New York and Philadelphia, became
one of the first major poultry centers.
17
During
World War II, the poultry facilities in this slice
of Delaware, Maryland and Virginia focused on
feeding the troops, so the industry began to
grow and consolidate elsewhere. In the Southern
states, cotton-weary land, a ready supply of low-
wage workers, a history of sharecropping and a
landscape of small, privately owned parcels of
land made the region prime for contract broiler
production.
18
Thus developed the Broiler Belt,
an area extending from eastern Texas through
Arkansas, Alabama, Georgia and much of the
Southeast and north to Maryland and Delaware.
Today, the Broiler Belt has areas where chickens
far outnumber people. Delaware, for example,
produces roughly 270 chickens per person;
Mississippi, 275; and Arkansas, 400.
CONSOLIDATION
State
2007 Broilers
(sales in head)
Percent of
U.S. Total
Georgia
1,398,912,031 16%
Arkansas
1,171,556,369 13%
Alabama
1,016,230,625 11%
Mississippi
823,427,574 9%
North Carolina
781,416,896 9%
Texas
616,299,999 7%
Kentucky
309,769,263 3%
Maryland
296,373,113 3%
California
280,512,754 3%
Missouri
279,937,641 3%
Virginia
249,184,367 3%
Delaware
246,098,878 3%
Oklahoma
242,228,335 3%
South Carolina
236,209,584 3%
Tennessee
206,132,684 2%
Source: USDA Census of Agriculture
09
B I G C H ICK E N
Pollution and Industrial Poultry Production in America
www.PewEnvironment.org
BIG
BIG
CHICKEN,
WASTE
As broiler production increases, so does the
production of the industry’s major waste product:
chicken manure. Broiler litter—the mix of manure
and bedding taken out of broiler houses—must
be disposed of. Although possible uses for the
litter, from biofuel to cattle feed,
20
have been
explored over the years, the majority is still
handled as it was decades ago: It is spread on
farm fields to enrich soil and fertilize crops.
21
High in nutrients needed by crops, particularly
nitrogen and phosphorus, broiler litter can be
The geographic consolidation of the broiler
industry, which is more pronounced in certain
regions of the Broiler Belt, such as northern
Georgia, northern Alabama, eastern Maryland
and southern Delaware, has advantages for meat
processors but also carries a serious downside.
As the USDA noted in a 2003 report, “Ever-
growing numbers of animals per farm and per
acre have increased the risk of water pollution.”
19
The pollution problem has its roots in a simple
combination of biology, geography and arithmetic.
Continued on Page 11
» Chicken manure is piled in a field in Sussex County, Del., where it will be spread as fertilizer for crops.
Photo: Robert Bennett
10
B I G C H ICK E N
Pollution and Industrial Poultry Production in America
The Pew Environment Group
Excess
Nutrients
Oxygen
Low
Oxygen
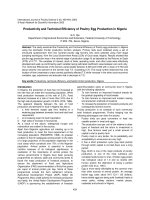
Nutrients such as nitrogen and phosphorus cycle naturally
through the environment in various forms and—at the
right levels in the right places—help sustain plant and
animal life. They can cause serious degradation of water
resources, however, when excessive amounts enter lakes,
rivers, estuaries and other bodies of water.
Excess nutrients in water set off a chain reaction called
eutrophication that starts with acceleration of algae growth
and can lead to serious loss of aquatic life, beach closures,
shellfish contamination and dramatic seasonal dead zones.
The algae may be noxious or even toxic, and its presence
on the water surface can block sunlight and lead to loss of
important underwater grasses that provide habitat for fish
and other organisms. The algae’s decomposition, in turn,
uses up oxygen needed to sustain aquatic life.
Dissolved oxygen is one important measure of the health of
a water body. If oxygen levels drop too low, fish, crabs and
other living things will be affected, experiencing growth
or reproductive impairments or even death. The problems
with low dissolved oxygen can be most pronounced in
deeper waters and often occur during summer months,
at the same time that shallow waters become too warm
for some species. The amount of nutrients reaching U.S.
waters has increased dramatically over the past 50 years.
27
NUTRIENTS IN
THE WATER:
Too Much of a Good Thing
Illustration: Berces Design
» Excess nutrients in chicken manure can run off farm fields into the water, leading to
algae growth, oxygen depletion and loss of aquatic life.
11
B I G C H ICK E N
Pollution and Industrial Poultry Production in America
www.PewEnvironment.org
Depending upon soil and other environmental
factors, some practices employed to keep
nutrients from running off the land in rainstorms
simply route those pollutants into groundwater
and from there to receiving streams.
24
Research
indicates that this may be the case in certain
coastal areas, including the Chesapeake Bay
region, where nearly half of the nitrogen flowing
into the bay from nontidal streams comes
from groundwater, and where well monitoring
shows increasing levels of nitrates in deeper
groundwater.
25
In 2011, the National Academy
of Sciences noted that soil phosphorus on the
Delmarva Peninsula is an order of magnitude
greater than what crops need.
26
This “legacy
phosphorus” associated with broiler litter
application, warned the report authors, can mean
trouble for the bay for years to come.
Out of Balance
Compared with commercial fertilizers, nutrient-
rich litter can be a less expensive alternative for
fertilizing cropland or turf, but its management
has proven to be particularly challenging. As
a result, broiler litter in the Broiler Belt is a
an effective fertilizer. But when overused, poorly
managed or inappropriately timed, the nutrients
in poultry manure can cause significant water
quality problems.
All livestock manure contains nitrogen and
phosphorus, but poultry manure often has
a higher nutrient content than other types of
manure, and those nutrients may not be present
in the proportions needed by crops. Broiler litter
frequently contains phosphorus and nitrogen in
similar ratios,
22
but many crops require far less
phosphorus than nitrogen. When farmers follow
long-standing practices and apply broiler litter
based on a crop’s nitrogen needs, they over-
apply phosphorus.
For many years, agricultural experts suggested that
such overapplication was not a serious problem,
because phosphorus moves into water mainly
by being attached to sediment. Effective erosion
control practices, they reasoned, could keep excess
phosphorus on the land. After years of studying
the movement of nutrients in the environment,
however, scientists now know that a buildup of
excess phosphorus in the soil can eventually result
in additional phosphorus release into water.
23
Number of Broiler Chickens Per Acre of Cropland—1950 and 2007
Unknown under 25 25 to 49 50 to 99 100 to 199 200 and over
1950 2007
Continued From Page 9
Source: USDA Census of Agriculture
12
B I G C H ICK E N
Pollution and Industrial Poultry Production in America
The Pew Environment Group
The density of chickens in Maryland and Delaware
is strikingly high. In 2009, the two states produced
523.4 million broilers—6 percent of the entire
country’s production on less than 0.5 percent
of its landmass.
30
Assuming that 1,000 broilers
produce roughly 81 cubic feet of litter,
31
the 2009
broiler population for the two states generated
over 42 million cubic feet of litter—enough to fill
the U.S. Capitol dome nearly 50 times.
32
Looking more specifically at cropland, where
much of the manure will go, the disparity appears
even greater. Delaware is on the extreme end
of this scale with a reported 423,773 acres
of cropland and 246.1 million broilers sold in
2007, or 581 chickens per acre of cropland. By
comparison, Arkansas, with 8.4 million acres of
cropland, produced 1.2 billion broilers in 2007,
or about 140 chickens per acre of cropland.
Unintended Consequences
Rough calculations of per-acre manure volume
are not necessarily indicative of pollution issues,
but agricultural experts have warned of a growing
problem of excess manure.
In 2000, the USDA published an extensive
analysis of trends in the generation of livestock
manure, determining levels of “excess manure”
nutrients at the farm and county levels.
33
This
analysis covered the years from 1982 to 1997,
and while it has not been updated with the most
recent agricultural census data, even at that time
it raised serious concerns about the unintended
consequences of agricultural consolidation.
The USDA report showed that small and medium-
size livestock farms were being “replaced by
large operations at a steady rate,” that livestock
populations had become “more spatially
concentrated in high-production areas” and
that poultry had the highest densities compared
product in serious oversupply, in many instances
becoming a liability rather than an asset.
28
Still,
individual growers—not the large, well-capitalized
integrators—remain primarily responsible for
managing the litter and its disposal.
29
Broiler and manure production on the Delmarva
Peninsula is a case in point. Although the Delmarva
is no longer the country’s top broiler producing
region, Delmarva growers raise large numbers of
broilers and produce massive amounts of waste
in smaller areas with limited cropland than do
their southern counterparts.
DE
NJ
VA
MD
Under 50
50 to 124
125 to 249
250 to 499
over 500
Density of Broiler Chickens Per
Acre of Cropland on Delmarva, 2007
Source: USDA Census of Agriculture
13
B I G C H ICK E N
Pollution and Industrial Poultry Production in America
www.PewEnvironment.org
Poultry
Feedlot Beef
Swine
Dairy
61%
60%
18%
15%
7%
18%
16%
5%
USDA said, the poultry sector, which accounts for
only 15 percent of the total number of confined
animal operations, produces the most total
nutrients of any livestock sector.
37
Poultry and Pollution
Nutrients are found not only in broiler litter and
other livestock manure, but also in commercial
fertilizers, municipal wastewater discharges,
storm water and even runoff from forested land.
As a result, the question of how much pollution
is directly tied to animal manure, let alone broiler
litter, is not easy to answer. Although it is clear
that no one to date has a definitive estimate of
poultry’s share of pollution, it is also clear that
major poultry-producing regions show evidence
of water quality impacts.
In Georgia, for example, University of Georgia
researchers found in 2002 that 13 counties in the
state had excess phosphorus in the soil. Of those,
10 were areas where poultry was concentrated.
38
Less than a decade earlier, only four counties had
been identified as having excess phosphorus. A
1999 study by the U.S. Geological Survey (USGS)
with all livestock for all years. The analysis also
showed a “dramatic increase” in poultry density
between 1982 and 1997. More importantly,
the report linked the spatial concentration to
“increased problems with the use and disposal
of animal waste” and found that such problems
had become more widespread with the shift to
fewer but larger livestock operations.
With access to data on farm animal numbers,
information on manure characteristics and more
specific information on types of cropland, the
USDA researchers analyzed the nutrient needs
of local crops. That approach allowed them to
estimate the ability of farmland to effectively
utilize the manure nutrients. They found that
an increasing number of farms and counties
had more manure than could be used by local
crops, and of the 1.5 billion pounds of excess
nutrients found on farms, more than half were
associated with poultry.
34
As the USDA pointed out, poultry manure generally
contains two to four times more nutrients than is
contained in manure of other livestock types,
35
and 40 percent of U.S. broiler production occurs
on farms without any crop acreage.
36
In fact, the
Nitrogen Phosphorus
Excess Nutrients: Where They Come From
Source: USDA
14
B I G C H ICK E N
Pollution and Industrial Poultry Production in America
The Pew Environment Group
With strong evidence of water problems linked
to overapplication of poultry manure on area
cropland, the city and the utility were able to reach
a settlement that altered common practices.
42
Today, new requirements for nutrient management
planning have been put in place in the watershed,
including lower limits on the amount of
phosphorus that may be applied to the land,
along with a court-supervised program of soil
testing and monitoring as well as tracking of
manure shipments. Because excess nutrients had
already built up in the environment, however,
water quality has not improved to the extent
anticipated.
43
In fact, in 2005, the Oklahoma
attorney general sued 14 Arkansas poultry
companies seeking compensation for damage
to the Illinois River.
44
found high levels of phosphorus in Georgia’s West
Fork Little River, again in areas with intensive
poultry production.
39
Another area where broiler growth and
concentration have been accompanied by water
pollution problems lies in northwestern Arkansas
and eastern Oklahoma. In the Eucha and Spavinaw
watersheds within this poultry-rich region, nearly
44 million chickens were produced in roughly
2,450 chicken houses in 2010.
40
Here as elsewhere,
the waste disposal practice has been for broiler
litter to be spread on cropland. Over time, this led
to major problems with algal blooms, which in turn
degraded drinking water supplies. When voluntary
measures to curb out-of-control nutrient pollution
failed, Tulsa and its Metropolitan Utility Authority,
which supplies drinking water to Tulsa and more
than a dozen other cities, went to court for relief.
41
Photo: David Harp
» Chicken houses and soybean crops share space on a farm on Maryland’s Eastern Shore.
15
B I G C H ICK E N
Pollution and Industrial Poultry Production in America
www.PewEnvironment.org
stem the loss of Chesapeake Bay resources
such as rockfish, blue crabs and oysters and to
reverse a trend of increasingly large seasonal
dead zones. Scientists studying the bay also
determined the dissolved oxygen levels required
to sustain its living resources, with specific goals
set for different areas, such as fish spawning and
nursery locations, open water and shellfish areas.
Despite a prolonged and wide-ranging cleanup
effort, nutrient reduction goals have not been
reached, and the bay still shows the effects
of excess nutrients. An analysis of biological
monitoring data indicates that more than half of
the streams in the watershed are rated as “poor”
or “very poor,” bereft of snails, insects and other
low-level organisms critical to a healthy aquatic
On the eastern edge of the Broiler Belt, problems
with overapplication of manure and the buildup
of pollutants in the environment have come to
the fore in a tense public debate.
Seven states, the District of Columbia and the
Environmental Protection Agency (EPA) are
working together to restore the Chesapeake
Bay with a precedent-setting but controversial
“pollution diet” for the nation’s largest estuary.
The livestock industry, including the poultry
industry, is arguing against a recent uptick in
the pace of cleanup efforts and the involvement
of federal regulators in protecting the bay.
More than two decades ago, scientists recognized
that dramatic reductions in the discharge of
nutrients and sediment would be required to
Photo: Paul Souders/PhotoLibrary
» Annapolis, Md., is a popular gateway to the Chesapeake Bay, the nation’s largest estuary.
FRONT AND CENTER
THE CHESAPEAKE BAY
16
B I G C H ICK E N
Pollution and Industrial Poultry Production in America
The Pew Environment Group
Western
Branch
Elizabeth River
Southern
Branch
Elizabeth River
Eastern
Branch
Elizabeth
River
Lafayette River
Lynnhaven River
Appomattox River
Upper James River
Lower
Pamunkey
River
Upper Pamunkey River
Lower
Mattaponi
River
Upper Mattaponi
River
Middle Pocomoke River
Upper Rappahannock River
Upper Pocomoke River
Wicomico River
Middle
Patuxent
River
Upper Nanticoke River
Western
Branch
Upper Potomac
River
Anacostia
River
Upper
Patuxent
River
Upper Choptank
River
Upper Chester River
C&D Canal
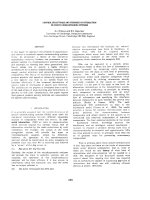
0% – 50%
51% – 75%
76% – 90%
91% – 99%
100% (PASS)
No Data
Source: U.S. Geological Survey
#
#
#
#
#
Nor folk
Richmon d
Sal isbur y
Wa shing ton
Balt imore
#
UTM Zone 18N, NAD 83
Dissolved Oxygen (June - September, 2008 - 2010)
Percent of Goal Achieved (3 Year Analysis)
Created by HW, 03/09/11
Percent of Goal Achieved
All Uses, Summer Period
0 25 5012.5 Kilometers
0 25 5012.5 Miles
Chesapeake Bay Program
A Watershed Partnership
» The red color in the map below indicates the portions of the Chesapeake Bay with
low dissolved oxygen levels in summertime.
17
B I G C H ICK E N
Pollution and Industrial Poultry Production in America
www.PewEnvironment.org
attributable in part to the leaching of manure
pollutants into groundwater that feeds the river.
Such a buildup in the groundwater could deliver
pollutants to rivers and streams for years to
come, as occurred in other areas, such as the
Suwannee River Basin of Florida.
51
A Lagging Regulatory Response
In theory, large livestock facilities have been
regulated under the Clean Water Act for more than
a quarter of a century. In practice, the regulatory
impact of the law on the broiler industry and its
enormous waste generation has been minimal at
best, even in sensitive watersheds such as the
Chesapeake Bay.
The modern-day Clean Water Act is widely
credited with helping achieve dramatic reductions
in water pollution across the country. Although
the 1972 law’s ambitious goals of “zero discharge”
and “fishable, swimmable waters” have not been
achieved in many areas, the quality of U.S. waters
has improved dramatically from the days before
the law, when fish kills were commonplace and
an oil slick floating on Ohio’s Cuyahoga River
burst into flames.
52
Many environmental policy analysts say the
workhorse of the Clean Water Act has been the
National Pollution Discharge Elimination System
(NPDES) permit program, the section of the law
that requires permitting or licensing of discrete or
“point sources” of pollution.
53
Those permits, which
may include specific limits on the concentration
of pollutants associated with a facility, frequently
compel the use of certain cleanup or control
technologies and foster application of what
amounts to good housekeeping practices to
prevent violations of permit terms.
There is also broad agreement, echoed forcefully
in a recent report from federal and state water
regulators,
54
that the law’s approach to diffuse or
environment.
45
In 2009, the percentage of tidal
tributaries and bay segments meeting dissolved
oxygen goals was under 12 percent.
46
(The red
color in the map on the opposite page indicates the
portions of the Chesapeake Bay with low dissolved
oxygen levels in summertime from 2008 to 2010.)
Agriculture is by no means solely responsible for
all of the bay’s problems, but despite years of
voluntary and taxpayer-subsidized programs to
curb farm-generated pollution, agriculture remains
a significant source of the bay’s nutrients.
47
In
May 2010, the EPA reported that an estimated
19 percent of excess nitrogen and 26 percent
of excess phosphorus were directly linked to
animal manure in the watershed.
48
Because there
is no comprehensive water quality monitoring
for runoff from manured cropland, the specific
estimates, generated by a sophisticated and
widely reviewed bay model, are subject to
some debate, but one conclusion remains clear:
Agriculture, particularly animal agriculture, will
have to do more to protect the bay.
According to a new USDA report, the vast
majority of bay cropland fertilized with manure
is not being managed properly to reduce the
loss of manure nutrients to the environment.
49
This report, assessing the impact of agricultural
conservation practices, found that roughly 38
percent of cropland in the watershed is fertilized
with manure and that those acres have, on
average, twice the nitrogen runoff of acres not
being fertilized with manure. The same report also
found that phosphorus losses were particularly
high for cropland receiving manure.
An analysis of nutrient trends in the bay by the
USGS shows modest yearly declines in nutrients
overall but increasing levels of nutrients along
two river segments, including the Choptank on
Maryland’s Eastern Shore.
50
This river, which runs
through the Delmarva poultry region, shows
increasing levels of nitrogen, which may be
18
B I G C H ICK E N
Pollution and Industrial Poultry Production in America
The Pew Environment Group
In 2003, the EPA issued regulations to cover
dry-manure broiler operations and move toward
addressing the issues of land application of
manures. Finalized in 2008, the regulations
called for permitting of large dry-manure broiler
operations and other CAFOs and, for the first
time, set requirements for land application of
manure generated by those facilities. Growers,
but not integrators, were required to address
management of animal production areas, properly
handle the storage of both wet and dry manure
and, again for the first time, develop and follow
nutrient management plans to control the loss of
nitrogen and phosphorus from the fields where
manure was applied. The latter requirement
applied only to land “under the control” of the
permit holder, and manure that left the facility
was not subject to the permit requirements.
Implementation of the rule has been less than
seamless. The EPA has no nationwide inventory
of CAFO operations,
55
and court rulings have
complicated efforts to ensure that all operations
likely to create water quality problems are, like
many other businesses managing waste, covered
by permits.
56
The National Chicken Council, several
of the large integrators and others have resisted
efforts to require Clean Water Act permits or place
new restrictions on land application of manure.
Today, it is unclear just how many facilities will
actually be subject to enforceable permits.
Multiple Strategies, Modest Results
Over the years, a variety of other efforts outside
the Clean Water Act have been put in place to
deal with pollution from poultry operations and
other CAFOs.
Virginia, for example, passed legislation in 1999
requiring poultry operations with more than
20,000 broilers to acquire special state permits
and implement nutrient management plans for
“non-point” pollution sources, such as cropland
runoff, has been far less effective. In many bodies
of water, uncontrolled non-point pollution now
dominates pollutant flows and remains the
primary obstacle to cleanup.
Although the law designates CAFOs as point
sources, it also specifically exempts “agricultural
stormwater” from the permitting requirements. In
essence, then, large livestock operations have
been given a unique and arguably ineffective dual
regulatory status: regulated as point sources for
waste in broiler houses and storage areas, but
treated differently when that same waste runs
off the cropland where it is applied.
In the mid-1970s, the EPA, in keeping with the
approach used for other pollution sources, issued
industry-specific regulations for CAFOs. These
rules addressed leaks and spills from the storage
of liquid manures in production areas but did not
address management of manure used to fertilize
crops. They also specifically excluded poultry
facilities, such as most broiler operations, that
manage and store manure in a dry state.
Photo: David Harp
» Populations of blue crabs in the Chesapeake Bay
have suffered from pollution related to sediments
and nutrients flowing into the bay.
19
B I G C H ICK E N
Pollution and Industrial Poultry Production in America
www.PewEnvironment.org
from operations that could not use the waste
as fertilizer.
61
About 15 percent of the program
costs were picked up by the poultry integrators.
In 1997, after an outbreak of the toxic marine
organism Pfiesteria killed thousands of fish and
sickened several watermen and others,
62
Maryland
took action to address the excess nutrients that
appeared to be a catalyst for the costly episode.
The Maryland Water Quality Improvement Act
requires nearly all manure users to develop plans
for the appropriate use of nutrients.
63
Recent
reports from the state indicate a high level of
compliance with the initial submittal requirements
but noncompliance related to updating and
implementing the plans.
64
Delaware followed suit
with plan requirements in 1999, phasing in the
mandate for plans from 2002 to 2007.
65
In these bay states and elsewhere, many
individual farmers have also taken voluntary
action to control pollution. Many rely on federal
manure application.
57
Those plans were to be
based on crop needs for phosphorus rather than
the traditional and more permissive approach of
nitrogen-based application rates. Virginia’s broiler
litter transport incentive program now subsidizes
the movement of modest amounts of broiler litter
outside the Chesapeake Bay watershed.
58
In Maryland, a broader state transport assistance
program covers a variety of livestock manures and
provides special assistance to poultry growers
in four lower Eastern Shore counties on the
Delmarva.
59
Funding for the Maryland program
derives in part from general appropriations and
contributions from integrator companies.
60
Delaware, likewise, uses federal and state
funding along with money from some integrators
to move manure out of certain areas that lack
sufficient cropland. In 2009, the program, which
cost approximately $850,000, subsidized the
relocation of roughly 65,000 tons of manure
Photo: David Harp
» Chickens are caught to be placed in cages for transport to a processing facility in Delaware.