Báo cáo Y học: The membrane-bound [NiFe]-hydrogenase (Ech) from Methanosarcina barkeri : unusual properties of the iron-sulphur clusters docx
Bạn đang xem bản rút gọn của tài liệu. Xem và tải ngay bản đầy đủ của tài liệu tại đây (586.14 KB, 11 trang )
The membrane-bound [NiFe]-hydrogenase (Ech) from
Methanosarcina
barkeri
: unusual properties of the iron-sulphur clusters
Sergei Kurkin
1
,Jo¨ rn Meuer
2
,Ju¨ rgen Koch
2
, Reiner Hedderich
2
and Simon P. J. Albracht
1
1
Swammerdam Institute for Life Sciences, Biochemistry, University of Amsterdam, the Netherlands;
2
Max-Planck-Institut fu
¨
r
Terrestrische Mikrobiologie, Marburg, Germany
The purified membrane-bound [NiFe]-hydrogenase from
Methanosarcina barkeri was studied with electron para-
magnetic resonance (EPR) focusing on the properties of the
iron–sulphur clusters. The EPR spectra showed signals from
three different [4Fe)4S] clusters. Two of the clusters could be
reduced under 101 kPa of H
2
, whereas the third cluster was
only partially reduced. Magnetic interaction of one of the
clusters with an unpaired electron localized on the Ni–Fe site
indicated that this was the proximal cluster as found in all
[NiFe]-hydrogenases. Hence, this cluster was assigned to be
located in the EchC subunit. The other two clusters could
therefore be assigned to be bound to the EchF subunit,
which has two conserved four-Cys motifs for the binding of a
[4Fe)4S] cluster. Redox titrations at different pH values
demonstrated that the proximal cluster and one of the
clusters in the EchF subunit had a pH-dependent midpoint
potential. The possible relevance of these properties for the
function of this proton-pumping [NiFe]-hydrogenase is
discussed.
Keywords: Ech; hydrogenase; iron-sulphur; pH dependence;
redox properties.
Hydrogenases catalyse the simplest chemical reaction in
nature: H
2
« 2H
+
+2e
–
. They are found in wide variety
of microorganisms. Hydrogenases enable some organisms
to use H
2
as a source of reducing equivalents under both
aerobic and anaerobic conditions. In other organisms the
enzyme is used to reduce protons to H
2
, thereby releasing
the reducing equivalents obtained from the anaerobic
degradation of organic substrates [1,2]. On basis of the
transition-metal content, hydrogenases can be divided into
two major classes [3]: the [Fe]-hydrogenases [4] and the
[NiFe]-hydrogenases [5–7]. The large subunit of [NiFe]-
hydrogenases harbours the binuclear Ni–Fe active site,
which is coordinated by two conserved CxxC motifs, one
locatedintheN-terminalregionandthesecondlocatedin
the C-terminal region of the polypeptide [5]. The small
subunit of all [NiFe]-hydrogenases displays a conserved
amino acid sequence pattern, CxxCx
n
GxCxxxGx
m
GCPP
(n ¼ 61 to 106, m ¼ 24 to 61 [5]), binding one [4Fe)4S]
cluster. This cluster is within 14 A
˚
oftheactivesite[8]andis
called the proximal cluster. In most, but not all enzymes, the
small subunit contains six to eight additional cysteine
residues, which harbour two more clusters: in the Desulf-
ovibrio gigas enzyme these are a second [4Fe)4S] cluster
(distal cluster) and a [3Fe)4S] cluster (medial cluster). The
combination of the Ni–Fe active site and the proximal
[4Fe)4S] cluster seems to be important for the catalytic
action of [NiFe]-hydrogenases [7].
The study of hydrogenases in methanogens led to the
discovery of a third class of hydrogenases, not containing
any metals [9]. This class of enzyme is active only in the
presence of its second substrate, N
5
,N
10
-methenyltetra-
hydromethanopterin. There is evidence for an unknown
nonmetal prosthetic group in this enzyme [10,11]. Metha-
nogens also contain [NiFe]-hydrogenases and the expression
of the several enzymes depends on the available energy
sources [12,13]. Some time ago a membrane-bound [NiFe]-
hydrogenase was isolated from methanogenic archaea [14],
which consists of six subunits much like hydrogenase-3 of
Escherichia coli. Hydrogenase-3 in E. coli is part of the
formate-hydrogen lyase complex and is composed of seven
different subunits [15]. This hydrogenase shows surprisingly
little sequence homology with other [NiFe]-hydrogenases,
except for the conserved residues coordinating the active site
and the proximal Fe–S cluster. The enzyme showed a high
sequence similarity with the CO-induced hydrogenase of
Rhodospirillum rubrum [16,17]. The latter bacterium can
grow anaerobically on CO and its [NiFe]-hydrogenase is
thus expected to be insensitive towards CO. The same is
expected for the ÔE. coli-like hydrogenaseÕ (Ech) from
Methanosarcina barkeri [14,18]. From growth characteristics
of R. rubrum and from cell-suspension experiments with
M. barkeri, it can be inferred that the [NiFe]-hydrogenases
in these organisms probably act as a proton pumps [16,19].
Ech is the only enzyme of this subclass which has been
purified and partly characterized.
Purified Ech consists of six subunits, encoded by genes
organized in the echABCDEF operon. The EchA and EchB
subunits are predicted to be integral, membrane-spanning
proteins, while the other four subunits are expected to
extrude into the cytoplasm (Fig. 1). Amino acid sequence
analysis of the cytoplasmic subunits points to the presence
of two classical [4Fe)4S] clusters in EchF and one [4Fe)4S]
Correspondence to S. P. J. Albracht, Swammerdam Institute for Life
Sciences, Biochemistry, University of Amsterdam, Plantage
Muidergracht 12, NL-1018 TV Amsterdam, the Netherlands.
Fax: + 31 20 5255124, Tel.: + 31 20 5255130,
E-mail:
Abbreviations:Ech,membrane-boundhydrogenaseofMethanosarcina
barkeri; EPR, electron paramagnetic resonance; Hdr, heterodi-
sulphide reductase.
(Received 8 August 2002, revised 4 October 2002,
accepted 21 October 2002)
Eur. J. Biochem. 269, 6101–6111 (2002) Ó FEBS 2002 doi:10.1046/j.1432-1033.2002.03328.x
cluster in EchC. The EchE subunit belongs to the family of
the large subunits in [NiFe]-hydrogenases and shows the
characteristic binding motif for the Ni–Fe site found in the
large subunits of all [NiFe]-hydrogenases. Chemical analysis
revealed the presence of Ni, nonheme Fe and acid-labile S in
a ratio of 1 : 12.5 : 12 [18], corroborating the presence of
three Fe–S clusters. A low-potential, soluble ferredoxin
(E
0
¢ ¼ ) 420 mV) was found to be the natural donor/
acceptor of electrons for Ech [18]. Kinetic analyses revealed
that purified Ech is inactivated by O
2
and, like most [NiFe]-
hydrogenases, is inhibited by CO [18].
The biological role of Ech was recently studied using
mutational analysis [20]. There are several functions
proposed for Ech, depending on the growth conditions
and cell energy requirements. In acetoclastic methanogen-
esis, Ech catalyses H
2
formation from reduced ferredoxin,
generated by the oxidation of the carbonyl group of acetate
to CO
2
. Under autotrophic growth conditions, the enzyme
catalyses the energetically unfavourable reduction of ferre-
doxin by H
2
, most probably driven by energy-induced
reversed electron transport, and the reduced ferredoxin thus
generated functions as the low potential electron donor for
the synthesis of pyruvate in an anabolic pathway. The
reduced ferredoxin also provides the reducing equivalents
for the first step of the methanogenesis, namely the
reduction of CO
2
to formylmethanofuran.
The six subunits of Ech show a striking amino acid
sequence similarity with six subunits of proton-pumping
NADH : ubiquinone oxidoreductase (complex I) [14–16].
Complex I catalyses electron transfer from NADH to
ubiquinone and couples it to the translocation of four to five
protons across a membrane. Studies of submitochondrial
particles have demonstrated that of all the Fe–S clusters of
complex I, only two, called the clusters 2 or N-2, which are
presumably located in TYKY subunit (homologous to
EchF) [21], are directly involved in energy transduction. It is
known that the redox potential of these Fe–S clusters is pH
dependent ()60 mVÆpH unit
)1
) [22], which is rare for Fe–S
clusters. The TYKY and EchF subunits belong to a family
of polypeptides, which are found exclusively in complex I
and proton-pumping hydrogenases [23]. The amino acid
sequences of the proteins in this family are so unique and
conserved, that the two [4Fe)4S] clusters held by this
protein were proposed to function as the direct electrical
driving unit for a proton pump [23]. To delineate a possible
roleoftheFe–SclustersintheEchofM. barkeri in this
action, the electron paramagnetic resonance (EPR) and
redox properties of these Fe–S clusters were investigated.
MATERIALS AND METHODS
Purification of
M. barkeri
Ech and sample preparation
Ech was purified as described elsewhere [18]. The enzyme
was routinely dissolved in 50 m
M
Mops pH 7.0, 2 m
M
dithiothreitol and 2 m
M
dodecylmaltoside under an atmo-
sphere of 4% (v/v) H
2
. For redox titrations the concentra-
tion of dithiothreitol in the enzyme solution was reduced to
2 l
M
. The following buffers were used for redox titrations:
100 m
M
Tris/HCl pH 8.0, potassium phosphate pH 7.0,
Tris/Mes pH 6.5, or Mes pH 6.0. The standard enzyme
solution was concentrated and then diluted with new buffer;
this was repeated several times. Samples for all spectro-
scopic measurements were handled anaerobically i.e. all
operations were performed in anaerobic box at 4% (v/v) H
2
.
Membranes were obtained from cells grown on acetate at
37 °C and were prepared as described [18]. They were
suspended in 50 m
M
Mops/NaOH pH 7.0, containing
2m
M
dithiothreitol. Ferredoxin was purified as described
by Fischer and Thauer [24].
Redox titrations
Redox titrations of Ech were performed using a Pt vs.
Calomel electrode system (Radiometer, Copenhagen) in a
device analogous to that of Dutton [25]. The redox potential
was measured using a digital voltmeter RW9408 (Philips).
All redox potentials mentioned here are expressed vs. the
normal hydrogen electrode. Correction for the temperature
dependence of the reference electrode was performed as in
Ives and Janz [26]. As Ech is rapidly inactivated by O
2
,
several precautions were taken to avoid the introduction of
O
2
into the titration cell. First, the cell was flushed with
100% (v/v) H
2
(freed from traces of O
2
by passing through a
column with a Pd catalyst; Degussa, type E236P). There-
after, a solution of Ech (incubated under 100% H
2
)was
transferred anaerobically into the titration cell. Two types of
titrations were performed, one in the presence of redox dyes
and one in the absence of these dyes. In both cases the cell
was continuously flushed with a water-saturated mixture of
H
2
and He, used to adjust the redox potential in the system.
The home-built H
2
/He mixer produced mixtures from 0.1%
to 100% (v/v) H
2
[27]. In this system the potential values
read from the Pt electrode were within 10 mV of the
theoretical redox potentials calculated from the gas mixture
using the formula:
E
h
¼À
RT
F log e
pH À
RT
2F log e
log P
H
2
where R is the gas constant, F is the Faraday constant and T
is the temperature in Kelvin.
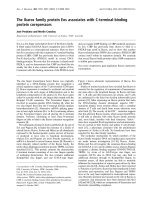
Fig. 1. Schematic representation of the possible organization of the
subunits of Ech in membranes from M. barkeri. The Ni–Fe active site in
the EchE subunit together with the proximal cluster located in EchC
subunit form the centre for hydrogen production. Two transmembrane
proteins EchA and EchB are supposed to be involved in the transfer of
protons across the membrane. The two [4Fe)4S] clusters in subunit
EchF, which is related to the TYKY subunit in bovine complex I, have
been suggested to be involved in proton translocation coupled to
electron transfer [23].
6102 S. Kurkin et al. (Eur. J. Biochem. 269) Ó FEBS 2002
In redox titrations in the presence of mediating dyes the
following dyes were present in a final concentration of
50 l
M
: 2,3,5,6-tetramethyl-p-phenylendiamine dihydrochlo-
ride (E
0
¢ ¼ +275 mV), 2,6-dichlorophenol-indophenol
(E
0
¢ ¼ +230 mV), 1,2-naphtoquinone-4-sulfonic acid
(E
0
¢ ¼ +215 mV), phenazine methosulfate (E
0
¢ ¼
+80 mV), 1,4-naphtoquinone (E
0
¢ ¼ +36 mV), methylene
blue (E
0
¢ ¼ +11 mV), duroquinone (E
0
¢(1,2) ¼ ) 5/
+35 mV), indigodisulfonate (indigo carmine; E
0
¢ ¼
)125 mV), 2-hydroxy-1,4-naphtoquinone (E
0
¢(1,2) ¼
)139/)152 (mV), lapachol (E
0
¢ ¼ )179 mV), antraqui-
none-2-sulfonate (E
0
¢ ¼ )225 mV), safranin T (E
0
¢ ¼
)289 mV), benzyl viologen (E
0
¢ ¼ )358 mV) and methyl
viologen (E
0
¢ ¼ )449 mV). All redox potentials are given at
pH 7. As some of the redox dyes have a pH-dependent
redox potential, these values are not valid for the titrations
performed at pH 6 or pH 8. However the mixture of
these dyes still covers the whole redox-potential range at pH
6 or pH 8. Also in this case the redox potentials were set by
aH
2
/He gas mixture. As this limits the potential range,
potentials higher than that of 0.1% (v/v) H
2
were achieved
by addition of aliquots of potassium ferricyanide (250 m
M
)
as oxidizing agent or, to bring the potential down again,
by aliquots of a solution of sodium dithionite (100 m
M
)
as reducing agent. After stabilization of the redox potential,
samples were withdrawn with a gas-tight syringe through
a suba-seal rubber stopper and injected into EPR tubes.
The tubes, sealed with latex tubing, were preflushed with the
same gas (mixture) of the titration cell. After filling, the
tubes were rapidly frozen by immersion in cold isopentane
(133 K).
EPR measurements
EPR spectra at X-band (9 GHz) were obtained with a
Bruker ECS 106 EPR spectrometer with a field-modula-
tion frequency of 100 kHz. Cooling of the sample was
attained with an Oxford Instruments ESR 900 cryostat
with a ITC4 temperature controller. The sample-tempera-
ture indication from this instrument was correct from
4.2 K to 100 K within ± 2% as ascertained from the
Curie dependence of a copper standard (10 m
M
CuSO
4
Æ5-
H
2
O, 2
M
NaClO
4
,10m
M
HCl). The magnetic field was
calibrated with an AEG Magnetic Field Meter. The
X-band frequency was measured with a HP 5350B
microwave frequency counter. The microwave power
incident to the cavity was measured with a HP 432B
power meter and was 260 mW at 0 dB. Simulations were
performed as described [28]. Quantification of EPR signals
was carried out by direct double integration of the
experimental spectra [29,30] or by comparison with a
good-fitting simulation.
Analysis of titration data
The midpoint potentials of the Fe–S clusters were estimated
using the amplitudes in the EPR spectra at two different
g-values: for one signal (here termed the Ôg ¼ 1.92Õ signal)
the peak at g ¼ 1.947 (see Fig. 3, trace A) was used; for a
second signal (Ôg ¼ 1.89Õ signal) the amplitude of the trough
at g ¼ 1.88 was taken. The amplitudes were plotted against
the applied potential and each data set was then fitted to the
Nernst equation:
E
h
¼ E
0
0
þð59=nÞ: log [ox]=[red]
where E
0
¢ is the midpoint potential in mV at the pH used, E
h
is the applied potential, n is the number of electrons involved
in the redox reaction.
IGOR PRO
software (WaveMetrics,
Inc.) was used for the curve-fitting analysis. Quantification
of the EPR signal to obtain the total concentration of Fe–S
clusters was performed with the samples obtained under
100% H
2
at pH 8 in the absence of redox mediators. The Ni
content of the enzyme, determined by Atomic Absorption
Spectroscopy, was used as the basis for the enzyme
concentration.
Metal content determination
Nickel was determined with an Hitachi 180-80 polarized
Zeeman Atomic Absorption spectrophotometer using either
internal standards or a standard series. The enzyme
concentrations, calculated on basis of a protein determin-
ation with the Bradford method assuming molecular mass
of 180 kDa, correlated well with the values based on the Ni
contents.
RESULTS
EPR properties of Fe–S clusters in Ech
EPR spectra of purified Ech. A sample of the purified
enzyme equilibrated with 4% (v/v) H
2
,eitherinMes
buffer at pH 6.0, or in Mops buffer at pH 7.0, showed
signals only in the g ¼ 2.3 to g ¼ 1.8 region, apart from a
small g ¼ 4.3 signal due to high-spin 3d
5
metal ions in a
rhombic ligand field (usually adventitious Fe
3+
). From
the temperature dependence of the signals in the g ¼ 2
region for fully reduced enzyme under 100% H
2
(Fig. 2,
left panel), it is concluded that the spectrum is due to at
least two, possibly three, different signals of reduced
[4Fe)4S] clusters. All signals broadened considerably
above 17 K. Below 30 K one signal was optimally
sharpened at 17 K. It has a trough around g ¼ 1.921
andistermedhereastheÔg ¼ 1.92 signalÕ.Itsg
z
value is
at 2.050. The second major signal only sharpened
optimally at 12 K and has a trough at g ¼ 1.887 (termed
the Ôg ¼ 1.89 signalÕ). Its g
z
value is at 2.078. At 17 K and
lower, there was also a clear shoulder (peak) detectable
around g ¼ 1.959. As in redox titrations (see below) this
signal behaved independently of the other two signals, it is
termed the Ôg ¼ 1.96 signalÕ. At this point it is unclear
where the g
z
and g
x
lines of this signal are. No additional
signals were observed down to 4.2 K. At 70 K a minute
signal could be observed (at a larger magnification) with a
major line around g ¼ 2.3, which is reminiscent of Co
2+
in methyltransferase [31]. This signal was also observed in
membranes of M. barkeri (see below). At pH 7.0 the Fe–S
signals had about twice the intensity of that found at
pH 6.0; the overall line shape of the spectrum was the
same at both pH values. Direct double integration of the
Fe–S signals at 12 K at pH 7 amounted to a total spin
concentration of % 51 l
M
; the enzyme concentration was
25 l
M
. As the amino-acid sequence of Ech points to the
presence of three [4Fe)4S] clusters, the sample was
apparently only partially reduced under the conditions
used (100% (v/v) H
2
at pH 7.0).
Ó FEBS 2002 The membrane-bound [NiFe]-hydrogenase (Ech) from M. barkeri (Eur. J. Biochem. 269) 6103
To a first approximation, the spectrum of Ech under 4%
(v/v) H
2
at pH 7.0 could be simulated rather well on the
basis of the two main components mentioned above (Fig. 2,
right panel). Using the simulated spectra, it could be
calculated that the relative spin concentrations of the
g ¼ 1.89 signal was % 1.6 times that of the g ¼ 1.92 signal.
In addition, a rather isotropic signal at g ¼ 2.03 was
apparent, especially at higher temperatures, where the other
signals broadened. The line shape and the temperature
dependence of the signal indicate a free radical. Its g-value,
however, indicates that the radical cannot be a truly ÔfreeÕ
electron (with a g-value close to the free-electron value). We
also noticed that this signal could not be saturated at 4.2 K
and full microwave power. This suggests that it might be
due to a radical close to a very rapidly relaxing paramagnet,
e.g. high-spin Fe
2+
.
Another method to obtain a rough impression of the line
shape of two overlapping signals with different relaxation
rates is the one described by Hagen and Albracht [32]. By
setting the observing amplifier around 90° out of phase,
while partly saturating the signals with a suitable microwave
power at a suitable temperature, first one and then, at a
slightly different phase, the other signal could be virtually
eliminated from the spectrum. This is demonstrated in
Fig. 3. The g ¼ 1.92 signal (trace B) shows an apparent g
z
at 2.05. The perpendicular region (g
xy
between 1.90 and
1.97) shows more structure than assumed in the simulation
of Fig. 2. Also the peak at g ¼ 1.96 is clearly detectable, as
well as a g
z
-like peak at 2.01. We tentatively conclude that
the spectrum represents an overlap of two different signals,
i.e. the g ¼ 1.92 signal and the g ¼ 1.96 signal. The
g ¼ 1.89 signal (trace C) apparently has its g
z
value around
2.07 (top), while g
xy
line has a trough at g ¼ 1.89. This
agrees with the interpretation shown in Fig. 2. The radical-
like signal at g ¼ 2.03 is present in trace C, but not in trace
B. This indicates that the species causing it has a relaxation
rate at 10 K which is of the same order of magnitude as that
of the g ¼ 1.92 species. We also note that the g-values and
the temperature dependence of the g ¼ 1.92 signal are
similar to those of the clusters N-2 in bovine-heart
complex I [21,33]. As the g ¼ 1.89 signal appears to interact
with the observed Ni
a
–L* signal (see below), it is concluded
that this signal is presumably due to the proximal cluster in
the EchC subunit and so the remaining Fe–S signals present
in the spectrum at 17 K are ascribed to the [4Fe)4S] clusters
in the EchF subunit.
Two of the subunits of Ech, EchE and EchC, bear a large
resemblance to the large and the small subunits, respect-
ively, of [NiFe]-hydrogenases, suggesting the presence of a
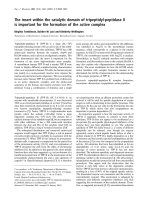
Fig. 2. Temperature dependence of the Fe–S signals of purified Ech
reducedwith101kPaH
2
(left panel) and a simulation of the 12 K EPR
spectrum (right panel). Spectra were recorded at nonsaturating
microwave powers and replotted normalized for microwave frequency,
microwave power, temperature and receiver gain; hence they can be
quantitatively compared. EPR conditions: microwave frequency,
9416.2 MHz; microwave powers incident to the cavity, 50, 40,
30, 30, 30, 20, 20 dB for spectra from top to bottom (0 dB ¼
260 mW); modulation amplitude, 1.27 mT; the temperature is indi-
cated for each spectrum. In the right panel the following spectra are
presented: (A) Experimental spectrum of Ech dissolved in Mops buffer
pH 7.0 under 4% H
2
and further reduced with a few grains of solid
dithionite. EPR conditions: microwave frequency, 9415.8 MHz;
microwave power, 30 dB; modulation amplitude, 0.64 mT; tempera-
ture, 12 K. (B) Simulation of the g ¼ 1.89 signal with parameters
g
xyz
¼ 1.88391, 1.90223, 2.06977 and widths (xyz) ¼ 5.2, 3.7, 6.0 mT.
(C) Difference spectrum A minus B. This difference spectrum was used
to fit the remaining signal (g ¼ 1.92 signal). (D) Simulation of the
g ¼ 1.92 signal (trace C) with parameters g
xyz
¼ 1.91821, 1.93799,
2.04721 and width (xyz) ¼ 2.77, 2.70, 2.66 mT. (E) Difference spec-
trum C minus D.
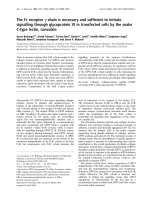
Fig. 3. Three EPR signals that can be detected in the spectrum of
purifiedEchreducedwith101kPaH
2
at pH 8.0 by varying the detecting
phase of the amplifier. (A) Normal EPR spectrum. (B) Approximate
line shape of the g ¼ 1.92 plus g ¼ 1.96 signal obtained by using an
amplifier phase to minimize the g ¼ 1.89 signal. (C) Approximate line
shape of the g ¼ 1.89 signal obtained by using an amplifier phase to
minimize the g ¼ 1.92 signal. EPR conditions: microwave frequency,
9426.6 MHz; microwave power, 10 dB; modulation amplitude,
1.27 mT; temperature, 10 K.
6104 S. Kurkin et al. (Eur. J. Biochem. 269) Ó FEBS 2002
Ni–Fe active site. Hence, under 4% (v/v) H
2
an EPR signal
due to the Ni
a
–C* state (usually with g
xyz
¼ 2.20, 2.15, 2.01)
is expected, as apparent in many other [NiFe]-hydrogenases
under that H
2
-partial pressure. No such signal was
observed, however (data not shown). Even minute signals
due to Ni
a
–C* can usually be detected in a background of
large overlapping signals, by making use of its light
sensitivity [34]. Hence a sample was illuminated for
25 min at 45 K. Curiously, a difference spectrum of light
minus dark showed only the induction of a signal typical for
the Ni
a
–L* state (g
xyz
¼ 2.0486, 2.101, 2.270), but no
disappearance of its expected parent Ni
a
–C* signal could be
detected (Fig. 4). The signal, which could be readily
simulated, amounted to a concentration of only 1.1 l
M
;it
could be clearly seen in the spectrum, however, due to its
sharp lines. When studied below 15 K, a clear two-fold
splitting of the g
y
and g
x
lines, but not of the g
z
line, was
apparent (A
x
¼ 3.9 mT, A
y
¼ 5.2 mT). The splitting was
blurred at 15 K and was not apparent at 20 K or higher
temperatures (Fig. 4). This temperature dependence paral-
lels the temperature dependence of the g ¼ 1.89 signal. In
[NiFe]-hydrogenases the Ni
a
–L* EPR signal shows a small
splitting due to interaction of the Ni-based unpaired
electron with the S ¼ 1/2 system of the reduced proximal
[4Fe)4S] cluster signal [35–37]. It is therefore tentatively
concluded that the g ¼ 1.89 signal is due to the reduced
proximal cluster in Ech. Usually, in [NiFe]-hydrogenases
containing a [3Fe)4S] cluster, the relaxation of the proximal
cluster is very much enhanced by coupling to the nearby
S ¼ 2 system of the reduced [3Fe)4S] cluster. As a result the
effective relaxation of the proximal cluster Ôcools downÕ only
at temperatures below 7 K, and it is only then when the
Ni
a
–C* and Ni
a
–L* signals in these enzymes show the
twofold splitting. Ech does not contain a 3Fe cluster and
therefore the proximal cluster has relaxation properties
normally associated with [4Fe)4S] clusters.
Oxidation of the sample by stirring with air for a few
minutes resulted in the complete disappearance of the
signals due to Co
2+
and the reduced Fe–S clusters. Only
traces of lines reminiscent of the EPR signals of the Ni
r
*
state (observed here around g
x
¼ 2.31 and g
y
¼ 2.178) and
the Ni
u
* state (observed here at g
x
¼ 2.28 and g
y
¼ 2.24)
appeared (data not shown). There was only a trace of a
signal reminiscent of that of an oxidized [3Fe)4S] cluster
and it is concluded that Ech does not contain a [3Fe)4S]
cluster.
EPR spectra of membranes of M. barkeri. As Ech (a
membrane-bound protein) constitutes up to 3% of the total
cell protein, we have also inspected membranes of M. bark-
eri with EPR. Initial EPR measurements failed due to the
presence of large signals from Mn
2+
, which is added to the
growth medium. Omission of Mn
2+
from the medium did
not result in any noticeable changes in the growth or specific
activity of Ech in the membranes, and now only trace
signals due to Mn
2+
remained. Wide-scan spectra (600 mT)
at 12 K of reduced membranes thus obtained revealed only
three main lines (Fig. 5). The line around g ¼ 2.3 is due to
the g
xy
lines of the Co
2+
, presumably from a membrane-
bound methyltransferase. The other two lines (around
g ¼ 2.05 and g ¼ 1.9) are due to reduced [4Fe)4S] clusters.
As signals from [4Fe)4S] clusters usually disappear at 45 K
due to relaxation broadening, whereas the Co
2+
signal does
not (Fig. 5, trace B), a difference spectrum (Fig. 5, trace C)
reveals the spectrum of these clusters only. This is shown in
more detail in the right panel of Fig. 5. A difference of the
spectra at 12 K and 45 K shows similarities to the spectrum
of the purified Ech in Fig. 5, right panel. As with the
purified enzyme, no additional signals could be observed in
the membranes between 12 K and 4.2 K.
Membranes of M. barkeri contain additional metallo-
proteins, like heterodisulphide reductase (Hdr), with Fe–S
clusters showing EPR signals in the same region [38] and a
b-type cytochrome [39], methanophenazin-reducing (F
420
-
nonreducing) [NiFe]-hydrogenases (VhoGAC and Vht-
GAC) [40], as well as a methyltransferease. The Vho, but
not the Vht hydrogenase, is present in high amounts in
acetate-grown cells. Upon cell lysis, however, Vho hydro-
genase loses its contact to the b-type cytochrome, which
anchors this enzyme in the membrane. The amount of the
other hydrogenases (which only reduce dyes but not
ferredoxin) was estimated by activity measurements. Based
on these determinations it can be concluded that the amount
Fig. 4. Temperature dependence of the splitting of the Ni
a
–L* signal. An
EPR tube with Ech (in Mops buffer pH 7.0 under 4% H
2
)wasfrozen
in liquid nitrogen and then kept in the dark at 200 K for 10 min. A
spectrum was recorded at the indicated temperatures and then the
sample was illuminated for 25 min in the EPR cavity at 45 K [34].
After switching off the light, a second set of spectra was recorded under
identical conditions. The difference spectra light minus dark are plotted
in the figure. EPR conditions: microwave frequency, 9415.5 MHz;
microwave power, 20dB (70K, 45K),30dB (20K, 15K, 12K,
10 K) or 10 dB for the bottom spectrum; modulation amplitude,
1.27 mT. Spectra A–F were normalized for temperature, microwave
power and gain. Vertical dashed lines indicate the positions of the g
y
and g
x
lines.
Ó FEBS 2002 The membrane-bound [NiFe]-hydrogenase (Ech) from M. barkeri (Eur. J. Biochem. 269) 6105
of Vho and Vht hydrogenases in washed membranes is very
low.
When membranes were oxidized with air, the signals of
Co
2+
and of the reduced Fe–S clusters disappeared and
now two main signals dominated the spectrum (data not
shown). They were recognized as an Ni
u
* signal, typical for
[NiFe]-hydrogenases in the oxidized, unready state, and a
peculiar signal earlier encountered by us in purified,
oxidized preparations of Hdr in the presence of H-S-CoM
(g
xyz
¼ 2.013, 1.991, 1.938) from M. barkeri and Metha-
nothermobacter marburgensis [38]. Both signals could be
readily simulated, showing that the remainder of the
spectrum consisted of small signals presumably due to an
oxidized, low-spin cytochrome (with g
z
¼ 2.32) and some
contaminating Mn
2+
. No trace of a signal due to the Ni
r
*
state (with g
z
¼ 2.31 and g
y
¼ 2.16) could be spotted. The
simulations enabled quantification of the signals. The spin
concentration represented by the Ni
u
* signal amounted to
11.6 l
M
; the Hdr signal was calculated to represent a spin
concentration of 16.3 l
M
. This indicates that the EPR
signals of the reduced Fe–S clusters from Hdr, which have
similar g-values [38], heavily interfere with those of Ech in
the used membranes and hence these membranes are not
suited for the study of the Fe–S clusters of Ech. As the
membranes contain only very low amounts of other
hydrogenases, the Ni
u
* signal is considered to be due to
Ech only; its concentration was at least 2.1 g pure enzyme
proteinÆL
)1
. Estimating the total protein concentration to be
% 80 gÆL
)1
, this is about 2.7% of the total membrane
protein.
Redox titration in the absence of redox dyes at pH 6.5,
7 and 8
Because in some cases redox dyes have been shown to
change the redox properties of [NiFe]-hydrogenases we
performed redox titrations in the absence of redox dyes.
These titrations were performed at three different pH values
(6.5, 7 and 8) using pure Ech preparations at 25 °C. As an
example of the spectral changes we have compiled spectra
obtained at pH 8 and pH 7 (Fig. 6). The enzyme was first
incubated in the titration cell under 100% H
2
.AtallpH
values the lines at g ¼ 2.05, 1.92, 2.065 and 1.89 were
decreasing in amplitude with increasing potential. The ratio
between the g ¼ 1.92 signal and the g ¼ 1.89 signal was
different at different pH values. The g ¼ 1.89 signal was
more pronounced at pH 6.5 and 7. At pH 8 a small
apparent shift or the line at g
z
¼ 2.05 to smaller values was
noticed when the potential was increasing. The amplitude
changes of the g ¼ 1.96 line were accompanied by the
changes of a ÔkinkÕ in the 1.92 line suggesting a contribution
of the g ¼ 1.96 signal at that position, as also suggested by
trace B in Fig. 3. The peak at g ¼ 2.01 was present in
titrations at all three pH values and disappeared with
increasing potential. At pH 8 it was no longer detectable at
H
2
concentrations < 10%. This signal was less pronounced
at pH 7 and 6.5.
The spin concentrations, estimated for enzyme under
100% (v/v) H
2
, were 45, 65 and 56 l
M
at pH 6.5, 7 and 8,
respectively. As the enzyme concentration used for all
titrations was 25 l
M
, the amount of spins per enzyme
molecule represented by the Fe–S signals was 1.8, 2.6 and
2.24 for pH 6.5, 7 and 8, respectively.
At all three pH values a plot of the amplitude of the
g ¼ 1.92 and g ¼ 1.89 signals fitted best to n ¼ 2Nernst
curves (Fig. 7). The amplitudes at pH 6.5 were smaller and
the data were rather scattered; hence the estimated E
0
¢
values are less reliable, while the n-values could not be
Fig. 5. Wide-scan EPR spectra of membranes of M. barkeri (left panel)
and details of the g = 2region(rightpanel).Membranes from acetate-
grown cells were prepared as described in Materials and methods and
equilibrated with 100% H
2
before freezing in liquid nitrogen. Spectra
were recorded between 5 and 605 mT (left panel) and a scan range of
only 80 mT was used in the g ¼ 2 region (right panel). Left panel: (A)
spectrum at 12 K; (B) spectrum at 45 K; spectra were normalized for
microwave frequency, microwave power, temperature and receiver
gain; (C) difference A minus B. Right panel: (A) spectrum at 12 K; (B)
spectrum at 45 K; spectra were normalized for microwave frequency,
microwave power, temperature and receiver gain; (C) difference A
minus B. (D) Spectrum of the purified enzyme at pH 7.0 under 4%
(v/v) H
2
. EPR conditions: microwave frequency, 9416.5 MHz;
microwave power, 40 dB for A and D, 30 dB for B; modulation am-
plitude, 1.27 mT (left panel) and 0.64 mT (right panel); temperatures
are indicated in the figure.
Fig. 6. EPR spectra of samples from a titration of Ech hydrogenase at
pH 8 (left panel) and at pH 7 (right panel) with H
2
/He mixtures (in the
absence of redox dyes). EPR conditions: microwave frequency,
9460 MHz; microwave power, 30 dB; modulation amplitude,
1.27 mT; temperature, 12 K. All spectra are normalized for the
gain,the tube-calibration factor, and the microwave frequency and
hence they can be directly compared. The redox potentials are indi-
cated in the figure.
6106 S. Kurkin et al. (Eur. J. Biochem. 269) Ó FEBS 2002
determined. The midpoint potentials of the two signals
obtained at all three pH values are summarized in Table 1.
For both signals there was a pH dependence of )38 to
–50 mVÆpH unit
)1
.
Redox titrations in the presence of redox dyes at pH 6,
6.5, 7 and 8
EPR spectra under 101 kPa H
2
at different pH values in
the presence of redox dyes. The titrations at all four pH
values were started with 100% H
2
-reduced enzyme, which
was transferred anaerobically to the titration vessel under a
continuous flow of O
2
-free H
2
. Hence, the starting redox
potential was that of the hydrogen potential at each pH
value. Spectra taken under these conditions are summarized
in Fig. 8, left panel. Comparison of the four spectra shows
that the degree of reduction diminished with decreasing pH.
The spin concentrations obtained by direct double integra-
tion showed that at pH 6 the intensity was only % 30% of
that at pH 8. There were also clear changes in the overall
line shapes of the spectra. At pH 6 two separate g
z
lines at
2.078 and 2.050 were observed (Fig. 8, left panel). At
pH 6.5, the 2.05 line markedly increases together with the
trough around g ¼ 1.92. This reinforces the earlier inter-
pretation that these two lines form the g
z
and the g
xy
region
of the g ¼ 1.92 signal, whereas the g
z
¼ 2.078 and the
trough at g ¼ 1.887 form the g
z
and g
xy
lines of the
g ¼ 1.89 signal. At pH 7.0 both of the two g
z
lines as well as
the two g
xy
lines increased noticeably. Also the g ¼ 1.96
signal could now be discerned as a shoulder. At pH 8.0 this
shoulder at g ¼ 1.959 is much better defined and forms a
separate peak. As the region between the two g
z
lines at
2.078 and 2.050 seems to Ôfill upÕ, one might conclude that
this is caused by a g
z
line (around g ¼ 2.06) of the g ¼ 1.96
signal. Spectra encountered during the redox titrations (see
below) made this interpretation less likely. At this point we
tentatively conclude that the g ¼ 1.96 species has its g
z
line
either at 2.06 or at 2.01.
Comparison of the EPR spectra at different pH values at
)340 mV. It is interesting to compare the EPR spectra at
different pH values and the same potential ()340 mV). The
comparison showed that the overall reduction level was
roughly the same (Fig. 8, right panel) although there were
clear spectral differences. At none of the pH values was any
trace of the g ¼ 1.96 signal observed. The relative ratio of
the other two signals was clearly dependent on the pH. At
pH 6.0 the g ¼ 1.89 signal dominated the spectrum, while
at pH 8.0 the g ¼ 1.92 signal was the most pronounced.
The g ¼ 1.96 species apparently has a redox potential
considerably lower than those of the g ¼ 1.92 and g ¼ 1.89
species (see below).
Redox titrations results. The overall behaviour of the 2.05/
1.92 lines of the g ¼ 1.92 signal and the 2.065/1.89 lines of
the g ¼ 1.89 signal in the titrations in the presence of redox
dyes was comparable to the titration in the absence of
these dyes (Fig. 9). The g ¼ 2.01 signal found in the absence
of dyes was not detectable in the EPR spectra in the
presence of dyes as it was obscured by the strong radical
signals round g ¼ 2.00, originating from the redox dyes.
The spin concentrations estimated by double integration of
the experimental EPR spectra of enzyme under 101 kPa H
2
were 0.51, 1.8, 2 and 1.9 spins per molecule at pH 6, 6.5, 7
and 8, respectively. These values are slightly overestimated
due to the contribution of the radical signals. The
amplitudes of the g ¼ 1.92 and g ¼ 1.89 signals changed
with pH; they were smaller at lower pH values (see Table 1).
This reflects the overall decrease in the level of reduction of
the enzyme at lower pH values. The line at g ¼ 1.96
disappeared on shifting from pH 8 to pH 6, in line with the
Fig. 7. Redox behaviour of the g = 1.92 and g = 1.89 signals in a
titration in the absence of mediating dyes at pH 6.5, 7 and 8. The
amplitudes (arbitrary units) of the g ¼ 1.92 signal (left panel) and the
g ¼ 1.89 signal (right panel) are plotted against redox potential. Solid
curves indicate theoretical Nernst lines with n ¼ 2. The estimated E
0
¢
and n-values and the maximal amplitudes of the signals are listed in
Table 1.
Table 1. Summary of the redox properties of the Fe–S clusters in Ech as obtained from the redox titrations with H
2
/He mixtures in the presence and in
the absence of the redox dyes.
g ¼ 1.92 signal g ¼ 1.89 signal
pH Dyes n-value Amplitude under 1 bar H
2
a
E
0
¢ (mV) n-value Amplitude under 1 bar H
2
a
E
0
¢ (mV)
6 + 2 0.29 ) 328 2 0.40 ) 323
6.5 + 2 0.57 ) 340 2 0.49 ) 343
7 + 2 1.13 ) 348 2 0.78 ) 352
8 + 1 1.00 ) 368 1 1.12 ) 413
6.5 – 2 0.60 ) 304 2 0.67 ) 337
7 – 2 1.04 ) 350 2 1.10 ) 360
8 – 2 0.87 ) 388 2 0.91 ) 410
a
Arbitrary units.
Ó FEBS 2002 The membrane-bound [NiFe]-hydrogenase (Ech) from M. barkeri (Eur. J. Biochem. 269) 6107
conclusions from the EPR spectra at )340 mV at different
pH values (Fig. 8, right panel). Fig. 9 shows that the
g ¼ 1.96 signal appeared only at the lowest potentials. Its
E
0
¢ value is estimated to be well below )420 mV.
In all titrations, but especially in those at pH 6.0 and 6.5,
weak signals due to Ni were observed at H
2
-partial pressures
of £ 10%. The signals had the characteristic g-values of the
Ni
a
–C* state (g
xyz
¼ 2.21, 2.13, 2.01) and the light-induced
Ni
a
–L* state (g
xyz
¼ 2.05, 2.11, 2.3), as observed in other
[NiFe]-hydrogenases [34]. The total spin concentration
amounted to maximally 10% of the enzyme concentration.
The data obtained in the presence of dyes (Fig. 10) were
not as clear-cut as those obtained in the absence of dyes. At
all pH values, except pH 8, the g ¼ 1.92 and 1.89 signals
both titrated as n ¼ 2systems.AtpH8thebestfitwas
obtained with n ¼ 1 and this result is different from the
titration in the absence of dyes, where the best fit was
obtained with n ¼ 2 Nernst curves.
DISCUSSION
Iron-sulphur clusters
The best way to study membrane-bound enzymes, especially
for those expected to pump protons, is to use intact
membranes. As demonstrated, % 3% of the protein content
of membrane preparations of M. barkeri consisted of Ech,
but the concentration of Hdr was also quite high. This
prevented a specific study of the Fe–S clusters in Ech. We
therefore turned to the purified enzyme.
From the EPR line shape and the temperature depend-
ence of spectra from H
2
-reduced Ech, it can be concluded
that signals due to three different S ¼ 1/2 species from
reduced [4Fe)4S] clusters are present. We have labelled
them as the g ¼ 1.92 signal, the g ¼ 1.89 signal and the
g ¼ 1.96 signal. Only insignificant signals due to a
[3Fe)4S]
+
cluster could be detected in air-oxidized enzyme.
This result is in line with the presence of two four-Cys motifs
for the binding of [4Fe)4S] clusters in the amino acid
sequences of the EchF subunit and one such motif in the
EchC subunit. It also is in good agreement with the content
of Fe and acid-labile sulphur of the purified enzyme. The
redox titrations indicated that the g ¼ 1.96 signal has the
lowest redox potential (well below )420 mV at pH 7);
therefore this cluster could only partly be reduced. This is in
line with the maximal amount of spins detected in the
spectra of the reduced Fe–S clusters (% 2–2.6 spins per
enzyme molecule at pH 8).
The temperature dependence of the splitting of the Ni
a
–
L* signal paralleled the temperature dependence of the
g ¼ 1.89 signal. We hence conclude that the unpaired spin
located at the Ni site has magnetic interaction with the Fe–S
cluster responsible for the g ¼ 1.89 signal. This indicates
that this [4Fe)4S] cluster is the proximal cluster located in
the EchC subunit. It then follows that the two [4Fe)4S]
clusters causing the g ¼ 1.92 and g ¼ 1.96 signals are
located in the EchF subunit.
A major disadvantage of the use of redox mediators in
redox titrations is that they sometimes dramatically change
the redox properties of [NiFe]-hydrogenases [27,41]. The
interaction of H
2
with hydrogenases offers the possibility to
study redox changes in enzyme in the absence of redox
mediators simply by varying the H
2
-partial pressure in a
known mixture of H
2
and He. This method minimizes the
possible artefacts introduced by redox dyes. This laboratory
has used the method before for the hydrogenases from
M. marburgensis and Allochromatium vinosum.Itwas
Fig. 8. EPR spectra of Ech under 101 kPa H
2
in the presence of me-
diating dyes at different pH values (left panel) and EPR spectra of Ech
from titrations poised at )340 mV ± 5 mV (right panel). The measured
potential at each pH value is given in the figure and this legend. The
theoretical potential of 101 kPa H
2
isgiveninthislegendinparen-
theses. Left panel: (A) pH 8, )463 mV ()472 mV); (B) pH 7,
)405 mV ()413 mV); (C) pH 6.5, )383 mV ()383 mV); (D) pH 6,
)360 mV ()360 mV). Right panel: (A) pH 8; (B) pH 7; (C) pH 6.5
and (D) pH 6. The EPR conditions were the same as in Fig. 6.
Fig. 9. EPR spectra (Fe–S region) of Ech during redox titrations at
potentials below )282 mV at pH 8 in the presence of redox dyes. EPR
conditions were as in Fig. 6. All spectra are normalized for gain, tube
factor and microwave frequency.
6108 S. Kurkin et al. (Eur. J. Biochem. 269) Ó FEBS 2002
observed that the presence of dyes had a major effect on the
reversible redox transition between the Ni
a
–C* and the Ni
a
–
SR states. The reaction was an n ¼ 1 transition involving
one proton when performed with a H
2
/He mixture in the
presence of redox dyes [27,41]. When the dyes were omitted,
however, the reaction was found to be n ¼ 2 and involved
two protons. In addition, in the absence of redox dyes, there
was no redox equilibrium between the Ni
a
–S and Ni
a
–C*
states. A limitation of the titrations in the absence of dyes is
the limited potential range, which can be covered by the
2H
+
/H
2
couple. The maximal obtainable potential is
approximately 120 mV above that of the hydrogen poten-
tial at a given pH.
In the redox titratations with Ech nearly all curves fitted
best to n ¼ 2 Nernst lines. As all titrations were
performed with H
2
/He mixtures, H
2
is directly involved
in all reduction and oxidation reactions; hence n ¼ 2 lines
are expected. There is a notable difference in the results of
the redox titrations performed at pH 8: in the presence of
dyes the curve fitted best to a n ¼ 1 Nernst line; when the
dyes were omitted the reaction was found to be n ¼ 2.
According to previous studies this could be due to the
artefacts caused by the redox dyes. The titrations at
different pH values using two different methods show that
there is definite pH dependence of the midpoint potentials
of the Fe–S clusters responsible for the g ¼ 1.92 and the
g ¼ 1.89 signals (Fig. 11). This effect was best observed in
the titrations in the absence of redox dyes at pH 8 and
pH 7. For the g ¼ 1.92 signal the E
0
¢ value decreased by
53 mV per pH unit; this value was 62 mV per pH unit for
the g ¼ 1.89 signal. For the titrations in the presence of
redox dyes these values were 20 mV and 45 mV per pH
unit for the g ¼ 1.92 and g ¼ 1.89 signals, respectively.
This pH dependence for the proximal cluster (g ¼ 1.89
signal) is in agreement with the pH dependence of the E
0
¢
value of the proximal cluster in standard [NiFe]-hydro-
genases [42].
The values obtained for both signals were reasonably
close to the theoretical value of )59 mV per pH unit for a
redox reaction involving a stoichiometric amount of elec-
trons and protons. E
0
¢ values with such a large pH
dependency are rare for [4Fe)4S] clusters with a classical
Cys coordination [43–45]. No firm conclusion is possible for
the cluster causing the g ¼ 1.96 signal. The data indicate
that the redox potential of this cluster is considerably lower
than those of the other two clusters. The existence of two
[4Fe)4S] clusters with different midpoint potentials in one
polypeptide is not unprecedented. It was found in the
ferredoxin of A. vinosum [46].
The g-values (g
z
¼ 2.05 and g
xy
¼ 1.92) and pH
dependence of )53 mV per pH unit of the g ¼ 1.92
signal, ascribed to one of the [4Fe)4S] clusters in the
EchF subunit, is reminiscent of the g-values (g
z
¼ 2.054
and g
xy
¼ 1.922) and the pH dependence of )60 mV per
pH unit of the signal ascribed the cluster(s) N-2 of bovine
complex I [22]. There is a debate in the literature as to the
precise location of this cluster N-2 [21,23,47–50]. Ech
contains only three [4Fe)4S] clusters and one of them
(causing the g ¼ 1.89 signal) is close to the Ni–Fe site and
thus located in the EchC subunit. Hence, in Ech the other
two [4Fe)4S] clusters are in the EchF subunit which
shows a very high amino acid sequence similarity to the
TYKY subunit of the bovine complex I [23]. This
strengthens our earlier suggestion [23] that the Fe–S
clusters in these subunits might be involved in an electron-
transfer driven proton-pumping unit. Further studies are
required to verify this. The data presented are a good
starting point towards an understanding of the behaviour
of Fe–S clusters in proton-pumping [NiFe]-hydrogenases.
Point mutations of amino acid residues close to the several
Fe–S clusters can give more insight into the mechanism of
action. At the same time the results obtained with Ech can
be helpful to a better understanding of similar studies in
the field of complex I.
ACKNOWLEDGEMENTS
S. P. J. Albracht is indebted to the Netherlands Organization for
Scientific Research (NWO) for funding provided via the Section for
Chemical Sciences. R. Hedderich acknowledges the Max-Planck-
Gesellschaft, the Deutsche Forschungsgemeinschaft and the Fonds
der Chemischen Industrie for financial support.
Fig. 10. Redox titrations of Ech in the presence of dyes and at different pH values. The amplitudes of the g ¼ 1.92 (left panel) and g ¼ 1.89 signals
(right panel) were plotted against the redox potential. Solid curves represent Nernst curves with n ¼ 2 fitting to the data points at pH 6, 6.5 and
pH 7. At pH 8 the best fit was obtained with an n ¼ 1curve.TheE
0
¢ values are listed in Table 1.
Fig. 11. Plots of the midpoint potentials (E
0
¢) for both signals (g = 1.92
and g = 1.89) against the pH from the titration in the absence of dyes
(left panel) and from the titration in the presence of dyes (right panel).
ThevaluesusedarethoselistedinTable1.
Ó FEBS 2002 The membrane-bound [NiFe]-hydrogenase (Ech) from M. barkeri (Eur. J. Biochem. 269) 6109
REFERENCES
1. Adams, M.W.W. & Mortenson, L.E. (1984) The physical and
catalytic properties of hydrogenase II of Clostridium pasteurianum.
A comparison with hydrogenase I. J. Biol. Chem. 259, 7045–7055.
2. Adams, M.W.W. (1990) The structure and mechanism of iron-
hydrogenases. Biochim. Biophys. Acta 1020, 115–145.
3. Vignais, P.M., Billoud, B. & Meyer, J. (2001) Classification and
phylogeny of hydrogenases. FEMS Microb. Rev. 25, 455–501.
4. Nicolet, Y., Cavazza, C. & Fontecilla-Camps, J.C. (2002) Fe-only
hydrogenases: structure, function, and evolution. J. Inorg. Bio-
chem. 91, 1–8.
5. Albracht, S.P.J. (1994) Nickel hydrogenases: in search of the active
site. Biochim. Biophys. Acta 1188, 167–204.
6. Casalot, L. & Rousset, M. (2001) Maturation of the [NiFe]
hydrogenases. Trends. Microbiol. 9, 228–237.
7. Garcin, E., Montet, Y., Volbeda, A., Hatchikian, C., Frey, M. &
Fontecilla-Camps, J.C. (1998) Structural bases for the catalytic
mechanism of [NiFe] hydrogenases. Biochem. Soc. Trans. 26,396–
401.
8. Volbeda, A., Charon, M.H., Piras, C., Hatchikian, E.C., Frey, M.
& Fontecilla-Camps, J.C. (1995) Crystal structure of the nickel-
iron hydrogenase from Desulfovibrio. Nature 373, 580–587.
9. Hartmann, G.C., Klein, A.R., Linder, M. & Thauer, R.K. (1996)
Purification, properties and primary structure of H
2
-forming
N
5
,N
10
– methylenetetrahydromethanopterin dehydrogenase
from Methanococcus thermolithotrophicus. Arch. Microbiol. 165,
187–193.
10. Buurman, G., Shima, S. & Thauer, R.K. (2000) The metal-free
hydrogenase from methanogenic archaea: evidence for a bound
cofactor. FEBS Lett. 485, 200–204.
11. Berkessel, A. (2001) Activation of dihydrogen without transition
metals. Curr. Opin. Chem. Biol. 5, 486–490.
12. Thauer, R.K. (1998) Biochemistry of methanogenesis: a tribute to
Marjory Stephenson. Microbiology 144, 2377–2406.
13. Keltjens, J.T. (1984) Coenzymes of methanogenesis from
hydrogen and carbon dioxide. Antonie Van Leeuwenhoek 50,
383–396.
14. Kunkel, A., Vorholt, J.A., Thauer, R.K. & Hedderich, R. (1998)
An Escherichia coli hydrogenase-3-type hydrogenase in metha-
nogenic archaea. Eur. J. Biochem. 252, 467–476.
15. Bo
¨
hm, R., Sauter, M. & Bo
¨
ck, A. (1990) Nucleotide sequence and
expression of an operon in Escherichia coli coding for formate
hydrogenlyase components. Mol. Microbiol. 4, 231–243.
16. Fox,J.D.,He,Y.,Shelver,D.,Roberts,G.P.&Ludden,P.W.
(1996) Characterization of the region encoding the CO-induced
hydrogenase of Rhodospirillum rubrum. J. Bacteriol. 178, 6200–
6208.
17. Fox, J.D., Kerby, R.L., Roberts, G.P. & Ludden, P.W. (1996)
Characterization of the CO-induced, CO-tolerant hydrogenase
from Rhodospirillum rubrum and the gene encoding the large
subunit of the enzyme. J. Bacteriol. 178, 1515–1524.
18. Meuer, J., Bartoschek, S., Koch, J., Kunkel, A. & Hedderich, R.
(1999) Purification and catalytic properties of Ech hydrogenase
from Methanosarcina barkeri. Eur. J. Biochem. 265, 325–335.
19. Bott, M. & Thauer, R.K. (1989) Proton translocation coupled to
the oxidation of carbon monoxide to CO
2
and H
2
in Methano-
sarcina barkeri. Eur. J. Biochem. 179, 469–472.
20. Meuer,J.,Kuettner,H.C.,Zhang,J.K.,Hedderich,R.&Metcalf,
W.W. (2002) Genetic analysis of the archaeon Methanosarcina
barkeri Fusaro reveals a central role for Ech hydrogenase and
ferredoxin in methanogenesis and carbon fixation. Proc. Natl
Acad. Sci. USA 99, 5632–5637.
21. Albracht, S.P.J., Mariette, A. & de Jong, P. (1997) Bovine-heart
NADH: ubiquinone oxidoreductase is a monomer with 8
Fe-S clusters and 2 FMN groups. Biochim. Biophys. Acta 1318,
92–106.
22. Ingledew, W.J. & Ohnishi, T. (1980) An analysis of some ther-
modynamic properties of iron-sulphur centres in site I of
mitochondria. Biochem. J. 186, 111–117.
23. Albracht, S.P.J. & Hedderich, R. (2000) Learning from hydro-
genases: location of a proton pump and of a second FMN in
bovine NADH–ubiquinone oxidoreductase (Complex I). FEBS
Lett. 485, 1–6.
24. Fischer, R. & Thauer, R.K. (1990) Ferredoxin-dependent methane
formation from acetate in cell extracts of Methanosarcina barkeri
(strain MS). FEBS Lett. 269, 368–372.
25. Dutton, P.L. (1971) Oxidation-reduction potential dependence of
the interaction of cytochromes, bacteriochlorophyll and carote-
noids at 77 degrees K in chromatophores of Chromatium D and
Rhodopseudomonas gelatinosa. Biochim. Biophys. Acta 226, 63–80.
26. Ives, D.J.G. & Janz, G.J. (1961) Reference Electrodes, Theory and
Practice. Academic Press, New York, USA.
27. Coremans, J.M.C.C., van Garderen, C.J. & Albracht, S.P.J.
(1992) On the redox equilibrium between H
2
and hydrogenase.
Biochim. Biophys. Acta 1119, 148–156.
28. Beinert, H. & Albracht, S.P.J. (1982) New insights, ideas and
unanswered questions concerning iron-sulfur clusters in mito-
chondria. Biochim. Biophys. Acta 683, 245–277.
29. Albracht, S.P.J. (1984) Applications of electron paramagnetic
resonance in the study of iron-sulfur clusters in energy-transducing
membranes. Current Topics in Bioenergetics, pp. 79–106. Aca-
demic Press, New York, USA.
30. Aasa,R.&Va
¨
nnga
˚
rd, T. (1975) EPR signal intensity and powder
shapes: a reexamination. J. Magn. Reson. 19, 308–315.
31. Schulz, H., Albracht, S.P.J., Coremans, J.M.C.C. & Fuchs, G.
(1988) Purification and some properties of the corrinoid-contain-
ing membrane protein from Methanobacterium thermo-
autotrophicum. Eur. J. Biochem. 171, 589–597.
32. Hagen, W.R. & Albracht, S.P.J. (1982) Analysis of strain-induced
EPR-line shapes and anisotropic spin-lattice relaxation in a
[2Fe-2S] ferredoxin. Biochim. Biophys. Acta 702, 61–71.
33. Ohnishi, T. (1998) Iron-sulfur clusters/semiquinones in complex I.
Biochim. Biophys. Acta 1364, 186–206.
34. van der Zwaan, J.W., Albracht, S.P.J., Fontijn, R.D. & Slater,
E.C. (1985) Monovalent nickel in hydrogenase from Chromatium
vinosum. Light sensitivity and evidence for direct interaction with
hydrogen. FEBS Lett. 179, 271–277.
35. Teixeira, M., Moura, I., Xavier, A.V., Huynh, B.H., Der Varta-
nian, D.V., Peck, H.D. Jr, Le Gall, J. & Moura, J.J. (1985) Elec-
tron paramagnetic resonance studies on the mechanism of
activation and the catalytic cycle of the nickel-containing hydro-
genase from Desulfovibrio gigas. J. Biol. Chem. 260, 8942–8950.
36. Cammack, R., Patil, D.S. & Fernandez, V.M. (1985) Electron-
spin-resonance/electron-paramagnetic-resonance spectroscopy of
iron-sulphur enzymes. Biochem. Soc. Trans. 13, 572–578.
37. Van der Zwaan, J.W., Albracht, S.P.J., Fontijn, R.D. & Mul, P.
(1987) On the anomalous temperature behaviour of the EPR
signal of monovalent nickel in hydrogenase. Eur. J. Biochem. 169,
377–384.
38. Madadi-Kahkesh, S., Duin, E.C., Heim, S., Albracht, S.P.J.,
Johnson, M.K. & Hedderich, R. (2001) A paramagnetic species
with unique EPR characteristics in the active site of heterodisulfide
reductase from methanogenic archaea. Eur. J. Biochem. 268,
2566–2577.
39. Brodersen, J., Baumer, S., Abken, H.J., Gottschalk, G. &
Deppenmeier, U. (1999) Inhibition of membrane-bound electron
transport of the methanogenic archaeon Methanosarcina mazei
Go1 by diphenyleneiodonium. Eur. J. Biochem. 259, 218–224.
40. Deppenmeier, U., Blaut, M., Lentes, S., Herzberg, C. &
Gottschalk, G. (1995) Analysis of the vhoGAC and vhtGAC
operons from Methanosarcina mazei strain Go
¨
1, both encoding
a membrane-bound hydrogenase and a cytochrome b. Eur. J.
Biochem. 227, 261–269.
6110 S. Kurkin et al. (Eur. J. Biochem. 269) Ó FEBS 2002
41. Coremans, J.M.C.C., van der Zwaan, J.W. & Albracht, S.P.J.
(1992) Distinct redox behaviour of prosthetic groups in ready and
unready hydrogenase from Chromatium vinosum. Biochim.
Biophys. Acta 1119, 157–168.
42. Cammack, R., Frey, M. & Robson, R. (2001) Hydrogen as a Fuel.
Learning from Nature. Taylor & Francis Inc., New York, USA.
43. Britt, R.D., Sauer, K., Klein, M.P., Knaff, D.B., Kriauciunas, A.,
Yu & C.A., Yu, L. & Malkin, R. (1991) Electron spin echo
envelope modulation spectroscopy supports the suggested
coordination of two histidine ligands to the Rieske Fe-S centers of
the cytochrome b6f complex of spinach and the cytochrome
bc1 complexes of Rhodospirillum rubrum, Rhodobacter sphaero-
ides R 26, and bovine heart mitochondria. Biochemistry 30, 1892–
1901.
44. Zhang, H., Carrell, C.J., Huang, D., Sled, V., Ohnishi, T., Smith,
J.L. & Cramer, W.A. (1996) Characterization and crystallization
of the lumen side domain of the chloroplast Rieske iron-sulfur
protein. J. Biol. Chem 271, 31360–31366.
45. Conover, R.C., Kowal, A.T., Fu, W.G., Park, J.B., Aono, S.,
Adams, M.W.W. & Johnson, M.K. (1990) Spectroscopic char-
acterization of the novel iron-sulfur cluster in Pyrococcus furiosus
ferredoxin. J. Biol. Chem. 265, 8533–8541.
46. Kyritsis, P., Hatzfeld, O.M., Link, T.A. & Moulis, J.M. (1998)
The two [4Fe-4S] clusters in Chromatium vinosum ferredoxin have
largely different reduction potentials. Structural origin and func-
tional consequences. J. Biol. Chem. 273, 15404–15411.
47. Dupuis, A., Skehel, J.M. & Walker, J.E. (1991) A homologue
of a nuclear-coded iron–sulfur protein subunit of bovine mi-
tochondrial complex I is encoded in chloroplast genomes. Bio-
chemistry 30, 2954–2960.
48. Friedrich, T., Abelmann, A., Brors, B., Guenebaut, V., Kintscher,
L., Leonard, K., Rasmussen, T., Scheide, D., Schlitt, A., Schulte,
U. & Weiss, H. (1998) Redox components and structure of the
respiratory NADH: ubiquinone oxidoreductase (complex I).
Biochim. Biophys. Acta 1365, 215–219.
49. Kashani-Poor, N., Zwicker, K., Kerscher, S. & Brandt, U. (2001)
A central functional role for the 49-kDa subunit within the cata-
lytic core of mitochondrial Complex I. J. Biol. Chem 276, 24082–
24087.
50. Duarte, M., Populo, H., Videira, A., Friedrich, T. & Schulte, U.
(2002) Disruption of iron-sulphur cluster N2 from NADH: ubi-
quinone oxidoreductase by site-directed mutagenesis. Biochem. J.
364, 833–839.
Ó FEBS 2002 The membrane-bound [NiFe]-hydrogenase (Ech) from M. barkeri (Eur. J. Biochem. 269) 6111