YSU Graduate Outcomes Report AY 2016-2017
Bạn đang xem bản rút gọn của tài liệu. Xem và tải ngay bản đầy đủ của tài liệu tại đây (270.54 KB, 1 trang )
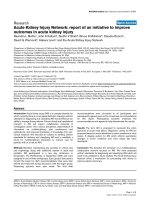
GRADUATE OUTCOMES REPORT - AY 2016 – 2017
EXECUTIVE SUMMARY OF SURVEY RESULTS
The Graduate Outcomes Report is a summary of employment and continuing education decisions made by
Youngstown State University students who completed their degrees during the 2016-2017 academic year.
Who took the survey: The survey was distributed to 2,311 graduates who received degrees in August 2016,
December 2016, and May 2017.
How the data was collected: The primary collection method was by email. This occurred three times over a
period of one year: at graduation, three months and six months. In addition, staff surveyed students at the
Grad Central events, WCBA graduation breakfast, BCOE student Teacher Professional Day, and May
graduation ceremony. Incentives were given to encourage students to fill out the surveys.
Career information collected from the Office of Alumni Engagement has been integrated into the report.
Response Rate: The YSU total response rate is 30%. Out of 2,311 graduates, there were 687 responses. The
individual college’s response rates are included in this report.
Career Outcomes Definition: The total number of respondents who are either working full-time, seeking
additional education and accepted, in the military, or as a post-graduate volunteer (for example, Peace
Corps).
Career Outcomes Rate: The YSU total career outcomes rate is 59% with the individual college’s career
outcome rates included in this report.* Out of the 687 respondents, 406 had outcomes related to a career.
Pursuing Additional Education: 11% of YSU graduates have been accepted into a continuing education
program. The individual college’s response rates are included in this report.
Salaries:
Undergraduate
Mean: $48,480
Median $41,750
Graduate
Mean: $61,355
Median: $54,500
Graduates who did not relocate: 69% of the graduates stayed within 30 miles of Youngstown.
The respondent demographics of this report resembles that of the overall YSU demographics:
Respondents
YSU Graduating Seniors
Female (59%) Male (41%)
Female (57%) Male (43%)
White (84%) Student of Color (11%)
White (79%) Student of Color (18%)
Unreported Race/Ethnicity (5%)
Unreported Race/Ethnicity (3%)
* The 2016-2017 career outcomes rate is lower than previous years. We hypothesize this is because of when the data
was collected. For the first time, data was collected at graduation events, a time when students are less likely to have
already achieved positive career outcomes.
GRADUATE OUTCOMES REPORT 2016-2017