Macrobenthic community status at coastal cage aquaculture area in Xuan Dai bay, Phu Yen province, Vietnam
Bạn đang xem bản rút gọn của tài liệu. Xem và tải ngay bản đầy đủ của tài liệu tại đây (1.18 MB, 10 trang )
Vietnam Academy of Science and Technology (VAST) 2022, 22(2) 189–198
Vietnam Academy of Science and Technology
Vietnam Journal of Marine Science and Technology
journal homepage: vjs.ac.vn/index.php/jmst
Macrobenthic community status at coastal cage aquaculture area in
Xuan Dai bay, Phu Yen province, Vietnam
Phan Thi Kim Hong*, Nguyen Ngoc Anh Thu, Dao Tan Hoc, Nguyen An Khang,
Hua Thai Tuyen, Mai Xuan Dat, Ho Thị Hoa
Institute of Oceanography, VAST, Vietnam
*
E-mail:
Received: 10 March 2022; Accepted: 29 May 2022
ABSTRACT
Lobster cage culture started around 1990 in Xuan Dai bay and grew fast in recent years, contributing
significantly to the socio-economic development of the region. But the impact on the ecological environment of
cage culture operation also needs to consider. This paper points out the status of the macrobenthic community,
studied at two stations inside the cage culture area (X1, X2) and one reference station (Xr) in the non-cage
culture area. A total of 90 samples with 5 replicate samples per station were collected in six surveys during the
dry and rainy seasons from June 2019 to May 2020. These samples were classified and recorded into 80 taxa
belonging to 49 families and 5 classes. The class Polychaetes had the most diverse species composition with
53 taxa (66% of the total number of taxa). The crustacean group had 14 taxa (18%) belonging to 13 families;
Molluscs had 9 taxa (11%) belonging to 6 families of class Bivalvia. The echinoderms had 4 taxa (5%).
Capitella capitata, a species known as an indicator of organic pollution, was recorded in both stations of the
culture area but was not present at the reference station. Furthermore, some dominant species presented in the
culture stations such as Cossura longocirrata (contributed 43.52% in station X1) and Ceratonereis sp.
(contributed 27.57% in station X2). These species are considered opportunistic species that can adapt to
disturbed environmental conditions. Significantly, the species of echinoderms group were only recorded in the
reference station. The species composition was only about 24% similar to those at the cage culture stations. The
species richness index (D) values ranged from 1.50 (X2.6) to 6.82 (Xr.3). The diversity index (H′) varied from
0.88 (X2.4) to 2.98 (Xr.3). The evenness index (J) had the lowest average value at station X2 (J = 0.59 ± 0.20)
and the highest value at the reference station Xr (J = 0.78 ± 0.03). The indices D, H′ and J of the macrobenthic
community at the reference stations have higher average values compared to those estimated at cage culture
stations. These results proved cage culture activities have gradually impacted the benthic fauna, reduced
biodiversity, and encouraged the appearance of opportunistic species. Thus, further studies on the macrobenthic
community dynamic with ecological criteria are necessary to establish a set of biological indicators to monitor
the environmental quality of the coastal aquaculture area.
Keywords: Coastal cage aquaculture, macrobenthic community, Xuan Dai bay.
Citation: Phan Thi Kim Hong, Nguyen Ngoc Anh Thu, Dao Tan Hoc, Nguyen An Khang, Hua Thai Tuyen, Mai Xuan
Dat, and Ho Thị Hoa, 2022. Macrobenthic community status at coastal cage aquaculture area in Xuan Dai bay, Phu Yen
province, Vietnam. Vietnam Journal of Marine Science and Technology, 22(2), 189–198. />ISSN 1859-3097/© 2022 Vietnam Academy of Science and Technology (VAST)
189
Phan Thi Kim Hong et al./Vietnam Academy of Science and Technology (VAST) 2022, 22(2) 189–198
INTRODUCTION
Xuan Dai Bay locates in the north of Phu
Yen province with an area of 9,000 ha. Lobster
cage culture started in this semi-enclosed bay
around 1990. Currently, the aquaculture areas
develop widely about 1,000 ha with an annual
commercial lobster yield is over 700 tons. The
revenue from lobster culture is about 500–600
billion VND/year, contributing significantly to
the socio-economic status [1].
However, many studies have shown that
coastal aquaculture harms the ecological
environment through aquaculture waste such as
uneaten feed, animal manure, the use of
chemicals and medicines, crossbreeding, and
the transmission of parasites and diseases
between cultured species and wild fish [2–6].
Sediment below the aquaculture cages often
accumulates high organic content from food
and fish feces (biological) and other cultured
organisms. Still, the sedimentation rate is
highly dependent on culture location, species
reared, type of feed, culture operation
management, water flow, and depth. Studies
from different parts of the world show
significant variation in sediment rates, but in
general, most areas below the cage bottom have
a sedimentation rate increase 2–20 times
greater than that of other areas with no farming
activities [7–10]. In the salmon farming
industry, Hargrave (1994) [11] determined the
organic carbon content below the trout cage to
be 500 times higher, and other studies such as
Brown et al., (1987) [12] found very high
organic matter content, high sulfur content, and
very little dissolved oxygen. The high organic
content results from excess feed and fecal
waste in intensive cage culture operations.
Macrobenthic communities are considered
“key species” in environmental quality
monitoring programs. This species is capable of
little transport, making it hard for them to avoid
the adverse effects of the aquatic and
sedimentary environment. Besides, they have a
relatively long-life cycle, enabling them to
indicate or synthesize disturbances in the
aquatic and sedimentary environment over
time. Moreover, this group consists of many
species with good tolerance to significant
environmental changes and can also proliferate
190
to
form
dominant
populations
[13].
Furthermore, benthic animals are essential in
nutrient cycling, sediments, and water column
[14, 15].
This paper presents the status of the
macrobenthic community at the coastal cage
sites of Xuan Dai bay, Song Cau town, in Phu
Yen province. These results form the basis for
establishing an appropriate set of biological
indicators to assess and warn environmental
risks for coastal cage farming.
MATERIAL AND METHODS
Study sites
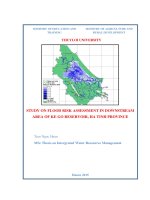
This study was carried out at three stations
in Xuan Dai bay in South Central Vietnam,
coded X1 (109.243123E; 13.472407N); X2
(109.268754E;
13.45524N),
and
Xr
(109.239895E; 13.429361N), marked in Fig. 1.
Two stations (X1, X2) locate inside the cage
culture areas, and the reference station (Xr) is
in non-cage culture areas.
Figure 1. The map of study sites
Sample collection and analysis
Six surveys of macrobenthos samples
collection were conducted at three stations
Phan Thi Kim Hong et al./Vietnam Academy of Science and Technology (VAST) 2022, 22(2) 189–198
during the dry and rainy seasons (Table 1). Five
replicate samples were collected at each station.
The benthic samples were collected using Van
Veen grab with an area of 0.04 m2.
Table 1. Information on the six surveys
Seasons
Dry Seasons
Dry Seasons
Rainy Seasons
Rainy Seasons
Dry Seasons
Dry Seasons
Month
Jun. 2019
Aug. 2019
Nov. 2019
Jan. 2020
Mar. 2020
May 2020
Survey code
2
3
4
5
6
7
The sediment samples were washed and
sieved through a 500 µm mesh to collect all
groups of the organisms. The specimens were
then fixed with 70% alcohol and transferred to
the laboratory. At the laboratory, macrobenthos
was sorted into four main groups: polychaetes
(Po.), molluscs (Mo.), crustaceans (Cr.), and
echinoderms (Ec.); then identified as the lowest
taxon as possible and counted. Classification of
benthic
animals
by
anatomical
and
morphological comparison method according
to [16–31].
Data analysis
Data were processed using Excel software.
Analysis of the benthic community
structure was carried out through the indices of
diversity (H′), species richness (D), and
evenness (J) using Primer 6.0 software.
Diversity index (H′) (Shannon and
Weaver).
H′ =
∑
n
i =1
ni ni
ln
N N
(1)
where: ni: number of individuals of species i;
N: total number of individuals.
Evenness index J (Pielou):
J = H ′ log S
(2)
where: H′ is the Shannon diversity index; S is
the total number of species.
Species richness index D (Margalef):
=
D
( S − 1)
ln N
(3)
where: S: total number of species; N: the total
number of individuals.
Station X1
X1.2
X1.3
X1.4
X1.5
X1.6
X1.7
Station X2
X2.2
X2.3
X2.4
X2.5
X2.6
X2.7
Station Xr
Xr.2
Xr.3
Xr.4
Xr.5
Xr.6
Xr.7
Analysis the average cluster group was
based on the data of species composition and
density using the Bray-Curtis similarity
method. The data were converted to logx
before analysis.
The Two-way ANOVA was used to check
the difference in density and biodiversity
indices among seasons and survey stations.
RESULTS
Macrobenthic diversity
Analyzed 1966 macrobenthos individuals
from 90 soft bottom quantitative samples
recorded 80 taxa belonging to 49 families and 5
classes. The class Polychaetes was recorded as
the most diverse species composition with 53
taxa (66% of the total number of taxa), with
some families having more taxa than the others,
such as Spionidae (7 taxa), Capitellidae (6
taxa), Cirratulidae (4 taxa). The crustacean
group had 14 taxa (18%) belonging to 13
families; Molluscs had 9 taxa (11%) belonging
to 6 families of class Bivalvia. The
echinoderms had 4 taxa (5%), and all belonged
to Amphiuridae, the Order Ophiurida family.
There was a remarkable difference in
species diversity as well as the structure of
macrobenthic species between the cage culture
stations and the reference station (Table 2). The
reference station (Xr) had 69 recorded taxa
which were 2.38 times higher than the number
of taxa at two stations in the cage culture area
X1 and X2 (both had the same number of 29
taxa). This result confirmed the reveal of Habib
et al., (2020) [32].
The analysis also showed that the
Capitella capitata of the family Capitellidae,
an indicator of organic pollution that
191
Phan Thi Kim Hong et al./Vietnam Academy of Science and Technology (VAST) 2022, 22(2) 189–198
dominates the benthic community at fish
farming [33–34], was recorded in both stations
of the cage culture stations but was not present
at the reference station.
In particular, the species Ceratonereis sp.
belonging to the family Nereididae only
appeared in station X1 with a very high
frequency (80%) but did not appear in both
station X2 (cage culture stations) and Xr
(reference station). In contrast, some species
that appeared in the reference station with high
frequency but not or very rarely recorded in the
cage culture station, such as Linopherus sp.
(57%), Orbinia vietnamensis (53%), Sternaspis
papillosa (50%), Terebellides stroemii (53%)
and Laonome triangularis (33%). Especially,
the species of echinoderms group were only
recorded in the reference station (Xr).
Table 2. Number of taxa of macrozoobenthos groups
at surveyed stations at Xuan Dai bay (family level)
Area
Station
Polychaeta
Acoetidae
Amphinomidae
Capitellidae
Cirratulidae
Cossuridae
Chaetopteridae
Chrysopetalinae
Eunicidae
Glyceridae
Goniadidae
Hesionidae
Lumbrineridae
Magelonidae
Melinnidae
Nephtyidae
Nereididae
Oenonidae
Onuphidae
Opheliidae
Orbiniidae
Paralacydoniidae
Paraonidae
Pilargidae
Poecilochaetidae
Polynoidae
Sabellidae
Spionidae
Sternaspidae
Trichobranchidae
Crustacea
Alpheidae
Anthuridae
Bodotriidae
Chasmocarcinidae
Ectinosomatidae
Gammaridae
192
Cage culture
X1
23
X2
22
2
2
1
2
2
2
1
1
2
2
2
1
1
1
2
2
1
1
1
1
1
5
1
1
1
6
2
1
4
1
1
1
Reference
Xr
47
1
2
5
3
1
1
1
1
1
1
2
1
1
1
3
2
1
1
2
1
1
1
1
1
2
6
2
1
11
1
1
1
1
1
1
Total
53
1
2
6
4
1
1
1
1
1
1
2
1
1
1
3
3
2
1
2
1
1
1
1
1
1
2
7
2
1
14
2
1
1
1
1
1
Phan Thi Kim Hong et al./Vietnam Academy of Science and Technology (VAST) 2022, 22(2) 189–198
Area
Station
Harpactidae
Leptocheliidae
Mysidae
Palaemonidae
Parapseudidae
Pasiphaeidae
Portunidae
Echinodermata
Amphiuridae
Mollusca
Corbulidae
Lucinidae
Pteriidae
Solenidae
Tellinidae
Veneridae
Total
Cage culture
X1
X2
1
Reference
Xr
1
1
1
1
4
1
3
1
2
1
29
2
29
38
Macrobenthic density
The average density of the macrobenthic
community in the cage culture stations was 420
± 258.6 at X1, and 523 ± 412.3 at X2
individuals/m2 (ind./m2); the reference station
(Xr) was higher in density (695 ± 310.7
ind./m2) comparing to both cage culture
stations. Polychaetes population always
dominated at all stations, with an average
density of 388 ± 218.2 ind./m2 (92.5 % of total
density) at X1, 514 ± 410.3 ind./m2 (98.3%) at
X2, and 623 ± 288.1 ind./m2 (89.7%) at Xr
(Table 3). Crustaceans, molluscs, and
echinoderms had a very low density, varying
from 0–6.1%. Nevertheless, the difference in
the average density of the macrobenthic
community was not statistically significant
between stations (p = 0.65) and survey seasons
(p = 0.39) in Xuan Dai bay.
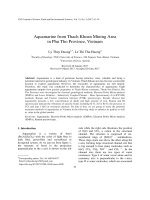
Macrobenthic community structure
Analysis of the benthic community
structure in the study area by the Bray-Curtis
similarity method shows 3 main groups
representing 3 survey stations X1, X2, and Xr
(Figure 2).
Group 1 includes a collection of 27
benthic taxa obtained at station X1 (except for
X1.7) with 41% similarity. The benthic species
composition in the rainy season surveys (X1.4
1
1
4
4
7
1
1
1
2
2
69
69
Total
1
1
1
1
1
1
1
4
4
9
1
1
1
1
3
2
80
80
and X1.5) had a very high similarity (68%),
while that in the dry season ranges from 41–
55%. The dominant species of this group were
Ceratonereis sp., Ophelia grandis, Prionospio
cirrifera, and Pseudopolydora sp. with the rate
of 37%, 15.5%, 10.3%, respectively.
Group 2 includes macrobenthos at station
X2 (except for X2.3 of the August 2019 survey)
and X1.7 with a similarity level of 45%. The
two surveys in the rainy season had a similarity
of 50% and in the dry season from 36–50%.
The most dominant density of this group
belongs to Cossura longocirrata (64% of total
group density); the remaining 26 species
account for only 0.2–7.3%.
Group 3 includes a collection of 62
benthic taxa of the reference station (except
Xr.2 in the June 2019 survey) with a similarity
level of 45%. There was a little change in
species composition between the rainy and dry
seasons (ranging from 45–50%). Cirriformia
sp. accounted for the highest density (25.9%),
and the remaining species accounted for 0.1–
12.2%.
Thus, there was a difference in the structure
of benthic fauna between the cage culture area
and the non-cage culture area. Group 3 had
only a similarity of about 24% to groups 1 and
2. Moreover, the two stations in the cage
193
Phan Thi Kim Hong et al./Vietnam Academy of Science and Technology (VAST) 2022, 22(2) 189–198
culture area also had different species
compositions (only 27% of similarity). Both
stations had dominant species, but
composition and density were different.
the
Table 3. Density (ind./m2) of macrobenthic community in Xuan Dai bay
Station
X1.2
X1.3
X1.4
X1.5
X1.6
X1.7
Mean X1
SD
X2.2
X2.3
X2.4
X2.5
X2.6
X2.7
Mean X2
SD X2
Xr.2
Xr.3
Xr.4
Xr.5
Xr.6
Xr.7
Mean Xr
SD Xr
Po.
230
160
485
720
510
225
388
218.2
200
155
700
525
270
1,235
514
410.3
360
500
305
840
690
1,045
623
288.1
Cr.
0
0
20
110
5
0
23
43.6
0
5
0
10
0
15
5
6.3
10
35
15
95
60
40
43
31.4
Ec.
0
0
0
0
0
0
0
0.0
0
0
0
0
0
0
0
0,0
0
55
5
0
5
10
13
21.2
Mo.
0
0
25
5
15
10
9
9.7
5
10
0
10
0
0
4
4,9
15
40
5
15
0
25
17
14.4
Total
230
160
530
835
530
235
420
258.6
205
170
700
545
270
1,250
523
412.3
385
630
330
950
755
1,120
695
310.7
Transf orm: Log(X+1)
Resemblance: S17 Bray Curtis similarity
20
Similarity
40
60
Xr.4
Xr.3
Xr.6
Xr.5
Xr.7
Xr.2
X2.3
X2.2
X1.7
X2.6
X2.5
X2.7
X2.4
X1.5
X1.4
X1.6
X1.3
100
X1.2
80
Figure 2. Bray-Curtis similarity analysis of macrobenthic community at study stations
The results of species richness, diversity,
and evenness indices of the macrobenthic
194
community in the Xuan Dai bay are shown in
Table 4.
Phan Thi Kim Hong et al./Vietnam Academy of Science and Technology (VAST) 2022, 22(2) 189–198
Table 4. Species richness, diversity, and evenness indices
of the macrobenthic community in the Xuan Dai bay
Month
Jun. 2019
Aug. 2019
Nov. 2019
Jan. 2020
Mar. 2020
May 2020
Mean
SD
Survey code
2
3
4
5
6
7
D
1.57
2.60
3.43
2.34
2.36
3.12
2.57
0.65
Station X1
J
0.62
0.87
0.81
0.64
0.59
0.93
0.75
0.15
H'
1.20
2.01
2.30
1.65
1.48
2.39
1.84
0.47
The species richness index (D) values
varied from 1.50 (X2.6) to 6.82 (Xr.3).
Generally, the D values were higher, an
average of 5.34 (±0.95), at the reference
station Xr than at the two stations in the
culture area X1 and X2, with the averages of
2.57 (±0.65) and 2.19 (±0.71), respectively.
This result was consistent with the study of
Habib et al., (2020) [32] that the highest D
value was obtained in the non-cage culture
area. The two-way ANOVA showed species
richness index was significantly different
between stations (p = 0.00), but it was not
significant between seasons (p = 0.90) and
station*season interaction (p = 0.19).
D
1.88
2.55
1.62
3.41
1.50
2.17
2.19
0.71
Station X2
J
0.67
0.94
0.40
0.56
0.49
0.48
0.59
0.20
H'
1.39
2.17
0.88
1.58
0.94
1.22
1.36
0.48
D
5.29
6.82
4.06
5.15
4.78
5.91
5.34
0.95
Station Xr
J
0.77
0.84
0.78
0.77
0.78
0.75
0.78
0.03
H'
2.43
2.98
2.25
2.55
2.51
2.64
2.56
0.24
The diversity index (H′) ranged between
0.88 (X2.4) and 2.98 (Xr.3). The average value
of H′ was highest at the reference station Xr
(2.56 ± 0.24) and lowest at station X2 (1.36 ±
0.48), with a significant difference between
stations (p = 0.003). The difference between
survey seasons and station*season interaction
was not statistically significant (p = 0.73 and
p = 0.67, respectively). According to Habib et
al., (2020) [32] in the study on the
macrobenthic community around fish cage
culture in Bangladesh pointed out the range of
H′ value from 1.34 (in cage culture site) to
2.10 (in non-cage culture site), the present
study has the same conclusion.
Table 5. The contribution of species at survey stations
Station
X1
X2
Xr
Species
Ceratonereis sp.
Sigambra sp.
Prionospio cirrifera
Oxydromus angustifrons
Poecilochaetus paratropicus
Cossura longocirrata
Sigambra sp.
Prionospio komaeti
Polydora sp.
Prionospio cirrifera
Cirriformia sp.
Sigambra sp.
Cossura longocirrata
Linopherus sp.
Orbinia vietnamensis
For the evenness index (J), the lowest
average value was recorded at station X2
(J = 0.59 ± 0.20) since the presence of two
Contribution (%)
27.57
18.36
12.17
9.28
9.16
43.52
15.38
8.57
6.89
6.63
17.33
14.98
8.40
8.15
6.71
Cumulation (%)
27.57
45.93
58.10
67.38
76.54
43.52
58.89
67.47
74.36
80.99
17.33
32.31
40.71
48.86
55.56
dominant species Cossura longocirrata
(contributed 43.52%) and Sigambra sp.
(contributed 15.38%) led to an imbalance in the
195
Phan Thi Kim Hong et al./Vietnam Academy of Science and Technology (VAST) 2022, 22(2) 189–198
macrobenthic community (Table 5). The
dominant species were also different between
two cage culture stations, Ceratonereis sp. and
Sigambra sp. (contributed 27.57 and 18.36%),
dominated at station X1. The highest value of
the evenness index was estimated at the
reference station Xr (J = 0.78 ± 0.03), revealing
the most balanced macrobenthic community.
This result also shows the same opinion as [32].
Nevertheless, the difference was not
statistically significant between stations (p =
0.07), season (p = 0.38) and station*season
interaction (p = 0.65).
CONCLUSION
The present study demonstrates the
differences in macrobenthic community
between the survey stations: stations in the cage
culture area (X1, X2) and the reference station
(Xr) in the non-cage culture area of Xuan Dai
bay. The number of macrobenthic taxa and
their density in the reference station (Xr) is
higher than in stations X1 and X2. The
Shannon-Wiener diversity index (H'), the
Pielou’s Evenness Index (J), and Margalef’s
species richness index (D) are examined for all
stations. The macrobenthic community in the
reference station has the highest H', D, and J
values compared to stations X1 and X2.
Capitella capitata, the benthic organism used
as an indicator for organic pollution, was only
recorded in the cage culture area at both
stations. Furthermore, some dominant species
appeared in the culture stations, such as
Cossura longocirrata (contributed 43.52% in
station X1) and Ceratonereis sp. (contributed
27.57% in station X2). These species are
opportunistic species that can adapt to
disturbed environmental conditions.
Further studies on the macrobenthic
community dynamic with ecological criteria
could support establishing a set of biological
indicators to monitor the environmental quality
of the coastal aquaculture area.
Acknowledgements: The authors acknowledge
the VAST project of “Using biological
indicators to assess environmental impacts of
coastal cage aquaculture in South Central
196
Vietnam”, grand number: VAST06.03/19–20
for funding part of this study.
This paper contributes to celebrating the
100th Anniversary of the Institute of
Oceanography, Vietnam Academy of Science
and Technology.
REFERENCE
[1] Department of Economic, Song Cau
Town, 2000. Plan of aquaculture in Xuan
Dai bay to 2025, vision to 2030. (in
Vietnamese)
[2] Karakassis, I., Tsapakis, M., Hatziyanni,
E., Papadopoulou, K. N., and Plaiti, W.,
2000. Impact of cage farming of fish on
the seabed in three Mediterranean coastal
areas. ICES Journal of Marine Science,
57(5),
1462–1471.
/>10.1006/jmsc.2000.0925
[3] Black, K. D. (Ed.), 2001. Environmental
impacts of aquaculture (Vol. 5). Taylor &
Francis US. 214 p.
[4] Buschmann, A. H., Riquelme, V. A.,
Hernández-González, M. C., Varela, D.,
Jiménez, J. E., Henríquez, L. A., Vergara,
P. A., Gđez, R., and Filún, L., 2006. A
review of the impacts of salmonid
farming on marine coastal ecosystems in
the southeast Pacific. ICES Journal of
Marine Science, 63(7), 1338–1345.
/>021
[5] Apostolaki, E. T., Tsagaraki, T., Tsapakis,
M., and Karakassis, I., 2007. Fish farming
impact on sediments and macrofauna
associated with seagrass meadows in the
Mediterranean. Estuarine, Coastal and
Shelf
Science,
75(3),
408–416.
/>[6] Giles, H., 2008. Using Bayesian networks
to examine consistent trends in fish farm
benthic impact studies. Aquaculture,
274(2–4),
181–195.
/>10.1016/j.aquaculture.2007.11.020
[7] Hall, P., and Holby, O., 1986.
Environmental impact of a marine fish
cage culture. ICES CM, 1–14.
[8] Weston, D. P., and Gowen, R. J., 1988.
Assessment and prediction of the effects
of salmon net-pen culture on the benthic
Phan Thi Kim Hong et al./Vietnam Academy of Science and Technology (VAST) 2022, 22(2) 189–198
[9]
[10]
[11]
[12]
[13]
[14]
[15]
[16]
[17]
environment. Seattle, Washington, Dept.
of Fisheries. Technical report 414.
Kupka-Hansen, P., 1991. Organic waste
from marine fish farms: effects on the
seabed,
Marine
aquaculture
and
environment. Nord, 22, 105–119.
Holmer, M., Pérez, M., and Duarte, C.
M., 2003. Benthic primary producers––a
neglected environmental problem in
Mediterranean maricultures?. Marine
Pollution Bulletin, 46(11), 1372–1376.
/>00396-5
Hargrave, B. T., 1994. A benthic
enrichment index. In Modelling Benthic
Impacts of Organic Enrichment from
Marine Aquaculture (Vol. 1949, pp. 79–
91). Canadian Technical Report of
Fisheries and Aquatic Sciences, Canada.
Brown, J. R., Gowen, R. J., and
McLusky, D. S., 1987. The effect of
salmon farming on the benthos of a
Scottish
sea
loch.
Journal
of
Experimental Marine Biology and
Ecology, 109(1), 39–51. />10.1016/0022-0981(87)90184-5
Gray, J. S., and Pearson, T. H., 1982.
Objective Selection of Sensitive Species
Indicative of Pollution-Induced Change in
Benthic Communities. I. Comparative
Methodology. Marine ecology progress
series. Oldendorf, 9(2), 111–119.
Hily, C., 1984. Variabilité de la
macrofaune benthique dans les milieux
hyper-trophiques de la rade de Brest.
Doctoral dissertation.
Dauer, D. M., 1993. Biological criteria,
environmental health and estuarine
macrobenthic
community
structure.
Marine Pollution Bulletin, 26(5), 249–
257.
/>Abbott, R. T., 1991. Seashells of
southeast Asia. Graham Brash.
Abbott, R. T., and Dance, S. P., 1986.
Compendium of Seashells. A Color Guide
to More than 4,200 of the World’s
MarineShells. Third printing (revised).
Madison Pub1 Assoc, 41(1).
[18] Böggemann, M., and Eibye-Jacobsen, D.,
2002. The glyceridae and goniadidae
(Annelida: Polychaeta) of the bioshelf
project, Andaman Sea, Thailand. Phuket
Marine Biological Center Special
Publication, 24, 149–196.
[19] Cernohorsky, W. O., 1972. Marine shells
of the Pacific. Volume II. Pacific
Publications. Sydney. 411 p.
[20] Aiyun, D., and Siliang, Y., 1991. Crabs of
the China seas. China Ocean Press. ISBN
3-540-15719-0 or 0-387-15719-0
[21] Dance, S. P., 1977. Das grobe Bush der
Meeresmuscheln: Schnecken u. Muscheln
d. Weltmeere. Verlag Eugen Ulmer
Stuttgart. 304 p.
[22] Day, J. H., 1967. A monograph on the
Polychaeta of Southern Africa. British
Museum of Natural History, Publication,
(656), 1–878.
[23] Fauvel, P., 1953. The fauna of India.
Annelida Polychaeta. Allahabad, i–xii.
[24] Fitzhugh, K., 2002. Fan worm
polychaetes (Sabellidae: Sabellinae)
collected during
the
Thai-Danish
BIOSHELF project. Phuket Marine
Biological Center Special Publication,
24, 353–424.
[25] Gallardo, V. A., 1968. Polychaeta from
the Bay of Nha Trang, South Viet Nam.
Naga report, 4(3), 35–279.
[26] Holthuis, L., 1993. The Recent Genera of
the Caridean and Stenopodidean Shrimps
(Crustacea. Decapoda) with an Appendix
on the Order Amphionidacea. Nationaal
Natuurhistorisch Museum, Leiden, 328 p.
[27] Imajima, M., 1972. Review of the annelid
worms of the family Nereidae of Japan,
with descriptions of five new species or
subspecies. Bulletin of National Science
Museum, 15, 37–153.
[28] Morris, P. A., and Clench, W. J., 1975. A
field guide to shells: of the Atlantic and
Gulf Coast and the West Indies (No. QL
416. M67 1975).
[29] Radashevsky, V. I., and Hsieh, H. L.,
2000. Polydora (Polychaeta: Spionidae)
species from Taiwan. Zoological StudiesTaipei-, 39(3), 203–217.
197
Phan Thi Kim Hong et al./Vietnam Academy of Science and Technology (VAST) 2022, 22(2) 189–198
[30] Sakai, T., 1976. Crabs of Japan and the
adjacent seas. Kodansha Ltd, Tokyo,
Japan.
[31] Serene, R., 1984. Crustaces Decapodes
Brachyoures de l'Ocean Indien occidental
et de la Mer Rouge. Xanthoidea:
Xanthidae et Trapeziidae. Addendeum
Carpillidae et Menippidae-A. Crosnier.
Faune Tropicale (ORSTOM), 24, 1–400.
[32] Tania, N. J., Hossain, M. B., Habib, A.,
and Musa, N., 2020. Effects of fish cage
culture on macrobenthic communities in a
subtropical river. Biodiversitas, 21(8),
198
3583–3589.
/>biodiv/d210822
[33] Tsutsumi, H., 1987. Population dynamics
of Capitella capitata (Polychaeta;
Capitellidae) in an organically polluted
cove. Mar. Ecol. Prog. Ser, 36, 139–149.
[34] Tsutsumi, H., Fukunaga, S., Fujita, N.,
and Sumida, M., 1990. Relationship
between growth of Capitella sp. and
organic enrichment of the sediment.
Marine
ecology
progress
series.
Oldendorf, 63(2), 157–162.