Incidence and factors related to nonmotorized scooter injuries in New York State and New York City, 2005–2020
Bạn đang xem bản rút gọn của tài liệu. Xem và tải ngay bản đầy đủ của tài liệu tại đây (1.67 MB, 8 trang )
(2022) 22:1974
Tuckel BMC Public Health
/>
Open Access
RESEARCH
Incidence and factors related
to nonmotorized scooter injuries in New York
State and New York City, 2005–2020
Peter Tuckel*
Abstract
Background: This study provides an analysis of contemporary trends and demographics of patients treated for
injuries from nonmotorized scooters in emergency departments in New York state excluding New York City (NYS) and
New York City (NYC).
Methods: The study tracks the incidence of nonmotorized scooter injuries in NYS and NYC from 2005 to 2020
and furnishes a detailed profile of the injured patients using patient-level records from the Statewide Planning and
Research Cooperative System (SPARCS). A negative binomial regression analysis is performed on the SPARCS data to
measure the simultaneous effects of demographic variables on scooter injuries for NYS and NYC. The study also examines the demographic correlates of the rate of injuries at the neighborhood level in NYC. A thematically shaded map
of the injury rates in New York City neighborhoods is created to locate neighborhoods with greater concentrations of
injuries and to identify the reasons which might account for their higher rate of injuries, such as street infrastructure.
Results: In NYS and NYC injuries from unpowered scooters underwent an overall decline in the past decade. However, both NYS and NYC are now evidencing an increase in their rates. The upswing in the rate in NYC in 2020 is particularly noticeable. Males and children in the age group 5 to 9 were found to be most susceptible to injury. Injuries
were more prevalent in more affluent New York City neighborhoods. A map of the injury rates in the City’s neighborhoods revealed a clustering of neighborhoods with higher than average injury rates.
Conclusions: Injuries from nonmotorized scooters number approximately 40,000 annually in the US and can be
prevented by greater use of protective equipment. Street infrastructure is a critical factor contributing to injuries from
the use of nonmotorized scooters. Thematically shaded maps can be used to identify and target areas for purposes of
intervention.
Keywords: Nonmotorized scooters, Unpowered scooters, Kick scooters, Injuries, Epidemiology, Emergency
department
Background
With the advent of electric scooters or e-scooters, epidemiologic study has shifted away from injuries owing to
nonmotorized scooters. Little systematic study has been
*Correspondence:
Department of Sociology, Hunter College, City University of New York, 695
Park Avenue, New York, NY 10065, USA
accorded this topic in the last decade. Yet it is estimated
that approximately 40,000 individuals are injured from
using a nonmotorized scooter each year in the United
States [1]. The epidemiologic research which has been
undertaken concerning nonmotorized scooters generally has focused on individual-level attributes of patients,
their diagnoses, and treatment modalities [2–5].
© The Author(s) 2022. Open Access This article is licensed under a Creative Commons Attribution 4.0 International License, which
permits use, sharing, adaptation, distribution and reproduction in any medium or format, as long as you give appropriate credit to the
original author(s) and the source, provide a link to the Creative Commons licence, and indicate if changes were made. The images or
other third party material in this article are included in the article’s Creative Commons licence, unless indicated otherwise in a credit line
to the material. If material is not included in the article’s Creative Commons licence and your intended use is not permitted by statutory
regulation or exceeds the permitted use, you will need to obtain permission directly from the copyright holder. To view a copy of this
licence, visit http://creativecommons.org/licenses/by/4.0/. The Creative Commons Public Domain Dedication waiver (http://creativeco
mmons.org/publicdomain/zero/1.0/) applies to the data made available in this article, unless otherwise stated in a credit line to the data.
Tuckel BMC Public Health
(2022) 22:1974
This study provides an analysis of contemporary trends
and demographics of patients treated in emergency
departments for nonmotorized scooter injuries in New
York state excluding New York city (NYS) and New York
city (NYC). The study tracks the incidence of patients
injured from the use of nonmotorized scooters from
2005 to 2020 and describes the demographic characteristics of patients in NYS and NYC. In addition, the analysis investigates the demographic correlates of the rate of
injuries from the use of nonmotorized scooters in each
of the neighborhoods in NYC and maps the incidence of
the injury rate in the different neighborhoods to identify
patterns of geographic concentration. Thus the analysis
examines the effect of both individual-level and contextual-level variables on the risk of injury.
Methods
Data sources
The author analyzed data primarily from emergency
department (ED) visits for NYS and NYC. The analysis
centered on patient-level records for NYS and for NYC
consisting of a wide number of demographic, diagnostic,
and treatment variables. Geographic identifiers such as
the 5-digit zip code in which the patient lives were also
included among the variables in these records.
The patient-level records were accessed from the
Statewide Planning and Research Cooperative System
(SPARCS) [6]. SPARCS is responsible for maintaining
information on all outpatient, inpatient, and ambulatory
surgery patients treated in a hospital located in the state
of New York.
Variables
Injury code
Two separate injury codes provided identification of
patients who were injured while using a nonmotorized scooter. The specific codes used in this study were
restricted to patients who fell from a nonmotorized
scooter. The International Classification of Diseases,
Ninth Revision (ICD-9-CM) External Cause of Injury
Code (E-code) E885.0 – Fall from (nonmotorized)
scooter – was used for the years prior to 2015. On October 1, 2015 ICD-9-CM was replaced by ICD-10-CM.
Therefore both the ICD-9-CM E-code 885.0 and the
ICD-10-CM code V00.141A – Fall from (nonmotorized)
scooter, initial encounter – were applied for the year
2015. However, only the ICD-10-CM code V00.141A was
applied for the years from 2016 to 2020.
Sociodemographic characteristics
In addition to the SPARCS data providing information about the age and gender of patients, SPARCS also
included two variables relating to the patient’s race and
Page 2 of 8
ethnicity. These two variables were used to construct a
typology of race-ethnicity consisting of 4 values: nonHispanic White, non-Hispanic Black, non-Hispanic
Asian, and Hispanic.
Statistical analyses
Two generalized linear negative binomial regression
analyses with log-link (NB2 models) were performed to
measure the total effects of year and demographic characteristics (i.e., gender, age, racial-ethnic background)
on the incidence of injuries resulting from falling from a
nonmotorized scooter, The first analysis was conducted
among patients residing in NYS. The second analysis
was restricted to patients residing just in NYC. Negative
binomial regression analyses were performed instead of
Poisson regression because of the presence of overdispersion in the data.
The dependent variable in these analyses consisted on
the population-based counts of the number of outpatients and inpatients together who sustained an injury
due to a fall from a nonmotorized scooter. The predictor variables were year, year squared, year cubed, and the
patient’s gender, age, and racial-ethnic background. Year
was measured as an interval-level variable with values
ranging from 1 (corresponding to the year 2005) to 16
(corresponding to the year 2020). Year squared and year
cubed terms were inserted in the analysis to measure any
nonlinear effects of the time variable. Gender was coded
by a value of 1 for male and 2 for female. Age consisted
of 6 categories: under 5, 5 to 9, 10 to 14, 15 to 24, 25 to
44, and 44 and older. The racial-ethnic variable was composed of 4 groups: non-Hispanic White, non-Hispanic
Black, non-Hispanic Asian, and Hispanic (any race).
An offset variable was introduced into both analyses to
control for the differing risk levels of a scooter injury
associated with varying population sizes, The offset variable was created via a two-step process. First, population
counts (based on the Centers for Disease Control and
Prevention’s Bridged-Race Population Estimates, 1990–
2020) were derived for each combination of year, gender,
age-group, and racial-ethnic category separately for NYS
and for NYC [7]. As an example one population count
would consist of non-Hispanic Black females between
the ages of 10 to 14 living in NYC in 2014. Altogether, the
total number of population counts equaled 768 each for
NYS and for NYC.
A multiple-step procedure was undertaken to measure the demographic variables associated with the rate of
scooter injuries at the neighborhood level in NYC, Step
1: The number of outpatients and inpatients combined
under the age of 18 were summated for each 5-digit zip
code in NYC with a nonzero population (N = 179) for
the years 2018, 2019, and 2020. Step 2: These numbers
Tuckel BMC Public Health
(2022) 22:1974
were averaged across the three years. Step 3: The averages
were aggregated up to the United Health Fund (UHF)
level (N = 42) and divided by the population of each UHF
district estimated to be under the age of 18 to obtain an
injury rate. The injury rates were then correlated with a
battery of socio-demographic variables originally tabulated at the zip code level which were also aggregated up
to the UHF level. The socio-demographic variables were
derived from the American Community Survey (ACS)
2005–2019 (5-Year Estimates) [8]. The following variables
were used: (1) the racial-ethnic composition of the UHF
district, (2) median family income, (3) per capita income,
(4) percent of the population 25 years of age and over
with a B.A. degree or more, (5) percent of the population
under the age of 18 below the poverty rate, (6) percent of
the population without health insurance, and (7) percent
of those with health insurance who have public health
insurance.
An additional analysis was also undertaken to determine if there were a relationship between the presence
or absence of a skate park and the injury rate. A list of
the “official” and other major skate parks in NYC (N = 37)
was employed to carry out this analysis. An indicator variable was then created with values of 1 and 0 to measure
the presence or absence of a skate park in NYC zipcodes.
These data were then aggregated up to the UHF district
level.
Spatial analysis
A spatial analysis was carried out to identify the existence of geographic patterns of concentration in the
incidence of falls from unpowered scooters at the neighborhood level in NYC. This analysis consisted of creating a thematically shaded map of the injury rate by the
Page 3 of 8
UHF district in which the patient lived. A Global Moran’s
I was calculated to uncover any significant clustering in
the spatial distribution of patients’ residences.
Results
Overall trends
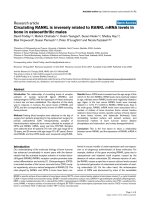
Figure 1 depicts the annual rate of injuries due to falls
from nonmotorized scooters in NYS excluding NYC
and NYC during the time span from 2005 to 2020. For
NYS excluding NYC, the rate of injuries veered upwards
from 2005 toto 2008, declined moderately from 2008 to
2014, underwent a precipitous fall in 2015 and inched up
slightly since then. For NYC the rate climbed from 2005
to 2010, plateaued until 2014, sharply declined in 2015,
and then has spiraled upwards from 2016 onwards.
Demographics and other characteristics
In line with previous research findings, both gender and
age are strongly related to the incidence of injury [2, 3, 5].
The injury rate of males is more than 1.6 times the corresponding rate for females (Table 1). With respect to age,
the highest rate is among the age group 5 to 9 (50.45), followed by the age group 10 to 14 (35.13), and then children under 5 (14.23). The rate of injuries declines sharply
after the age of 14. Overall, the rate of Hispanics (8.74) is
somewhat greater that of non-Hispanic whites (7.09) and
non-Hispanic blacks (7.93). These three groups exceed by
a wide margin the rate of non-Hispanic Asians (4.27).
Combining trends and demographics
Table 2 exhibit the results of two negative binomial
regression analyses examining the simultaneous effects
of year, the nonlinear effects of year, and demographic
Fig. 1 Annual Injury Rate from Nonmotorized Scooters (per 10,000) by New York State Excluding New York City and New York City
Tuckel BMC Public Health
(2022) 22:1974
Page 4 of 8
Table 1 Demographics and rates of patients treated for
nonmotorized scooter related injuries: 2005-2020a
Characteristic
New York State
New York City
Total
Number (Rate) Number (Rate) Number (Rate)
Total
12,285
10,278
22,563
Gender
Male
7100 (8.15)
6521 (10.55)
13,621 (9.14)
Female
5185 (5.74)
3757 (5.51)
8942 (5.64)
Age group
b
Exp (b)
p value
95% CI
Year
.373
1.452
.001
1.175-1.795
Year squared
-..050
.951
.001
.924-.979
Year cubed
.002
1.002
.004
1.001-1.003
Male
.418
1.519
.000
1.283-1.799
Female
(ref. cat.)
Gender
Age category
Under 5
2.297
9.940
.000
7.291-13.552
5 to 9
3.788
44.177
.000
32.872-59.370
Under 5
1014 (10.24)
1591 (18.94)
2605 (14.23)
10 to 14
3.339
28.187
.000
20.956-37.912
5–9
5047 (47.57)
4057 (54.56)
9104 (50.45)
15 to 24
.984
2.675
.000
1.951-3.668
1.343
.070
.977-1.848
10–14
4171 (36.52)
2417 (32.97)
6588 (35.13)
25 to 44
.295
15–24
740 (2.98)
657 (3.88)
1397 (3.34)
45 and older
(ref. cat.)
Race/ethnicity
25–44
566 (1.31)
878 (2.15)
1444 (1.72)
45 and older
747 (.96)
678 (1.38)
1425 (1.13)
Race-Ethnicity
a
Variable
New York State (excluding New York City)
Excluding
New York City
Table 2 Negative Binomial Estimates of Injuries From Nonmotorized
Non-Hispanic
White
9492 (6.95)
3353 (7.52)
12,845 (7.09)
Non-Hispanic
Black
1253 (7.79)
2470 (8.0)
3723 (7.93)
Non-Hispanic
Asian
180 (2.55)
910 (4.92)
1090 (4.27)
Hispanic
1360 (7.45)
3545 (9.37)
4905 (8.74)
Rates calculated per 100,000 population
variables on the incidence of scooter injuries resulting in
a visit to a hospital ED.
The results of the first analysis presented in Table 2
were confined to patients residing in NYS and the results
of the second analysis also displayed in Table 2 were
limited to just residents of NYC. The tables present the
unstandardized b coefficients, the exponentiated b coefficients (the rate ratios) the significance levels of the coefficients, and the 95% CIs of the rate ratios.
Inspection of the data for NYS reveals that the year
cubed term was statistically significant, denoting the
presence of a cubic fit concerning the time variable. This
result indicates that, after holding constant the demographic variables in the model, the likelihood of being
injured changed direction twice with the passage of time.
Consistent with the findings from earlier research,
there is a noticeable gender gap in the likelihood of sustaining a scooter injury. Males are one and a half times
as likely to visit an ED as a result of a scooter injury than
females.
As expected, age is a major determinant of the risk of
injury. Compared to patients 45 years of age and older
Non-Hispanic White
.243
1.275
.029
1.025-1.586
Non-Hispanic Black
.253
1.288
.031
1.023-1.622
Non-Hispanic Asian
-.791
.453
.000
.343-..599
Hispanic
(ref. cat.)
New York City
Year
.498
1.645
.000
1.353-2.001
Year squared
-.068
.934
.000
.910-.959
Year cubed
.003
1.003
.000
1.002-1.004
Male
.673
1.960
.000
1.681-2.286
Female
(ref. cat.)
Gender
Age category
Under 5
2.583
13.238
.000
10.116-17.323
5 to 9
3.790
44.246
.000
33.918-57.718
10 to 14
3.206
24.674
.000
18.889-32.231
15 to 24
.968
2.632
.000
1.995-3.473
25 to 44
.416
1.516
.003
1.153-1.994
45 and older
(ref. cat.)
Race/ethnicity
Non-Hispanic White
.146
1.158
.173
.938-1.429
Non-Hispanic Black
.008
1.008
.941
.815-1.246
Non-Hispanic Asian
-.464
.629
.000
.504-.785
Hispanic
(ref. cat.)
Abbreviation: ref. cat Reference category
(the reference category), individuals in the under 5 years
of age category are about 10 times more likely to incur
a scooter injury. This ratio becomes even more pronounced among the age group 5 to 9 (44.2:1) and the age
group 10 to 14 (28.2:1). The data further show that nonHispanic Whites and non-Hispanic Blacks have a greater
probability of being injured than Hispanics (the reference
Tuckel BMC Public Health
(2022) 22:1974
Page 5 of 8
category). Non-Hispanic Asians, on the other hand, have
a significantly lower probability of being injured than
Hispanics.
The results for NYC adhere to the same general pattern
as found for NYS. Again, the year cubed term is statistically significant. The results for NYC also closely correspond to the results for NYS with regards to the effects of
gender and age. Again, males and individuals in the age
groups 5 to 9 and 10 to 14, were far more likely to sustain
an injury than their counterparts. On the other hand, the
odds of being injured by non-Hispanic Whites and nonHispanic Blacks were not significantly different than the
odds for Hispanics, as was found in the data for NYS.
Local analysis: New York City
Table 3 displays the relationship between key sociodemographic variables and the rate of injuries from nonmotorized scooters at the neighborhood level in NYC.
Neighborhood is defined by the 42 United Health Fund
districts in the City. The data show that the injury rate
is positively associated with the percent of the population which is either non-Hispanic White or the percent
which is non-Hispanic Asian. Oppositely, the percent of
the population which is non-Hispanic Black or the percent which is Hispanic are negatively correlated with the
injury rate.
On the series of variables measuring economic status, a
consistent finding emerges: the injury rate tends to go up
Table 3 Correlations Between Demographic Characteristics
and Nonmotorized Scooter Injury Rate in New York City United
Health Fund Districts (N = 42)
Demographic Characteristic
b
Correlation
Coefficient
p Value
Percent non-Hispanic White
.45
.002
Percent non-Hispanic Blackb
-.48
.001
Percent non-Hispanic Asianb
.44
.003
Percent Hispanicb
-.35
.023
Median family incomebc
.59
.000
Per capita incomebc
.61
.000
Percent of population 25 years or age or older
who have a B.A. degree or moreb
.61
.000
Percent of population under 18 below the
poverty rateb
-.40
.009
Percent of population with no health insuranceb
-.21
.171
Percent of insured population with public
health insuranceb
-.54
.000
Number of major skate parksb
-.14
.368
b
c
Analysis is confined to those under the age of 18
Calculated by computing the median value of this variable for all zipcodes
within each UHF district
with increases in the income level or educational attainment of the neighborhood’s inhabitants. Median family
income, per capita income, and the percent of the population over 25 with a B.A. degree or more are all positively related to the injury rate. Additionally, the percent
of the population under 18 below the poverty rate, the
percent of the population without health insurance, and
the percent with health insurance which is public are all
negatively associated with the injury rate. The relationship between the number of skate parks and the injury
rate was negligible (r = -0.14).
Spatial distribution of scooter injuries in New York City’s
neighborhoods
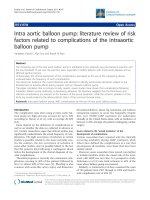
Figure 2 presents a choropleth map of the injury rates
by UHF districts in NYC. The rates were calculated by
first averaging the number of scooter injuries sustained
by patients under the age of 18 in 2018, 2019, and 2020
in each UHF district. This step was undertaken to obtain
a more stable measure of injuries than would have been
obtained by relying on the number of injuries for a single
year. Next these averages were divided by the number of
inhabitants under the age of 18 in each UHF district and
then multiplying this ratio by 10,000.
The map shows that the injury rates were not uniformly
distributed across the UHF districts. In particular, certain contiguous neighborhoods in the southern tip of
Manhattan had noticeably higher rates than other UHF
districts. These neighborhoods included the following:
Chelsea-Clinton, Gramercy Park-Murray Hill, Greenwich
Village-Soho, and Lower Manhattan. Importantly, these
same neighborhoods have also been identified in other
research as having relatively high rates of pedestrians
injured in collisions with cyclists [9]. A Global Moran’s I
yielded a Index value of 0.45 (p < 0.001) indicating a pattern of spatial clustering.
To investigate further the reasons why the rate of
scooter injuries was markedly higher in certain neighborhoods in southern Manhattan, an additional analysis was conducted examining the frequency distribution
of places of injury (e.g., home, place of recreation and
sport, street/highway, etc.) within each of the UHF districts. Since the “place of injury” variable was not available for the SPARCS data starting in 2016, the analysis
rested on the “place of injury” variable for the SPARCS
data years spanning 2011 to 2015. The analysis revealed
that a higher proportion of scooter injuries occurred in
the streets or highways in the neighborhoods in southern Manhattan than the average proportion of injuries
occurring in the streets and highways for all neighborhoods. However, the overall correlation between the
Tuckel BMC Public Health
(2022) 22:1974
Page 6 of 8
Fig. 2 Map of Injury Rates by UHF Districts in New York City
injury rate and the proportion of injuries taking place in
the streets or highways at the neighborhood level was not
significant.
Discussion
This study has tracked the rate of injuries resulting from
the use of nonmotorized scooters over the time period
from 2005 to 2020 in NYS and NYC. The study has produced evidence that the injury rate in both geographic
areas has declined substantially in recent years.
One factor which clearly contributed to the observed
decline in scooter injuries in NYS and NYC was the
change in the coding system from ICD-9-CM to ICD10-CM. In both NYS and NYC this study noted a precipitous decline in the rates of scooter injuries immediately
after 2015. This same time period coincided with the
transition from ICD-9-CM to ICD-10-CM. Other
research has also documented the immediate impact of
transitioning from ICD-9-CM to ICD-10-CM on injury
trends but the impact was more fleeting [10].
After 2016 there was no noticeable increase in the
injury rate in NYS but a marked increase in the rate in
NYC. One possible explanation for these disparate trends
was that the popularity of nonmotorized scooters in NYC
as a recreational vehicle – particularly in the pandemic
year of 2020 when school children were isolated at home
– was greater in the NYC than elsewhere in the State.
In addition to the change in the coding scheme, other
explanations could be posited to account for the decrease
in the injury rate. These possible explanations include the
following: (1) the greater use of protective gear such as
helmets and knee and elbow pads, (2) the more sedentary
lifestyle of younger children, and (3) a shift from using
nonmotorized scooters to motorized scooters among
older children and adults.
Though this study has documented a decrease in
scooter injuries prior to 2016, it should be kept in mind
Tuckel BMC Public Health
(2022) 22:1974
that the number of annual scooter injuries is still sizable
and appears to be growing in the most recent time interval. According to estimates based on data furnished by
the United States Consumer Product Safety Commission,
the number of nationwide injuries totaled 45,376 in 2019
[1]. Moreover, the data for both NYS and NYC showed
there has been a growth in the rate of injuries since 2018.
Particularly, in NYC in 2020 the rate of injuries soared.
It is likely that the advent of the coronavirus pandemic
in 2020, during which many children were sequestered at
home, spurred a greater interest in nonmotorized scooters. This, in turn, may account for the higher injury rate
in 2020.
Along with analyzing trends and demographics at the
NYS and NYC levels, this study examined the socioeconomic characteristics associated with scooter injury
rates at the neighborhood level in NYC. The data showed
that injury rates were positively correlated with a number
of socio-economic variables at the neighborhood level.
One possible reason for this finding is that riding a push
scooter might be a more popular recreational activity in
more affluent neighborhoods. Another possible reason
may be based on the price of purchasing a push scooter.
This study also produced a thematically-shaded map of
the injury rates at the neighborhood level in NYC. The
map revealed a clustering of neighborhoods with higher
than average injury rates. One geographic area, in particular, which comprised contiguous neighborhoods with
higher than average injury rates was the southern tip of
Manhattan. Notably, previous research has found that
these same neighborhoods were characterized by a disproportionately large number of pedestrians who were
injured in collisions with cyclists [9]. Moreover these
same neighborhoods were observed to have a comparatively greater incidence of scooter injuries occurring in
the streets as opposed to other places. These disparate
findings suggest that the street environment in these
neighborhoods poses certain hazards for scooter riders or pedestrians. Hazardous conditions might include
uneven street pavement, sidewalk cracks, or inadequate infrastructure for all types of street users. Further
research needs to be conducted to identify the specific
factors in this environment responsible for the elevated
injury rates of scooter riders and other street users.
Limitations
Two limitations of this study pertain to the database
upon which this study rests – patient-level records from
ED visits in NYS and NYC. First, the database excludes
individuals who may have pursued treatment in alternative venues such as a private physician’s office or an
Page 7 of 8
urgent care center. Graphs depicting the annual rates of
patients who were hospitalized as a result of their injuries in both NYS and NYC adhere to the same general
patterns found for annual rates for outpatients in these
two areas. This finding tends to bolster the representativeness of the patients included in this study. Second,
patients who sustained injuries riding a motorcycle
(which requires a license) may have reported their injuries as owing to riding a nonmotorized scooter. The bias
resulting from patients’ misrepresenting the cause of
their injuries is difficult to measure. However, the age distribution of the injured individuals reported in this study
which skews heavily towards patients 14 years of age and
younger suggests that this bias would not be a serious
one. Also it is reasonable to assume that this bias would
not change greatly over time and therefore would not
account for variation in temporal patterns.
Conclusion
This study has found that injuries from nonmotorized
scooters have spiraled downwards in NYS and NYC
in the past decade. Recently, though, there has been an
uptick in the number of scooter-related injuries in NYC.
Young children, especially those in the 5 to 9 and 10 to
14 year old age groups, are particularly vulnerable to
being injured.
This study has also mapped the incidence of injuries
within different neighborhoods in New York City. The
map revealed a concentration of injuries in certain neighborhoods. These same neighborhoods also have been
characterized as being hazardous to other street users
such as pedestrians. Identifying the specific factors operating in these neighborhoods which contributed to the
elevated number of injuries by scooters can increase our
understanding of the causes of these injuries and hopefully lead to a reduction in their number.
Abbreviations
CDC: Centers for Disease Control and Prevention; ED: Emergency Department;
ICD: International Classification of Diseases; NYC: New York city; NYS: New York
state; SPARCS: Statewide Planning and Research Cooperative System; UHF:
United Health Fund.
Acknowledgements
Not applicable.
Authors’ contribution
PT was the sole author of this manuscript and carried out all phases of the
research. The author(s) read and approved the final manuscript.
Funding
No funding was received for conducting this study.
Availability of data and materials
The datasets for this study are derived from three main sources: 1) Statewide
Planning and Research Cooperative System (SPARCS) data available at
https://www.health.ny.gov/statistics/sparcs, 2) CDC Wonder Bridged-Race
Tuckel BMC Public Health
(2022) 22:1974
Page 8 of 8
Population Estimates available at https://wonder.cdc.gov/bridged-race-pulat
ion.html, and 3) American Community Survey (ACS) 2015–2019 (5-Year Estimates) available at https://www.socialexplorer.com/explore-tables. To access
and use the SPARCS data, approval must be secured from this agency. The
other two sources are open accessed.
Declarations
Ethics approval and consent to participate
The primary source of data for this study was the New York State’s Statewide
Planning and Research Cooperative System (SPARCS) from which agency
necessary authorization was obtained. The SPARCS data are de-identified
(anonymized). The other two data sets employed in this study – the CDC Wonder Bridged-Race Population Estimates and the American Community Survey
(ACS) 2015–2019 (5-Year Estimates) – are publicly available and anonymized.
Since the study is based on publicly available and de-identified data, the study
is exempt from securing human subjects review from the author’s college
institutional review board.
Consent for publication
Not applicable.
Competing interests
The author declares that he has no competing interests.
Received: 4 November 2021 Accepted: 5 October 2022
References
1. US Consumer Product Safety Commission. National Electronic Injury Surveillance System Highlights, Data, and Query Builder. 2021. https://www.cpsc.
gov/cgibin/NEISSQuery/home.aspx.
2. Powell EC, Tanz RR. Incidence and description of scooter-related injuries
among children. Ambul Pediatr. 2004;4(6):495–9.
3. Lindsay H, Brussoni M. Injuries and helmet use related to non-motorized
wheeled activities among pediatric patients. Chronic Diseases and Injuries in Canada. 2014;34(2–3):74–81.
4. Abraham VM, Gaw CE, Chounthirath T, Smith GA. Toy-related injuries
among children treated in US emergency departments, 1990–2011. Clin
Pediatr. 2015;54(2):127–37. https://doi.org/10.1177/0009922814561353.
5. Nathanson BH, Ribeiro K, Henneman PL. An analysis of US emergency
department visits from falls from skiing, snowboarding, skateboarding, roller-skating, and using nonmotorized scooters. Clin Pediatr. 2015.
https://doi.org/10.1177/0009922815603676.
6. New York State Department of Health. Statewide Planning and Research
Cooperative System. 2021. https://www.health.ny.gov/statistics/sparcs.
7. Centers for Disease Control and Prevention. CDC Wonder Bridged-Race
Population Estimates. 2020. https://wonder.cdc.gov/bridged-race-pulat
ion.html.
8. U.S. Census Bureau. American Community Survey (ACS) 2015–2019
(5-Year Estimates). 2020. https://www.socialexplorer.com/explore-tables.
9. Tuckel P. Recent trends and demographics of pedestrians injured in collisions with cyclists. J Safety Res. 2021;2021(76):146–53.
10. Slavova, S., Costich, J.F., Luu, H., Fields. J, Gabella, B. A., Tarima, S., & Bunn,
T. L. Interrupted time series design to evaluate the effect of the ICD-9-CM
to ICD-10-CM coding transition on injury hospitalization trends. Injury
Epidemiology. 2018; 5(36). Retrieved from https://doi.org/10.1186/
s40621-018-0165-8.
Publisher’s Note
Springer Nature remains neutral with regard to jurisdictional claims in published maps and institutional affiliations.
Ready to submit your research ? Choose BMC and benefit from:
• fast, convenient online submission
• thorough peer review by experienced researchers in your field
• rapid publication on acceptance
• support for research data, including large and complex data types
• gold Open Access which fosters wider collaboration and increased citations
• maximum visibility for your research: over 100M website views per year
At BMC, research is always in progress.
Learn more biomedcentral.com/submissions