Application for simulating public health problems during foods around the Loei River in Thailand: The implementation of a geographic information system and structural equation
Bạn đang xem bản rút gọn của tài liệu. Xem và tải ngay bản đầy đủ của tài liệu tại đây (2.49 MB, 12 trang )
(2022) 22:1651
Boonnuk et al. BMC Public Health
/>
Open Access
RESEARCH
Application for simulating public health
problems during floods around the Loei River
in Thailand: the implementation of a geographic
information system and structural equation
model
Tanunchai Boonnuk*, Kirati Poomphakwaen and Natchareeya Kumyoung
Abstract
Background: Floods cause not only damage but also public health issues. Developing an application to simulate
public health problems during floods around the Loei River by implementing geographic information system (GIS)
and structural equation model (SEM) techniques could help improve preparedness and aid plans in response to such
problems in general and at the subdistrict level. As a result, the effects of public health problems would be physically
and mentally less severe.
Methods: This research and development study examines cross-sectional survey data. Data on demographics, flood
severity, preparedness, help, and public health problems during floods were collected using a five-part questionnaire.
Calculated from the population proportion living within 300 m of the Loei River, the sample size was 560 people. The
participants in each subdistrict were recruited proportionally in line with the course of the Loei River. Compared to
the empirical data, the data analysis examined the causal model of public health problems during floods, flood severity, preparedness, and help. The standardized factor loadings obtained from the SEM analysis were substituted as the
loadings in the equations for simulating public health problems during floods.
Results: The results revealed that the causal model of public health problems during floods, flood severity, preparation, and help agreed with the empirical data. Flood severity, preparedness, and aid (χ2 = 479.757, df = 160, p value
<.05, CFI = 0.985, RMSEA = 0.060, χ2/df = 2.998) could explain 7.7% of public health problems. The computed values
were applied in a GIS environment to simulate public health problem situations at the province, district, and subdistrict levels.
Conclusions: Flood severity and public health problems during floods were positively correlated; in contrast, preparedness and help showed an inverse relationship with public health problems. A total of 7.7% of the variance in public
health problems during floods could be predicted. The analysed data were assigned in the GIS environment in the
developed application to simulate public health problem situations during floods.
Keywords: Flood disaster, Structural equation model, Geographic information system
*Correspondence:
Public Health Program, Department of Applied Science, Faculty of Science
and Technology, Loei Rajabhat University, Loei 42000, Thailand
© The Author(s) 2022. Open Access This article is licensed under a Creative Commons Attribution 4.0 International License, which
permits use, sharing, adaptation, distribution and reproduction in any medium or format, as long as you give appropriate credit to the
original author(s) and the source, provide a link to the Creative Commons licence, and indicate if changes were made. The images or
other third party material in this article are included in the article’s Creative Commons licence, unless indicated otherwise in a credit line
to the material. If material is not included in the article’s Creative Commons licence and your intended use is not permitted by statutory
regulation or exceeds the permitted use, you will need to obtain permission directly from the copyright holder. To view a copy of this
licence, visit http://creativecommons.org/licenses/by/4.0/. The Creative Commons Public Domain Dedication waiver (http://creativeco
mmons.org/publicdomain/zero/1.0/) applies to the data made available in this article, unless otherwise stated in a credit line to the data.
Boonnuk et al. BMC Public Health
(2022) 22:1651
Background
Flooding is a major problem worldwide. A few examples
include floods in the Mississippi basin [1] and the Amazon
River basin [2] in the Americas, floods in the Danube River
basin in Europe [3], floods in the Nile basin in Africa [4],
floods in the Yangtze River basin [5] and the Mekong River
[6, 7] in Asia. Thailand also frequently deals with flooding. There have been several major floods in the country,
for instance, flash floods and landslides in Wang Chin district, Phrae Province, and in Lom Sak district, Phetchabun
Province, in 2001 [8]; in Laplae district, Tha Pla district,
and Mueang district in Uttaradit Province in 2006 [9]; and
massive floods in the central plain in 2011 [10]. The occurrence of flooding in 2011 became more frequent and more
severe over time [11]. Floods can have severe impacts on
large areas, such as agricultural areas, industrial estates,
commercial districts, and residential areas, in several
regions, including Bangkok. According to reports of provinces affected by floods in Thailand, 4,405,315 people from
1,590,346 households were affected by the end of 2011 [12].
In Loei Province, due to overflow from the Loei River, four
floods in 2017 damaged the vicinity and caused fatalities
[13]. Flooding in Loei Province exerts an enormous impact
on the lives of the people who reside in the riverside area.
Because the Loei River originates in the Phu Luang mountain area, any additional, unexpected water flow can result
in rapid flooding. Furthermore, water management in the
dams upstream of the Loei River and the tributaries that
flow into the Loei River is affected by considerable water
storage throughout the rainy season to prepare for sustaining agriculture, which is the main occupation of the population, throughout the summer drought. This additional
water retained in the dam could cause erosion damage,
thereby necessitating accelerated drainage to prevent erosion. This drainage, combined with the accelerated release
of water from 14 branch reservoirs, results in the repeated
flooding of houses in the river area. Such floods last approximately 2 days because the water ultimately flows into the
Mekong River, where the water level is already high due to
the rainy season and considerable water flowing in from
China. As a result, water drains from the Loei area quite
slowly, and the flooding of houses during this period results
in negative consequences including electrical accidents due
to downed wires, increased encounters with dangerous animals such as snakes and scorpions, disease outbreaks, food
shortages and mental health problems. Demographically,
most people in the river basin area live in rural societies.
Geographically, the area is a plain surrounded by mountains. In Thailand, the administrative characteristics of
this area are central (district, province, region, and country
levels) and local (subdistrict level). There are two types of
governance at the subdistrict level: municipalities (in urban
areas) and subdistrict administrative organizations (in rural
Page 2 of 12
areas). The subdistrict administrative organization responsible for almost all of the Loei River Valley subdistrict also
takes partial responsibility for managing flood problems.
Both the government and public sector also take responsibility for flood issues through a collaboration of many
departments, including government agencies, public health
agencies, and disaster mitigation agencies. The public sector provides volunteer rescue services. These two components form an ad hoc working group for the management
of flood-related disasters.
The negative aftermath of disastrous floods can affect
the economy, society, and the environment [14]. Some
consequences are, for instance, destruction or damage
to houses and buildings, loss of lives and animals, and
epidemics [15]. Floods can also result in food and water
shortages [16]. These flood consequences can lead to
public health problems, including epidemics, such as
cholera, leptospirosis, hepatitis, and diseases caused by
animals and insects, and mental health problems, such
as anxiety disorder and depression, especially among the
elderly [17]. Moreover, floods also obstruct the transportation needed to receive health services, particularly for
patients who require continuous care.
In recent decades, there has been a trend to use more
advanced data analysis techniques in research studies to
answer research questions, including structural equation
modelling analysis. The structural equation model (SEM)
is a statistical method for investigating the correlations
between variables. It can measure a relationship between
observed and latent variables or between two or more
latent variables. Compared with regression analysis, SEM
analysis is more advantageous for researchers in terms
of flexibility. It allows relationships between several predictor variables (creating a latent variable that is unable
to be measured directly), errors in the measurement of
observed variables, and statistical tests between hypotheses and empirical data [18]. Several studies have applied
the SEM technique to analyse flood issues [19–21].
A geographic information system (GIS) is a computer
information system used to import, manage, analyse, and
export geographic data. It can gather, store, fetch, manage, analyse data and exhibit spatial correlations [22],
relying on geographical features to link datasets and
reveal correlations. The results are usually presented in
a map displaying spatial data with distributions based
on the area of interest. Many research studies have also
implemented GIS to analyse flood situations [23–25].
Some have used GIS to simulate flood situations [26, 27]
and applied a regression equation to colour the map [28].
Since floods can cause considerable damage and public
health problems, a situation simulator should be developed
and utilized for preparation and aid plans. The capabilities of
GIS can be used to help clearly simulate situations. Previous
Boonnuk et al. BMC Public Health
(2022) 22:1651
studies have adopted regression equations and GIS to simulate situations; however, regression equations have various analytical limitations. Therefore, the researchers in this
study would like to introduce a solution by implementing
both SEM and GIS techniques to improve the simulations.
The objectives of this study are to investigate the causal
model among public health problems during floods,
flood severity, preparation, and help and to develop an
application with SEM and GIS to simulate public health
problems around the Loei River during floods. Further
explanations are provided in the next section.
Methods
Conceptual framework
This research is a cross-sectional study, the research results
of which will be used in the development of further applications. This cross-sectional study involves research and
development with two objectives: 1) to investigate the
causal model among flood severity, preparedness, help, and
public health problems during floods and 2) to develop an
application to simulate public health problem situations
around the Loei River during floods using GIS and SEM.
The disaster management guidelines for flood mitigation,
involving prevention, preparation, response, and help,
were focused on when creating the SEM [29]. Apart from
reducing the severity of public health problems, prevention and preparation plans can also improve response and
assistance. For that reason, the conceptual framework and
application development process is shown in Fig. 1 below.
Fig. 1 Conceptual framework and application development process
Page 3 of 12
Data collection
Population and sample size
The population in this study included the people residing
within 300 m of the Loei River Basin. Participants were
recruited from 35 subdistricts located near the Loei River.
The number of participants in each subdistrict was proportional based on the distance from the river. The sample
was obtained through simple random sampling of households near the Loei River within 300 m of each subdistrict.
Proportional sampling from each subdistrict was calculated by selecting a representative from each household
to serve as an informant who could remember as many
details as possible about flood incidents. The sample size
was approximately 20 times greater than the number of
observed variables [30]. There were 28 observed variables;
hence, the sample size was 560 people (28 observed variables multiplied by 20 (28*20 = 560 people)). The data of
the respondents from each subdistrict were collected corresponding to the course of the Loei River.
Research instrument
The instrument used in this study was a questionnaire consisting of five parts as follows: 1) a checklist of demographic
questions about gender, age, marital status, income, and the
number of household members; 2) questions about direct
problems from floods (ten items); 3) questions about preparedness (four items); 4) questions about aid (four items);
and 5) questions about public health problems during
floods (ten items). Parts two to five were a 0-to-10 rating
Boonnuk et al. BMC Public Health
(2022) 22:1651
scale with 11 rating choices for each item. The validity of
the questionnaire was evaluated by a disaster management
expert, a GIS expert, a local disaster management official,
a public health officer specializing in disaster management,
and an independent disaster management scholar. The
IOC value was higher than 0.5; however, the questionnaire
was revised following the experts’ suggestions. The revised
questionnaire was piloted with the people living in a river
basin in Nong Bua Lamphu Province, and the improved
IOC value was higher than 0.7.
Ethics and data collection
1)The research proposal and instrument were submitted to the Research Ethics Committee of Loei Rajabhat University for the certificate of approval.
2)For the research instrument tryout, 30 copies of
the questionnaire were distributed to the respondents in a river basin in Nong Bua Lamphu Province.
After the quality assessment, the questionnaire was
revised. Questionnaires were created based on the
researcher’s literature review (reliability values were
checked to ensure that they met the requirements).
3)For data collection, the researchers and research
assistants distributed 580 copies of the questionnaire
to the respondents in person. The respondents were
informed about the research objectives and the protection of their rights.
4)The returned questionnaire copies were checked for
any missing data before the data were imported for
later analysis.
5)The data collection occurred from July 1, 2020, until
June 30, 2021.
Data analysis
1) Descriptive statistics were used to analyse the data of
respondents’ demographic information. Frequency
and percentage metrics are used for the qualitative
data. For the quantitative data, if normally distributed, means and standard deviation are presented,
whereas the median, maximum, and minimum are
shown in case of nonnormal distributions.
2)Mplus version 7.4 was used for structural equation
modelling to examine the causal model among flood
S=
Page 4 of 12
severity, preparation, help, and public health problems during floods compared with the empirical data.
The development of an application simulating public
health problem situations during floods
To create a system to simulate public health problems during floods, the standardized factor loadings from structural equation modelling acted as loadings for computing
the scores of public health problems during floods. The
following equations were used for the score calculation.
𝐩𝐮𝐛𝐥𝐢𝐜 𝐡𝐞𝐚𝐥𝐭𝐡 𝐩𝐫𝐨𝐛𝐥𝐞𝐦 𝐬𝐜𝐨𝐫𝐞 = 𝐝𝐢𝐫𝐞𝐜𝐭 𝐬𝐜𝐨𝐫𝐞 + 𝐢𝐧𝐝𝐢𝐫𝐞𝐜𝐭 𝐬𝐜𝐨𝐫𝐞
(1)
In terms of score calculation, when each variable’s standardized factor loading, ranging from zero to ten, was available and the scores of public health problems were between
zero and ten, normalization was applied as follows:
S=
(C1 F + C2 H + C3 P) + (C2 C4 HP)
(C1 + C2 + C3 + 10(C2 C4 ))
(2)
where S stands for the score of public health problems
F
stands for flood severity
H
stands for help (flood relief )
P
stands for preparation (preparedness)
C1
stands for the standardized factor loading from
severity to public health problems
C2
stands for the standardized factor loading from
help to public health problems
C3
stands for the standardized factor loading from
preparedness to public health problems
C4
stands for the standardized factor loading from
preparedness to help
Help and preparation were the factors opposing public health problems. While the maximum and minimum
scores of flood severity, help, and preparation ranged
from zero to ten, the C2 and C3 standardized factor
loadings were negative due to being opposing factors.
Hence, the equation was adjusted to Eq. (3) below.
S=
C1 F + ||C2 ||(10 − H) + ||C3 ||(10 − P) + ||C2 C4 ||(10 − H)(10 − P)
C1 + ||C2 || + ||C3 || + 10||C2 C4 ||
(3)
For the worst case, the values of the most severe flood
(F = 10), no help (H = 0), and no preparation (P = 0) were
substituted in Eq. (3), and the severity score was highest
(S = 10), as shown in Eq. (4).
10C1 + 10|C2 | + 10|C3 | + 100|C2 C4 |
10(C1 + |C2 | + |C3 | + 10|C2 C4 |)
=
= 10
C1 + |C2 | + |C3 | + 10|C2 C4 |
C1 + |C2 | + |C3 | + 10|C2 C4 |
(4)
Boonnuk et al. BMC Public Health
(2022) 22:1651
For the best case, the values of the least severe flood
(F = 0), great help (H = 10), and great preparation (P = 10)
were substituted in Eq. (3), and the severity score was the
lowest (S = 0), as shown in Eq. (5):
S=
0C1 + 0||C2 || + 0||C3 || + 0||C2 C4 ||
0
=
=0
C1 + ||C2 || + ||C3 || + 10||C2 C4 ||
C1 + ||C2 || + ||C3 || + 10||C2 C4 ||
(5)
The application was developed with Visual Studio 2017.
Additionally, MapWinGIS version 5.3.0 was also used for
map generation. Screenshots of the application can be
seen in Fig. 2 below.
This simulation will assist both with preventive
planning and when a public health problem arises.
When flooding occurs, issues can arise at both the
district and provincial levels, especially when part of
the flooded area is at the subdistrict level, because
preparation and assistance involve both manpower
and budget. If such efforts are overprepared, the area
may experience budget and manpower losses that
then affect other elements such as education and
road development. In contrast, if too little effort is
made in these areas, public health problems caused
by flooding may not be resolved in a timely manner or
may escalate to a higher level, such as an outbreak of
water-borne diseases or loss of life and property. The
simulation helps predict the level of the problem and
determine the most appropriate level of preparation
and assistance to most effectively reduce the occurrence of public health problems.
Results
The results were divided into two parts based upon the
research objectives.
Page 5 of 12
Structural equation model analysis
The analysis of demographic information
The demographic information analysis revealed that
most of the respondents were female (62.9%), aged
35–59 (46.1%) ( x = 53.23, SD = 16.51), married (85.2%),
elementary school graduates (71.1%), farmers (53.2%),
earned between 1001 and 10,000 baht per month (62.3%)
(Median = 3000, Max = 60,000, Min = 0) and had 4–6
household members (64.3%) ( x = 4.79, SD = 1.66). The
details are displayed in Table 1.
Analysis of the causal model including flood severity,
preparation, help, and public health problems during floods
with empirical data
The SEM was adjusted as per the fit index to examine the
causal model. After the adjustment, the model became fit
with the empirical data considering the following statistics
used for the model’s validity test: χ2 = 479.757, df = 160, p
value <.05, CFI = 0.985, RMSEA = 0.060, and χ2/df = 2.998,
which was fit with the empirical data being lower than three
[31]. A CFI value greater than 0.9 indicates a good level of fit
[32]. An RMSEA value less than 0.08 [33] is also within the
acceptable standard; hence, the model matched the empirical
data. These analysis results led to acceptance of the hypothesis that the causal model among flood severity, preparation,
help, and public health problems agreed with the empirical
data. Additionally, the severity, preparation, and help were
able to simulate situations of public health problems during
floods by 7.7%, as shown in Fig. 3 and Table 2.
Testing the system for simulating public health problem
situations during floods
The standardized factor loadings from the structural
equation modelling analysis were substituted into Eq. (3)
as shown in the equations below.
S=
0.287F + |−0.029|(10 − H ) + |−0.008|(10 − P) + |(−0.029)(0.452)|(10 − H )(10 − P)
0.287 + |−0.029| + |−0.008| + 10|(−0.029)(0.452)|
(6)
S=
0.287F + 0.029(10 − H ) + 0.008(10 − P) + 0.013108(10 − H)(10 − P)
0.287 + 0.029 + 0.008 + (10)(0.013108)
(7)
S=
0.287F + 0.029(10) − 0.029H + 0.008(10) − 0.008P + 0.013108(100 − 10H − 10P + HP)
0.287 + 0.029 + 0.008 + 0.13108
(8)
S=
0.287F + 0.29 − 0.029H + 0.08 − 0.008P + 1.3108 − 0.13108H − 0.13108P + 0.013108HP
0.45508
(9)
Boonnuk et al. BMC Public Health
(2022) 22:1651
Fig. 2 Screenshots from the application simulating public health problems during floods
Page 6 of 12
Boonnuk et al. BMC Public Health
(2022) 22:1651
Page 7 of 12
Table 1 Respondents’ demographic information
Demographic information
Number of
respondents
(n = 560)
Percentage
Gender
Male
208
37.1
Female
352
62.9
Under 35 years old
83
14.8
35–59 years old
258
46.1
60 years old and over
219
39.1
Age
x = 53.23, SD = 16.51
Marital status
Married
477
85.2
Single
70
12.5
Widowed/divorced/separated
13
2.3
Education
None
20
3.5
Elementary
398
71.1
High school
113
20.2
Diploma/Bachelor’s degree
28
5.0
Master’s degree or higher
1
0.2
Occupation
Farmer
298
53.2
Unemployed
100
17.9
Freelancer
68
12.1
Merchant/vender
68
12.1
Civil servant
9
1.6
Others
17
3.1
No income
47
8.4
Less than 1000 Baht
115
20.5
1001–10,000 Baht
349
62.3
More than 10,000 Baht
49
8.8
1–3 member(s)
118
21.1
4–6 members
360
64.3
7 members or over
82
14.6
Average monthly income
Median = 3000, Max = 60,000, Min = 0
Number of household member(s)
x = 4.79, SD = 1.66
S=
0.287F − 0.18908H − 0.13908P + 0.013108HP + 1.6808
0.45508
(10)
With Eq. (10), the rating scale points 0–10 were substituted in every case possible. The total number of cases
(11x11x11) was 1331. The testing of the computed values
showed a nonnormal distribution. For that reason, the
data of values were separated into 11 ranks by percentiles. The acquired values were translated into 11 levels
of public health problems during floods (from 0 to 10)
to determine the colours used in the risk level map, as
described in Table 3.
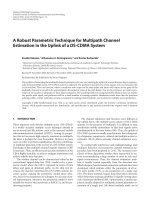
Examples of the public health problem situations
simulated by the program developed with Visual Studio
2017 and MapWinGIS version 5.3.0 are shown in Fig. 4
below.
Discussion
The results indicated that only flood severity had a statistically significant effect on public health problems
(p < .05), both directly and indirectly, as also reported
in several studies [34, 35]. The more disastrous a flood
situation becomes, the more serious the public health
problems will be. On the other hand, if flood situations
are less disastrous, the public health problems are also
less serious. During severe floods, many issues can
occur, such as food and water scarcity, consumption
of contaminated food and water, unsanitary excretion,
flooded houses, power outage, poisonous animals in
floodwater, insects carrying diseases from floodwater,
and communication outages. These issues can lead to
public health problems, including malnutrition from
food and water scarcity, poisoning and water-borne
diseases from consuming contaminated food and water,
water-borne diseases due to water contamination from
unsanitary excretion, contagious diseases transmitted from poisonous animals and insects in floodwater, drowning because of the high level of floodwater
level, injuries from uncontrolled electrical currents,
accidents in the dark due to power outages, and mental health problems from a lack of communication with
the outside world. Mental health problems encountered
during floods include stress, panic, and fear; moreover, mental health problems such as depression persist
even after floods. As indicated by the results, mental
health problems differed from other problems, as mental health problems were not present during floods
in the Loei River Basin. Since the mass of floodwater
quickly flowed into the Mekong River, the duration of
each flood in the basin usually lasted no more than 2
days; subsequently, mental health was not yet affected
by floods.
Help had a direct inverse effect on public health
problems, which was supported by previous studies
[36, 37]. When there was a great deal of help, the number of public health problems was lower. In contrast, if
help was limited, public health problems became more
serious. Help could clearly relieve public health problems. For instance, food and water aid can decrease the
risks of malnutrition, food and water poisoning, and
infections of diseases from food and water because the
donated food and water were prepared and brought
in from outside the affected area and hence were not
Boonnuk et al. BMC Public Health
(2022) 22:1651
Page 8 of 12
Fig. 3 Causal model including flood severity, preparation, help, and public health problems during floods
Table 2 The analysis results of the effect values between independent and dependent variables
Independent variables
Dependent variables
Help
Public health problems
TE
IE
DE
TE
IE
DE
Flood severity
–
–
–
0.287
–
0.287
Preparation
0.452
–
0.452
Help
–
–
–
−0.021
−0.013
−0.008
Statistical values
χ2= 479.757
df = 160
p value < .05
χ2/df = 2.998
CFI = .985
RMSEA = 0.060
−0.029
Structural equation
Help
Public Health problems
Square Multiple Correlation
20.5%
7.7%
contaminated with floodwater. Rescuing and moving people, patients, and their belongings out of the
affected area ensured that they would be safe from the
source of public health problems. Rescued and transferred patients could also receive the care they needed
immediately. Saving victims’ possessions reduces the
loss of property, which can also lower the chances of
mental health issues. In addition, using public relations to keep those affected informed can help them be
aware of possible harms from floods, resulting in fewer
public health issues.
Preparation had both direct and indirect inverse
impacts on public health problems, as concluded in other
–
−0.029
studies [38, 39]. Public health problems were less common when there was more preparation. On the other
hand, public health problems were more severe when
preparation was insufficient. Preparedness could directly
reduce public health problems. For instance, if food and
water were stored in advance, there would not be a shortage of food and water during a flood. The indirect impact
of preparation involved help. If the aid plan were well
prepared, rescue would be prompt in case of emergency.
According to the results, the direct impact had a minimal
value because preparation primarily led to the indirect
impact in the form of help. During a flood disaster, good
preparedness plays a crucial role in providing sufficient
Boonnuk et al. BMC Public Health
(2022) 22:1651
Page 9 of 12
Table 3 Risk levels and associated map colours
Risk levels
Map colours
10
Dark Red
9
Maroon
8
Red
7
Orange Red
6
Orange
5
Gold
4
Yellow
3
Greenish Yellow
2
Yellowish Green
1
Forest Green
0
Green
and effective assistance that can reduce public health
problems.
Although help and preparation directly and indirectly affected public health problems, they did not
have a statistically significant effect. The standardized
factor loading is very low, which may indicate that factors other than flood severity, help and preparation
could affect the occurrence of public health problems,
which is an interesting point for future study. However, the observed variable, which is a component of
all latent variables including the public health problem
latent variable, flood severity latent variable, preparation latent variable, and help latent variable, was statistically significant (p < .05). Therefore, the addition of
latent variables from the existing study may enhance
the predictive ability and statistical significance of
future studies.
In terms of using a developed application to simulate situations of public health problems during floods,
there has been a multitude of studies simulating flood
situations [26–28, 39]. In this study, GIS and SEM techniques were used to combine values for public health
problem simulation. The advantage of SEM over the
regression equation is that SEM considers latent variables with observed variables as a factor, whereas
regression equations examine only observed variables
measured by collecting data. Another advantage of
SEM with path analysis is that it calculates not only
direct but also indirect effects, resulting in a more
elaborate consideration of effects. In contrast, the
regression equation examines only the direct effect.
Furthermore, the incorporation of GIS with SEM
allows the mapping arrangement to be visualized, supporting more convenient and efficient management
of public health problems at both the provincial and
subdistrict levels. Nonetheless, some issues were not
considered in this study, and the predictive ability was
only 7.7%, probably due to the high complexity of public health issues. Nonetheless, this research provides a
good starting point for further study and development
to clarify, manage, and solve public health problems. A
more diverse study of related variables could be developed in future research, which would likely increase
the model’s predictive ability.
Management to address the three latent variables
affecting public health problems—flood severity, preparation and help—could be practically implemented.
Water management through river dams and the tributary reservoirs surrounding the province that connect
with the Loei River should be considered to reduce
flood severity. Preparation in terms of both budget and
manpower, including various equipment that supports
the provision of emergency assistance, should also
be considered. In providing help for flood incidents,
budget and manpower must be managed, directed, and
facilitated effectively across all sectors, including government agencies, the private sector, and the people,
who must work together vigorously with dedication
and full efficiency.
The simulation model of public health problems during a flood can be implemented at both the technical and
policy levels in different areas of Thailand. Questionnaires can be collected in a given area, and simulations
of public health problems in a flood situation within that
area can then be projected based on questionnaire data.
Following simulation, area situation data can be used for
preparation planning, assistance, and fixing flood-related
problems that arise in that area.
Limitations
Since the simulation system for public health problem
situations was developed using cross-sectional data,
the accuracy of the predictions could not be evaluated
due to the lack of data for comparison. Therefore, in
future studies, longitudinal data should be consecutively collected for at least 2 years for comparison to
examine the prediction accuracy of the simulation
system.
Conclusions
This study found that flood severity and public health
problems were positively correlated, but preparation
and help had inverse relationships with public health
problems. The variance in the public health problems
Boonnuk et al. BMC Public Health
(2022) 22:1651
Fig. 4 Simulation examples of public health problems during floods
Page 10 of 12
Boonnuk et al. BMC Public Health
(2022) 22:1651
could be predicted by 7.7%. When the standardized
factor loadings from the analysis were applied in the
system to simulate public health problem situations
during floods, GIS was also adopted to simulate situations at the province, district, and subdistrict levels
via the simulation application. Nevertheless, since the
data were cross-sectional, the prediction accuracy
could not be assessed owing to the lack of comparable data. For further study, longitudinal data should be
gathered to evaluate the effectiveness of the simulation system.
Abbreviation
IOC: Index of item-objective congruence.
Supplementary Information
The online version contains supplementary material available at https://doi.
org/10.1186/s12889-022-14018-7.
Additional file 1.
Additional file 2.
Additional file 3.
Additional file 4.
Additional file 5.
Acknowledgements
We sincerely thank Assoc. Prof. Dr. Koolarb Rudtanasudjatum and Assoc. Prof.
Dr. Anamai Thetkathuek of the Faculty of Public Health, Burapha University,
Thailand, for their recommendations. Additionally, we sincerely thank Dr.
Phuwanai Bunnak for reviewing the English manuscript. All authors approved
the final manuscript.
Authors’ contributions
Study Design: Tanunchai Boonnuk, Kirati Poomphakwaen, Natchareeya Kumyoung. Data Collection and Analysis: Tanunchai Boonnuk. Manuscript Writing:
Tanunchai Boonnuk. The authors read and approved the final manuscript.
Funding
This study was supported by Loei Rajabhat University, Thailand.
Availability of data and materials
The datasets used and/or analysis during the current study are available from
the corresponding author upon reasonable request.
Declarations
Ethics approval and consent to participate
This study was approved by the Loei Rajabhat University Ethics Committee for Human Research based on the Declaration of Helsinki and the ICH
Good Clinical Practice Guidelines (Approval no. HE 009/2562, certificated on
Jan 28, 2019). Informed consent was obtained from all study participants.
All methods were carried out in accordance with relevant guidelines and
regulations.
Consent for publication
Not applicable.
Competing interests
The authors declare that they have no conflicts of interest.
Page 11 of 12
Received: 17 March 2022 Accepted: 17 August 2022
References
1. Kondolf GM, Lopez-Llompart P. National-local land-use conflicts in floodways of the Mississippi River system. AIMS Environ Sci. 2018;5:47–63.
2. Espinoza JC, Marengo JA, Schongart J, Jimenez JC. The new historical
flood of 2021 in the Amazon River compared to major floods of the 21st
century: atmospheric features in the context of the intensification of
floods. Weather Clim Extrem. 2022;35:100406.
3. Morlot M, Brilly M, Šraj M. Characterisation of the floods in the Danube
River basin through flood frequency and seasonality analysis. Acta Hydrotech. 2019;32:73–89.
4. Tegegne G, Melesse AM, Asfaw DH, Worqlul AW. Flood frequency analyses
over different basin scales in the Blue Nile River basin. Ethiopia Hydrol.
2020;7:44.
5. Liu C, Guo L, Ye L, Zhang S, Zhao Y, Song T. A review of advances in
China’s flash flood early-warning system. Nat Hazards. 2018;92:619–34.
6. Ariyasirichot W. The policy design on preparation and coping with flash
flood Mekong River basin entrance inequality deduction form disaster: a
case study of Mueang Nong Khai district Nong Khai province, Thailand.
Turk J Comput Math Educ. 2021;12:4106–12.
7. Wang S, Zhang L, She D, Wang G, Zhang Q. Future projections of flooding
characteristics in the Lancang-Mekong River basin under climate change.
J Hydrol. 2021;602:126778.
8. Ruangjan S. A development of readiness model for self care of the
disaster communities at risk of floods and landslides in Uttaradit Province
(doctoral dissertation). Uttaradit: Uttaradit Rajabhat University; 2012.
9. Oba N, Othganont P, Sangkaewsri R, Jaisopha S, Imtem K, Kumsri T. Disaster participatory management for decreasing the impact of flooding and
landslide in a community. J Nurs Health Sci. 2011;5:39–53.
10. Sarapin P. Flood lesson 2011. NSRU Sci Technol. 2012;4:69–88.
11. Yubamrung C. National disaster prevention and mitigation plan B.E.
2553–2557 (2010–2014). Thailand: Department of Disaster Prevention
and Mitigation, Ministry of Interior; 2008.
12. Nontarit W. Department of disaster prevention and mitigation ministry of interior, Thailand reports 680 flood victims, post today news.
2011. https://www.posttoday.com/social/general/126017. Accessed 2
Dec 2021.
13. Lapchit P. Third round of flooding in Loei province has two deaths, Bangkok business news. 2017. http://www.bangkokbiznews.com/news/detail/
776443. Accessed 2 Dec 2021.
14. Rehman J, Sohaib O, Asif M, Pradhan B. Applying systems thinking to
flood disaster management for a sustainable development. Int J Disaster
Risk Reduct. 2019;36:101101.
15. Glago FJ. Flood disaster hazards; causes, impacts and management: a
state-of-the-art review. In: Farsangi E, editor. Natural hazards - impacts,
adjustments and resilience. London: IntechOpen; 2021. p. 21–38.
16. Ohl CA, Tapsell S. Flooding and human health. BMJ. 2000;321:1167–8.
17. Few R, Ahern M, Matthies F, Kovats S. Floods, health and climate
change: a strategic review. Working paper 63. Norwich: Tyndall Centre
for Climate Change Research; 2004.
18. Fredriksson A. Soft and hard information in bank-firm relationships:
the effect of relationhip intensity and reporting conservatism on loan
pricing and relationship value. Turku: Turku School of Economics; 2010.
19. Ha Anh H, Da Hanh TM, Thi Tuong Vi N, Shunbo Y. Examining the interaction of flood vulnerability determinants in Cambodia and Vietnam
using partial least squares structural equation modeling. Water Policy.
2018;20:1256–78.
20. Fatemi MN, Okyere SA, Diko SK, Abunyewah M, Kita M, Rahman T.
Flooding in mega-cities: using structural equation modeling to assess
flood impact in Dhaka. Int J Disaster Resil Built Environ. 2020;12:500–14.
21. Huang J, Cao W, Wang H, Wang Z. Affect path to flood protective coping behaviors using SEM based on a survey in Shenzhen, China. Int J
Environ Res Public Health. 2020;17:940.
22. Ondieki CM, Murimi SK. Applications of geographic information systems. Environ Monit. 1997;11:314–40.
Boonnuk et al. BMC Public Health
(2022) 22:1651
Page 12 of 12
23. Altunkaynak A, Bizimana H. Prediction of flood hazard map based on
hybrid fuzzy geographic information system and its application for
Ayamama watershed. Int J Fuzzy Comput Model. 2020;3:16–32.
24. Sarmah T, Das S, Narendr A, Aithal BH. Assessing human vulnerability
to urban flood hazard using the analytic hierarchy process and geographic information system. Int J Disaster Risk Reduct. 2020;50:101659.
25. Ogato GS, Bantider A, Abebe K, Geneletti D. Geographic information
system (GIS)-based multicriteria analysis of flooding hazard and risk in
ambo town and its watershed, west shoa zone, Oromia regional state.
Ethiopia J Hydrol Reg Stud. 2020;27:100659.
26. Neubert M, Naumann T, Hennersdorf J, Nikolowski J. The geographic
information system-based flood damage simulation model HOWAD. J
Flood Risk Manag. 2016;9:36–49.
27. Jo M, Park H, Kim H, Choi Y. Implementation of flooding simulation in coastal
area based on 3D satellite images and web GIS. In: Proceedings of the KSRS
conference. Seoul: The Korean Society of Remote Sensing; 2006. p. 166–9.
28. Lee S, Lee S, Lee MJ, Jung HS. Spatial assessment of urban flood susceptibility using data mining and geographic information system (GIS)
tools. Sustainability. 2018;10:648.
29. Kim YK, Sohn HG. Disaster theory. In: Kim YK, Sohn HG, editors. Disaster
risk management in the Republic of Korea. Singapore: Springer; 2018.
p. 23–76.
30. Lindeman R. Introduction to bivariate and multivariate analysis. Michigan: Scott Foresman & Co; 1980.
31. Kline R. Principles and practice of structural equation modeling. New
York: The Guilford Press; 2016.
32. Bentler PM. Comparative fit indexes in structural models. Psychol Bull.
1990;107:238–46.
33. MacCallum RC, Browne MW, Sugawara HM. Power analysis and determination of sample size for covariance structure modeling. Psychol
Methods. 1996;1:130–49.
34. Da Silva LBL, Humberto JS, Alencar MH, Ferreira RJP, De Almeida AT.
GIS-based multidimensional decision model for enhancing flood risk
prioritization in urban areas. Int J Disaster Risk Reduct. 2020;48:101582.
35. Viriyathorn S, Wanwong Y, Pongutta S, Thammatacharee N, Kantamaturapoj K, Suphanchaimat R. The 2011 flood crisis in Bangkok and the
central region of Thailand: challenges to a resilient health system.
Health Serv Res. 2019;13:11–22.
36. Stephens KK, Li J, Robertson BW, Smith WR. Citizens communicating
health information: urging others in their community to seek help
during a flood. In: Boersma K, Tomaszewski B, editors. Proceedings of
the 15th international ISCRAM conference. Rochester: ISCRAM; 2018. p.
893–900.
37. Collins TW, Jimenez AM, Grineski SE. Hispanic health disparities after a
flood disaster: results of a population-based survey of individuals experiencing home site damage in El Paso (Texas, USA). J Immigr Minor
Health. 2013;15:415–26.
38. Carroll B, Balogh R, Morbey H, Araoz G. Health and social impacts of a
flood disaster: responding to needs and implications for practice. Disasters. 2010;34:1045–63.
39. Khanal N, Shrestha M, Ghimire M. Preparing for flood disaster: mapping
and assessing hazard in the Ratu watershed. Nepal: International Centre
for Integrated Mountain Development (ICIMOD); 2007.
Publisher’s Note
Springer Nature remains neutral with regard to jurisdictional claims in published maps and institutional affiliations.
Ready to submit your research ? Choose BMC and benefit from:
• fast, convenient online submission
• thorough peer review by experienced researchers in your field
• rapid publication on acceptance
• support for research data, including large and complex data types
• gold Open Access which fosters wider collaboration and increased citations
• maximum visibility for your research: over 100M website views per year
At BMC, research is always in progress.
Learn more biomedcentral.com/submissions