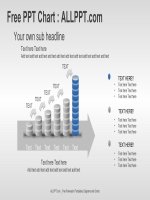
(Mẫu powerpoint) infographics charts
Bạn đang xem bản rút gọn của tài liệu. Xem và tải ngay bản đầy đủ của tài liệu tại đây (1.89 MB, 54 trang )
Charts & Infographics
Data-driven charts and editable shapes for PowerPoint
Contents
01 – Simple charts
02 – Advanced charts
03 – Charts with “Male / Female” elements
04 – Column charts
05 – Bar charts
06 – Pie charts
Charts & Infographics
01
Infographics - Simple Charts
Data-driven charts for
Charts & Infographics
Infographics for PowerPoint – Pie Charts
Data-driven Pie Charts
Information 1
4
Information 2
Information 3
Infographics for PowerPoint – Pie Charts
Data-driven Pie Charts // Doughnuts
70
Information 1
5
60
Information 2
40
Information 3
Infographics for PowerPoint – Pie Charts
Data-driven Pie Charts // Doughnuts
70
Information 1
6
60
Information 2
40
Information 3
Infographics for PowerPoint – Pie Chart
Data-driven Pie Chart // Doughnut
9%
10%
23%
7
59%
Infographics for PowerPoint – Pie Chart
Data-driven Pie Chart // Doughnut
0.09
0.1
0.23
0.59
8
Infographics for PowerPoint – Pie Chart
Data-driven Pie Chart // Doughnut
0.09
0.1
0.23
0.59
9
Infographics for PowerPoint – Pie Chart
Data-driven Pie Chart // Doughnut
0.09
0.1
0.23
0.59
10
Infographics for PowerPoint – Progress Bars
Data-driven Column charts
80
70
50
20
11
Infographics for PowerPoint – Stacked Bars
Data-driven Bar charts
Information 1
Information 2
Information 3
Information 4
12
Infographics for PowerPoint – Bars
Data-driven Bar chart
13
02
Infographics – Advanced Charts
Data-driven charts for
Charts & Infographics
Infographics for PowerPoint – Radial Chart
Data-driven Pie Chart
Tip:
15
Overlay as much pie-charts as needed
Infographics for PowerPoint – Radial Chart
Data-driven Pie Chart
16
Infographics for PowerPoint – Radial Chart
Data-driven Pie Chart
17
03
Infographics - Male / Female
Data-driven charts for
Charts & Infographics
Infographics for PowerPoint – Female Vs. Male
Data-driven Stacked Column Chart
Female
Male
Tip:
19
Uses editable shapes as layers ;
the chart is sent to back
Infographics for PowerPoint – Female Vs. Male
Data-driven Stacked Column Chart
Female
Male
70%
50%
Tip:
20
Uses editable shapes as layers ;
the chart is sent to back
Infographics for PowerPoint – Female Vs. Male
Data-driven Bar Chart
Female
Male
Tip:
21
Uses editable shapes as layers ;
the chart is sent to back
Infographics for PowerPoint – Female Vs. Male
Data-driven Bar Chart
Female
Male
60
85
st
1 technique:
22
Uses editable shapes as layers
Infographics for PowerPoint – Female Vs. Male
Data-driven Bar Chart
Female
Male
60
85
2
23
nd
technique:
Chart with picture fills
04
Infographics - Column Charts
Data-driven charts for
Charts & Infographics
Infographics for PowerPoint – Hourglass Diagram
Data-driven Column Chart
4.3
25
2.4
2


