Đề tài : Electricity Pricing for North Vietnam pptx
Bạn đang xem bản rút gọn của tài liệu. Xem và tải ngay bản đầy đủ của tài liệu tại đây (770.43 KB, 93 trang )
Electricity Pricing for North Vietnam
Nguyen Van Song and Nguyen Van Hanh
October, 2001
2
Comments should be sent to: Nguyen Van Song, PHD Student c/o Department of Economics,
College of Economics and Management, University of the Philippines at Los Baños, College,
Laguna 4031, Philippines.
E-mail:
EEPSEA was established in May 1993 to support research and training in environmental and
resource economics. Its objective is to enhance local capacity to undertake the economic
analysis of environmental problems and policies. It uses a networking approach, involving
courses, meetings, technical support, access to literature and opportunities for comparative
research. Member countries are Thailand, Malaysia, Indonesia, the Philippines, Vietnam,
Cambodia, Lao PDR, China, Papua New Guinea and Sri Lanka.
EEPSEA is supported by the International Development Research Centre (IDRC); the Danish
Ministry of Foreign Affairs (DANIDA); the Swedish International Development Cooperation
Agency (Sida); the Ministry of Foreign Affairs, the Netherlands; the Canadian International
Development Agency (CIDA); the MacArthur Foundation; and the Norwegian Agency for
Development Cooperation (NORAD).
EEPSEA publications are produced by Corpcom Sdn. Bhd. in association with the Montfort
Boys Town, Malaysia. This program provides vocational training to boys from low-income
families and home-based work to mothers. EEPSEA publications are also available online at
.
ACKNOWLEDGMENTS
This project was funded by the Economy and Environment Program for Southeast Asia
(EEPSEA).
My greatest appreciation goes to Dr. David James, for his supervision of the research
project. I am indebted to Drs. David Glover, Herminia Francisco, Mohan Munasinghe and A.
Myrick Freeman for their valuable advice, support and encouragement throughout the entire
research.
I greatly appreciate the help of staff of EEPSEA, my assistants and others. I also
appreciate the support provided by staff and students of the Department of Economics and
Rural Development – Hanoi Agricultural University # I during the survey in Quangninh
province.
Finally, this project would not have been possible without the collaboration of the
experts of the Vietnamese Energy Institute, the Institute of Mining Science Technology, the
Center of Natural Resource Research and the Department of Environment Science and
Technology of Quangninh province. I sincerely thank them all very much.
4
TABLE OF CONTENTS
Abstract 1
1.0 Introduction 2
1.1 Introduction and Background to the Study 2
1.2 Objectives of the Study 4
2.0 Review of Literature and Methodology 4
2.1 Review of Literature 4
2.2 Methodologies 6
2.2.1 Estimation of the Long-run Marginal Cost 7
2.2.2 The Marginal Production Cost (MPC) 9
2.2.3 The Marginal User or Depletion Cost (MUC) 9
2.2.4 The Marginal Environmental or External Cost 10
3.0 Background Information: Coal Mining and Environmental Impacts 24
3.1 Coal Mining 24
3.2 Environmental Impacts of Coal Mining 25
3.2.1 Environmental Pollution Problems in Halong Bay (IMST - 1997) 25
3.2.2 Environmental Situation in Coal Mining Areas (IMST - 1997) 28
4.0 Electricity Generation and Environmental Impacts 40
4.1 Environmental Situation Related to Coal Power Plants 40
4.1.2 Institutional, Legislative and Regulatory Issues 40
4.2 Technological Options for Environmental Control 45
4.2.1 Technological Options for Environmental Control of Coal-Fired Thermal
Power Plants 46
4.2.2 Estimating Air Environmental Impacts Caused by Burning Coal in Coal-
fired Thermal Power Plants of Group A 48
4.2.3 Estimating Air Pollution Caused by Burning Coal in Thermal Power
Plants of Group B 49
5.0 Summary of Results 51
5.1 Coal Mining 51
5.2 Power Sector 53
5.2.1 MPC
capacity
of Electricity 53
5.2.2 The MPC
energy
and Environmental Cost of Electricity Sector 57
5.2.3 The U-shaped Pollution Cost Curve of Coal-fired Power Plants 59
6.0 Conclusions and Policy Implications 61
6.1 Costs 61
6.1.1 Mining Sector 61
6.1.2 Electricity Sector 61
6.2 Environmental Policy Instruments 62
6.2.1 Environmental Policy Instruments for Coal Mining Sector 62
6.2.2 Environmental Policy Instruments for Coal-fired Electricity Sector 68
References 73
Appendices 83
LIST OF TABLES
Table 1. Daily Waste Sources of Halong Bay Pollution 26
Table 2. Analysis of Wastewater at Culvert Gates N
o
2, 3 and Seawater 200m from Gate N
o
2 28
Table 3. Density of Heavy Metals in Seawater from Seaside 28
Table 4. Chemical Analysis of Wastewater in Selected Mines 31
Table 5. Wastewater Quality at Selected Opencast Mining Sites, September 1997 32
Table 6. Dust Levels at Hongai Coal Mines 34
Table 7. Variations in the Campha Mine Region, 1965-1978 37
Table 8. Estimated Emissions after Installation of Wet Cyclones for Group A 49
Table 9. Emissions Before TSP Emission-reducing Equipment for Group B 51
Table 10. Emissions After TSP Emission-reducing Equipment 51
Table 11. Summary of Estimated Production and Environmental Costs of Coal Mining, 1998 52
Table 12. Marginal Environmental Cost of Coal Mining, 2010 52
Table 13. Summary of the Results of MPC
capacity
54
Table 14. Summary of the Results of Estimation of MPC
energy
and Environmental Cost 57
Table 15. The U-shaped Pollution Cost Curve of Coal-fired Power Plants in North Vietnam 58
Table 16. Summary of the Marginal Energy Costs and the Marginal Environmental Costs per
kWh (MPC
C
+ MPC
E
+ MEC
1
+ MEC
2
) 60
LIST OF FIGURES
Figure 1. Social Cost of Electricity 6
Figure 2. U-shaped Pollution Cost Curve 19
Figure 3. Cost of Abatement in Coal-fired Plants 59
LIST OF APPENDIX TABLES
Appendix 1. Health Cost (A) for 1997 and 1998: Health Damage Costs Respectively for Mine
Workers and Nearby Residents: A1 and A5 83
Appendix 2. Pollution Treatment Cost (B): Pollution Treatment Cost in Areas Inside Mine (B
1
) 84
Appendix 3. Cost of Treating Domestic Water Sources in Areas Outside the Mines (B
2
) 86
Appendix 4. Loss of the Tourism and Recreation Benefits (C) 86
Appendix 5. Damage to Forest Resources (D
1
) 89
Appendix 6. NPV Calculation for Reforestation Projects – 10 years 89
Appendix 7. Loss to the Fisheries Sector (D
2
) 90
Appendix 8. Loss in Agriculture – Year 1998 (D
3
) 91
Appendix 9. Loss in Infrastructure (E) 93
1
ELECTRICITY PRICING FOR NORTH VIETNAM
Nguyen Van Song and Nguyen Van Hanh
ABSTRACT
The rapid economic growth in Vietnam has resulted in an increasing demand for
electricity. This in turn translates to a higher rate of coal resource extraction and
consequent rise in pollution of water and land resources.
This study estimated the environmental costs associated with the electricity
demand requirements of the coal electricity sector, as a component of the long-run
marginal opportunity cost (LR-MOC) of electricity production.
The LR-MOC has three components: Marginal Production Cost or direct cost
(MPC), Marginal User Cost (MUC) and the Marginal Environmental Cost (MEC). The
MEC is divided further into two components: Marginal Environmental Cost of coal
mining (MEC
1
) and Marginal Environmental Cost of coal burning (MEC
2
). The MEC
1
consists of on-site environmental cost and off-site environmental cost while the MEC
2
is made up of control cost and off-site environmental cost.
The total production cost per tonne of clean coal was 241,050 VND in 1998 and
was estimated to be 343,679.70 VND in 2010. The marginal environmental cost of coal
mining (MEC
1
) is 19,029.4 VND/per tonne in 2010 or 5.5% of production cost. Of the
MEC
1
, on-site and off-site cost is about 3.6% and 1.93% of production cost,
respectively.
The LR-MOC of coal electricity is 771.9 VND/per kWh at transmission and
975.5 VND/per kWh at distribution. The MEC (MEC
1
+ MEC
2
) accounts for 16.6% at
transmission and 13.9% at distribution level. In comparison to the current tariff, the cost
of the total electricity in 2010 is 1.75 times higher. The most suitable technological
options for pollution control in coal-fired thermal power plants are precipitators for
Group A and bag filters and limestone injection for Group B2. The least abatement and
damage cost is associated with environmental technology alternative 2 (ETA
2
) valued at
1,862 billion VND.
Given the worsening environmental problems in Halong Bay, which is a coal
mining area, and the overall deteriorating environmental situation due to coal-fired
power plants in Vietnam, the current subsidy of 25-30% to production cost and
electricity tariff should gradually be removed. In fact, the environmental cost should be
included in electricity and coal prices.
2
1.0 INTRODUCTION
1.1 Introduction and Background to the Study
The comprehensive reform of Vietnam’s economic system that began in 1986
has shown impressive results. The Gross Domestic Product (GDP) has grown by an
annual rate of 8.2% from 1991 to 1997 and was 5.6% in 1998 (Phan Van Khai – Prime
Minister). Vietnam now not only feeds itself, but is the second largest exporter of rice in
the world. Direct foreign investment has also increased significantly. Growth
projections are quite optimistic.
Vietnam can learn from the experience of other countries in Asia and in the
world, which shows that such accelerated economic growth imposes serious and
sometimes irreversible damage on the natural environment. Already, economic growth
has led to serious environmentaldegradation in Vietnam. The rapid growth rate (average
GDP of 8.2%) has resulted in an increasing electricity demand; loss of the country’s
forest cover by 36% since 1943; a decrease in agricultural land per capita by almost
50% (Agricultural Environmental Conference, Agricultural Ministry 1999); an increase
in contaminated surface and ground water by urban and industrial wastes; and
contamination of large areas of the country from natural resource extraction such as
coal mining. The air, water, ocean and land have become polluted and health has been
affected by the industrial, transportation, coal mining and electricity sectors.
In 1997, Vietnam’s national unified electricity system covered 61 provinces and
cities (90% of districts, 50% of communes and over 50% of households). It had a total
installed capacity of 4,892.4 MW (hydropower - 57.6%, gas turbines - 17.7%, coal-fired
steam thermal- 13.2%, diesel - 7.5% and FO-fired steam thermal - 4%) and total
electric generation of 19,095 GWh (hydropower - 61%, gas turbine - 15.3%, coal-fired
steam thermal - 17.4%, Fuel-Oil fired steam thermal - 5.3% and diesel - 1%).
The rationale for long-run marginal cost (LRMC) pricing in Vietnam is as
follows: a) in the context of socio-economic renovation (from 1986), the electricity
sector has to reform its current electricity pricing from a subsidized electricity-pricing
mechanism to an open market one; and b) in order to enlarge the different international
cooperation on investment for electric power development such as through BOO (Build-
Operate-Own), BOT (Build-Operate-Transfer), sharing contracts, captive power etc., it
is necessary to establish a LRMC-based electricity tariff system.
However, it would be necessary to gradually change the prevailing electricity
pricing by taking into account that: a) Vietnam’s electric power system has been
nationally unified by the 500 kV EHV (Extra-High Voltage) line North-South from the
year 1994 with a centralized management through a subsidized electricity pricing
mechanism; and b) up to now, Vietnam’s current electricity pricing is still essentially
3
under government subsidy, especially in rural electrification, electric hydraulic pumping
and in agriculture development.
What is being considered is an LRMC-based electricity pricing mechanism with
two financial choices: One is to continue the current subsidized electric power pricing.
In this scheme, the electricity development investment demand would be largely
supported by the governmental budget. Secondly, the government will gradually reduce
the current subsidy on electricity by enhancing the prevailing electricity tariff level up
to the LRMC. This scheme will lead to the development of a financially self-sufficient and
autonomous electricity sector that would respond to electricity development investment
demand.
In the transition to a LRMC-based electricity pricing mechanism, it is necessary
to take into account the current and projected electricity supply, covering up to year
2010. By that time, it was projected that there will be a shortage of electricity sources
due to limited development investment in electricity. To solve the problem, Vietnam
has to tap various electricity sources such as coal-fired or fuel-fired steam thermal
power plants, gas turbines and hydropower plants. It would not be possible to make
distinction between them in peaking or/and base-loading. However, in Vietnam, the
peaking task belongs principally to gas turbines using diesel oil (DO), followed by
hydropower plants (occupying a large percentage of Vietnam’s electricity system). The
base-loading task belongs to coal-fired steam thermal power plants, hydropower plants,
and gas-based combine cycle gas turbines used at times to fuel-fired steam thermal
power plants.
The present study has limited its research to the North Vietnam coal-fired steam
thermal power plants. Specifically, it focused on the LRMC-based electricity pricing
using coal as an electricity source.
Coal is one of Vietnam’s most important sources of energy. Unfortunately, coal
mining also causes environmental degradation and pollution. For example, coal mining,
especially in Quangninh Province, has resulted in the following environmental
damages:
a) Ill health of coal mining workers, accidents and loss of workdays among
others;
b) Pollution of underground and surface water;
c) Pollution of agricultural land by surface-clearing and by runoff from large
piles of overburden;
d) Destruction of forests by land-clearing for mines and timber;
e) Air pollution in towns and cities from mining and the transport of the coal
right through the residential areas;
4
f) Damage to marine resources, including the heritage site of Halong Bay,
because of the large discharges of mining wastes, runoff from overburden
and waste piles and discharge waters from coal cleaning plants; and
g) Noise pollution in areas surrounding the mines and processing plants.
1.2 Objectives of the Study
1. To estimate the long-run marginal opportunity cost (LR-MOC) of producing
electricity using coal in North Vietnam.
2. To provide information on the marginal user cost and environmental cost of
producing electricity using coal for the improvement of the present electricity
pricing system in North Vietnam.
3. To identify pollution control technology options with acceptable
combinations of control costs and environmental benefits.
4. To analyze the implication of improving the MOC in Vietnam and identify a
set of economic and regulatory instruments for the government.
2.0 REVIEW OF LITERATURE AND METHODOLOGY
2.1 Review of Literature
Freeman (1990) showed that the economic value of resources is influenced not
only by biological and economic factors, but also by institutions. In 1995, he developed
an economic methodology and a computer model that calculates the external cost for
new and re-licensed electricity resource options. His study in 1997 provided an
overview of the issues associated with environmental costing and the effort to measure
the environmental costs of electricity. It also discussed general applications of methods
to estimate monetary loss due to environmental externalities.
Pearce et al. (1994) in World Without End concluded that the economic effects
of the subsidies tend to be more dramatic than the environmental effects; they drain
government revenues and thereby divert valuable resources away from productive
sectors. They also tend to reduce exports of any indigenous energy, thereby adding to
external debt, and encourage energy-intensive industry at the expense of more efficient
industry.
During the past years, five major studies (Thayer, 1991; EC, 1994; Lee et al.,
1994; Rowe et al., 1995; and Desvousges, 1995) have been completed, providing
estimates of some of the external environmental costs of adding capacity to an electric
generating system. All the studies used a damage function approach to estimate external
costs adopting the following steps: a) estimate the emissions and other environmental
stresses specific to the technology and fuel type being studied; b) estimate changes in
5
the relevant measurement of environmental quality; c) as functions of the emissions,
estimate the physical effects of changes in environmental quality on the relevant
receptors; d) apply unit values from the literature to convert physical effects to
monetary damages for each end point; and finally, e) aggregate damages across all
receptors and points.
Munasinghe (1982) conducted some case studies in the theory of electricity
pricing. Results showed that substantial progress in reducing energy needs per unit of
output, as well as controlling the level of pollution per unit of energy generated, could
be achieved by combining the potential contribution of technical interventions with
price reform.
Another study by Munasinghe in 1990 showed that the energy sector reform
could contribute to both economic and environmental goals. In most developing
countries, electricity prices have been well below the incremental cost of future
supplies. Many studies showed that eliminating power subsidies by raising tariffs closer
to the LRMC of power generation would encourage more efficient use of electricity. In
addition, pricing reforms were found to have better economic and environmental
impacts than purely technical approaches. Of course, a combination of both pricing and
technical measures provided the best results.
A review of electricity tariffs in 60 developing countries by the World Bank
(1993) showed that average tariffs declined over the period 1979-1988 from US$0.052
to US$0.0038 per kWh. This is particularly troubling as energy demands are expected
to grow, and will probably double in the next 15 years.
The World Development Report for 1992 (World Bank, 1992) noted that energy
subsidies exceeded US$150 billion annually in developing countries. For electricity
consumption alone, the subsidies amounted to about US$100 billion per year,
suggesting that both capital and energy sources were being wasted on a very large scale.
A study by Warford et al. (1997) indicated that raising electricity prices to the
least LRMC (or as an approximation, Average Incremental Cost) is a priority. More
ambitiously, it should be equal to marginal opportunity cost (MOC). Price reform will
thus typically fall well into the “win-win” category. The benefits from increased
electricity tariffs would be twofold. They concluded that removing all energy subsidies
would produce large gains in efficiency and in fiscal balances, and would sharply
reduce local pollution and cut carbon emissions by as much as 20% in some countries,
and by about 7% worldwide. Consumers use about 20% more electricity than they
would if they paid the true costs of supply.
Possible long-term effects discussed by Ramsay (1979) include the increased
level of carbon dioxide released into the atmosphere from burning coal that may change
the average temperature of the world, leading to as yet uncertain but possibly disastrous
consequences. These are called health and environmental problems – the “unpaid costs
of electricity because most of them do not show up in our monthly utility bills.” But
6
they are just as costly – in money, lives, or in a degraded environment – as any other
kind of expense to society.
Most concerns on air emissions from the coal fuel cycle center on coal
combustion, the emissions of which can affect natural ecosystems as well as human
health and welfare over a broad region. The other portions of the fuel cycle also have
important impacts but tend to be confined to a more local area (US Office of
Technology Assessment, 1979).
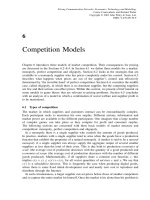
2.2 Methodologies
Under environmental-social efficiency, Marginal Social Cost, not Marginal
Private Cost should be considered. For any commodity, the social efficiency price
should be achieved at P
s
* if the amount of consumption is at Q
p
*. Otherwise, if the
price is P
p
, the social amount should be produced at Q
s
*.
MPC
P
s
*
MEC
P
p
MUC
O
Q
s
* Q
p
*
Figure 1. Social Cost of Electricity
where: MSC is marginal social cost
MPC is marginal private cost
MEC is marginal environmental (external) cost
MUC is marginal user cost
Therefore: MSC = MC + MEC + MUC
MSC
7
The components of the long-run marginal opportunity cost (LR-MOC) are as
follows:
LR- MOC = MPC + MUC + MEC
or LR-MOC = MPC
capacity
+ (MPC
energy
+ MEC) + MUC
Average Incremental Cost (AIC)
For the purposes of this study, the AIC is a good enough approximation to
[MPC
capacity
+ MPC
energy
].
2.2.1 Estimation of the Long-run Marginal Cost
The strict long-run marginal cost (LRMC) may be defined broadly as the
incremental cost of all adjustments in the system expansion plan and system operations
attributable to an incremental increase in demand that is sustained into the future.
Cost Categories and Pricing Periods
Three broad categories of marginal costs may be identified for the LRMC
calculations: capacity costs, energy costs, and consumer costs. Marginal capacity costs
are basically the costs of investment in generation, transmission, and distribution
facilities to supply additional kilowatts. Marginal energy costs are the fuel and
operating costs needed to provide additional kilowatt-hours from a thermal plant,
whereas in a hydroelectric system a part of the investment cost associated with storage
may be related to energy. Marginal customer costs are the incremental costs directly
attributable to consumers, including costs of hook-up, metering, and billing. Wherever
appropriate, these elements of LRMC must be broken down by time of day, voltage
level, and so on.
Suppose gas turbines are used for peaking. Then the required LRMC of
generating capacity (LRMC
Gc
) may be approximated by the cost of advancing or by the
cost-saving from delaying 1 kilowatt of gas turbine. This may be estimated by the cost
of a kilowatt installed, annualized over the expected lifetime, and adjusted for the
reserve margin (RM) and appropriate percentage loss (L
G
) typically caused by station
use. Therefore:
LRMC
Gc
= (annualized cost per kilowatt) + (1 + RM/100)/(1 - L
G
/100)
Next, the LRMC of transmission and distribution is calculated. Generally, all
costs of investment in transmission and distribution (T&D) –except customer costs
which will be discussed later – are allocated to incremental capacity. This is because the
8
designs of these facilities are determined principally by the peak kilowatts they carry
rather than the kilowatt-hours, particularly at the distribution level. However, the size of
a given feeder may depend on the local demand peak, which may not occur within or
coincide with the system’s peak period. This could complicate the problem of allocating
distribution capacity costs among the various pricing periods. The concept of
structuring by voltage level may be introduced at this stage, considering several supply
voltage categories – extra high (EHV), high (HV), medium (MV), and low (LV). Since
consumers at each voltage level are charged only upstream costs, capacity costs at each
voltage level must be identified.
Assume that the AIC of EHV and HV transmission has been computed and
annualized over the lifetime of the plant – for example, 30 years – to yield the marginal
costs ∆LRMC
HV
. Then, the total LRMC of capacity during the peak period at the HV
level would be:
LRMC
HVc
= LRMC
Gc
/(1 - L
HV
/100 + ∆LRMC
HV
)
where: L
HV
is the percentage of incoming peak power that is lost in the EHV and
HV network.
This procedure may be repeated at the MV and LV levels. Thus the LRMC of
capacity to MV consumers is given by:
LRMC
MVc
= LRMC
HVcc
/(1 - L
MV
/100 + ∆LRMC
MV
)
where: ∆LRMC
MV
is the element of incremental MV capacity costs, for
example, the AIC of distribution substation and primary feeders; and L
MV
is the percentage of incoming peak power that is lost at the MV level.
The LRMC of transmission and distribution (T&D) calculated in this way is
based on actual growth of future demand and is averaged over many consumers.
The LRMC of off-peak energy corresponding to a load increment during the off-
peak period would usually be the running costs of the least efficient base-load or
cycling plant used during this period. Exceptions to this generalization would occur
when the marginal plant used during a pricing period was not necessarily the least
efficient machine that could have been used. For example, less-efficient plants that have
long start-up times and are kept running because they are required in the next pricing
period may be operated earlier in the loading order than the more-efficient plants. This
would correspond to minimization of operating costs over several pricing periods rather
than on an hourly basis. Again, since the heat rate of the plants could vary with output
level, the simple linear relation usually assumed between generation costs and kilowatt-
hours may need to be replaced by a more realistic nonlinear model. The loss factors for
adjusting off-peak costs will be smaller than the loss factors for the peak period. For
example, resistive losses are a function of the square of the current flows and are
greatest during the peak period.
9
The treatment of losses generally raises several important issues. Total normal
technical losses, including station use, vary from system to system. If these are
significantly greater than about 15% of gross generation, then reduction of the losses
should have a high priority.
The LRMC analysis at the generation, transmission, and distribution levels helps
to establish whether these incremental costs are excessive because of over-investment,
high losses, or both.
2.2.2 The Marginal Production Cost (MPC)
According to Warford (1994), the AIC can be estimated by the following
formula:
T
∑ (I
t
+ OP
t
) / (1+r)
t
t=1
Average Incremental Cost (AIC) =
T
∑ (Q
t
- Q
o
) / (1+r)
t
t=1
where: I
t
is investment cost in year t, OP
t
is the operating cost in year t
(including fuel, labor, maintenance, etc.), (Q
t
-Q
o
) is incremental
consumption of electricity in year t, and T is the planning time horizon.
2.2.3 The Marginal User or Depletion Cost (MUC)
According to Warford (1994),
(P
r
- C)
MUC =
(1 + r)
T
where: P
r
is the price of backstop replacement technology or the cost of
imports, C is the price of existing technology, T is the time at which the
replacement technology comes in (when coal is depleted).
However, the user cost, in particular, is not a relevant consideration. There is
sufficient coal reserve to last for many decades. After applying a discount rate, any
incremental cost associated with the introduction of the next cheapest technology will
have a negligible effect on present values.
10
2.2.4 The Marginal Environmental or External Cost
(MEC = MEC
1
+ MEC
2
)
Marginal Environmental Coal Mining Cost (MEC
1
)
MEC
1
is broken down into two terms: On-site environmental protection cost
(control technologies + compensation/treatment costs) and off-site residual
environmental damage costs.
Despite the considerable economic contribution of the national coal industry to
Vietnam, it has also resulted in great losses due to environment and health damages and
a decrease in productivity of other industries like agriculture, forestry, fishing and
tourism. On the other hand, the coal industry spends a large amount of money for
structures to treat pollution, for ensuring work safety, for improving the environment
surrounding coal mining enterprises and nearby residential areas, and for health
treatment of mining staff and others.
To calculate how much money Vietnam annually spends to resolve the
environmental aftermath caused by the coal industry, the following section will present
the method used to account for the marginal environmental cost of the national coal
industry (MEC
1
) in the coming years. The general steps are:
First: total environmental cost of industries relating to pollution by the coal
industry in the past several years should be established.
Second: average environmental cost per tonne of pollutant and per year should
be measured based on the total cost estimate earlier.
Last, average MEC
1
in the past several years should be used as a basis to project
MEC
1
for the succeeding years.
A. Health damage cost
All mine workers of the National Coal Industry are required to purchase
insurance cards. They always use their insurance card to take health examinations.
Hence, collecting health data from document sources on health treatment and insurance
is the most important basis for calculating the health treatment cost. The health
insurance card, however, covers only the treatment of common diseases while other
types of occupational sickness are paid for by the workers or their mine companies.
This health treatment cost is calculated using the following formula:
A A
i
i
n
=
=
∑
1
11
where:
i = the occupational diseases often caught by mine workers
n = number of common and occupational diseases of the coal
mining industry
A= total health damage cost for all occupational diseases,
injured workers, etc.
It is sum of A
1
-A
5
discussed below.
A
1
. The health examination and treatment cost
The health examination and treatment cost (A
1
) is calculated as follows:
where:
N
i
= average number of workers catching the type of disease i per year
P
i
= average treatment cost for disease i per patient
The estimated health and treatment costs in 1998 are shown in Appendix 1.
A
2
. Health treatment cost for injured workers when they are working
Injury from mining is not included in health insurance. Hence, all treatment costs
for injuries associated with mining are paid for by both injured workers and their mine
companies. This cost can be calculated using the following formula:
where:
j = type of injury
m = number of types of injury
N
j
= average number of injured workers for injury type j per year in
recent years
P
j
= the highest damage cost paid by an injured worker for type j
to recover his health and to be able to work again (data sources
based in 1997 records)
The health treatment costs for injured workers in 1997 are shown in Appendix 1.
A N P
j j
j
m
2
1
=
=
∑
A N P
i i
i
n
1
1
=
=
∑
12
A
3
. Compensation cost for deaths on the job
This cost can be calculated using the following formula:
A
3
= N x Q
where:
N = number of dead workers per year
Q = the highest payment for dead worker’s family by mine companies in
the National Coal Industry in 1997
The estimates of the compensation cost for deaths of workers on the job are
shown in Appendix 1.
A
4
. Lost workdays
This cost may be paid by either the injured workers’ companies (which normally
pay them wages when they leave their jobs) or the sick/injured workers themselves
(who do not enjoy workday wage) or both the company and the worker. The worker is
paid only one part of wages of lost workdays. All of these costs are charged as a loss to
the National Coal Industry. The wage for one workday below is calibrated at the
average level for the whole industry:
A
4
= W x L
where:
W = number of lost workdays per year of the National Coal Industry
L = average wage/day/worker (L in the year 1998 was 38,500
VND/workday).
The estimates of the lost workday cost in 1998 are shown in Appendix 1.
A
5
. Compensation cost for residents near mining areas
This cost can be calculated by the following formula:
A
5
= G x M
where:
G = average number of patients per year from mine’s surrounding areas
M = health treatment cost
The results of the compensation cost calculation for residents near mining areas
in 1998 are shown in Appendix 1.
13
B. Air, water and noise pollution treatment cost
In theory, b
1
or the pollution treatment cost inside the mine is computed by:
b
1
= n x P
where:
n = number of mine exploiting companies directly under
the Vietnam National Coal Corporation.
P = the average pollution treatment cost cross all mines
or enterprises
The domestic water treatment cost for the different residential areas affected by
coal mining activities, b
2
is also calculated as follows:
b
2
= n x Q’
where:
n = number of residential areas
Q’ = average domestic water treatment cost per year for a
residential area
The sum of b
1
and b
2
constitutes the cost of air, water and noise pollution
treatment cost or B.
In practice, which considers actual situation and pollution treatment cost items, B
is calculated as follows as adopted in this study:
b
1
= Pollution treatment cost inside the mine: The data was taken from reports on
the environmental impact assessments of coal mining activities in 1997 in
four representative large mines: Hatu, Naduong, Cocsau (Bm1), and
Hongai coal preparing plant at Quangninh province (bp1). The drinking
water treatment cost for these mines is considered part of the water
pollution treatment cost. Specifically, the projected values for b
1
from 1999
to 2010, were derived from the Environmental Impact Management Report
in 1997 and are shown in Appendix 2.
b
2
= Pollution treatment cost outside the mine: This is the cost spent ontreating
polluted water used for household consumption, in areas affected by mining
pollution. Although mine companies do not have to pay for this cost item, it
is an environmental cost that has to be accounted for as a cost to society.
The b
2
incurred by society in areas affected by the mining activities per year is
calculated using the following formula:
n
b
2
= ∑ S
i
(Q
i
- P
i
) x 365
i =1
14
where:
Q
i
= average production cost per m
3
of domestic water supply after pollution
from mining at region i
P
i
= average price per m
3
of domestic water supply before pollution from
mining at region i
Q
i
-P
i
= increase the cost of domestic water supply due to pollution from mining
S
i
= shortage in domestic water supply per day due to mining pollution at region
i
n = number of regions with domestic water pollution caused by mining activities
The estimated cost of treating domestic water supply (b
2
) in affected areas 1998
is shown in Appendix 3.
C. Loss of tourism and recreation benefits
Halong Bay is important to the community in many ways. Many people see
Halong Bay as a place that offers a pleasant contrast to their daily routines. It also
provides specific recreational activities like fishing, boating, strolling, swimming and
others.
Loss of tourism (C
1
), caused by mining pollution can be calculated using the
following formula:
C
1
= f x P x 30%
where:
f = net return per tourist per year over the last seven years
(1992-1997)
P = average decrease in number of tourists over the last seven years
(Data was taken from records of Quangninh Tourist Company).
There is a 30% percent decrease in number of tourist as the results of coal
mining activities (source Tourist Development Assessment Project in Halong City of
Hanoi National University, 1997)
There is also the loss of recreational benefits by local residents (C
2
) that is
calculated as follows:
C
2
= ∑ C
2i
* W
where:
C
2i
is the number of hours of loss in recreational time for activity i due to
mining pollution.
15
W is average wage rate of local resident, which was adjusted by 20% for
unemployment
i refers to recreation activities (swimming, boating, fishing, etc.)
The time spent by each household for swimming, fishing, boating, and strolling
was collected weekly and then estimated yearly.
The estimated loss of the tourism (C
1
) and recreation (C
2
) in 1998 are summed
up as C and are shown in Appendices 4 and 5.
D. Forestry production, fishing and agriculture losses caused by the coal
industry
D
1
. Forestry production loss
Quangninh is a mountainous region of approximately 600,000 ha, which include
forestlands of 280,000 ha and agricultural land of 51,000 ha. Most of the large coal
reserve mines in the country are located on the highland terrain of Quangninh province.
According to statistical data of 1993, mineral ore mining activities took place on 28% of
the total land area, 23% of the forest area and 4% of the industrial and residential area
of Quangninh province. The forest land area was reduced to 42% and 18-20% in 1969
and 1985, respectively, due to both direct mining and mining service activities in this
area. For example, deforestation resulted from underground mining since the area was
cleared to construct mine access. For this reason, the level of annual forest products also
decreased. Hence, when mineral ore mining activities are carried out in any area within
the forest land, in addition to the forest land’s opportunity cost generated by the mining
process, mining activities also cause the loss of other forest products such as firewood,
forest and animal meat. This is shown as:
D
1
= D'
1
+ D
''
1
where:
D
'
1
= the income foregone (opportunity cost) of forest lands used for
mining
D
"
1
= total losses of non-timber products (e.g., firewood)
Based on the data stated above, the opportunity cost of coal mining activities per
year is
D'
1
= S
i
x A
where:
S
i
= forest land area destroyed by coal mining activities
A = annualized income derived after estimating the net present
value (NPV) of the income from forest land use (calculated
using 10% discount rate – Appendix 6)
16
The estimated loss of opportunity cost of forestland use, (D
1
'
), is shown in
Appendix 5.
Quangninh Forest is not a virgin forest; it has low hills and a shrub terrain with
timber. As described above, when timber from the natural forest is exploited to supply
the wood requirement of underground mining and mine construction, the forest animals
move to other places that are not affected by coal exploitation. Another forest product
that is often exhausted is firewood.
According to data collected, the loss of forest products can be calculated by the
formula below:
D
''
1
= S x r x T
where:
S = average forest area destroyed per year by coal mining activities
r = amount of firewood/ha forest (m
3
)
T
= cost of 1 m
3
firewood based on net price
The estimated loss from damage to forest resources (D
1
") is shown in Appendix
5.
D
2
. Loss to the fisheries sector
The coal mining industry also affects the fisheries sector because a large amount
of untreated wastewater from coal mines is directly discharged into the sea. Therefore,
coastal resources are strongly affected as indicated by the considerable decrease in the
annual fish catch. To meet the increasing local and foreign demand for fish products,
the fishing sector is improving its catching techniques and changing its fishing locations
(for example, combining offshore catching and mariculture activities). Loss of fish
products is very difficult to calculate exactly. Therefore, this loss may only be estimated
by the following formula:
where:
a) Increased cost of catching fish near the shoreline – municipal fishing
areas:
Q
i
= q
i
x h
a I
With:
Q
i
= annual increase in cost of catching fish near the shoreline
h
ai
= catch near the shoreline in year i
n
D
2
= k [ ∑ (P
i
+ Q
i
)]/n
i= 1
17
q
i
= increase in weighted average cost of catching a tonne of fish near
the shoreline in year i compared to year i-1, due to reduced fish
availability caused by pollution.
b) Increased cost of catching fish beyond 15 km from the shoreline –
commercial fishing areas.
P
i
= p
i
x h
bi
With:
p
i
= increase in cost of catching a tonne of fish caught far from the
shoreline in year i.
h
bi
=
catch far from the shoreline in year i
P
(i)
= annual increase in cost due to catching fish far from the shoreline.
c) Number of years (n) and impact level (k)
n = number of years (1994 -1997)
k = impact level of the national coal industry, according to the estimates
of the Quangninh Fishing Department
The estimated loss to the fishing sector (D
2
'
) is shown in Appendix 7.
D
3
. Agriculture loss
Quangninh province does not have a large agricultural land area because it is a
mountainous area. The agriculture area is about 57,124 ha or 9.6% of the total land
area. The province has most of the nation’s large reserve mines (95% of the total
national coal production), of which underground coal mining production was 33% in
1996. The percentage of underground coal production has increased because of higher
stripping rate of the in-situ and deep mining deposits.
The increased level of underground mining has led to increasing demand for
mine timbers. According to mining engineers, the amount of underground mine timbers
used is approximately 50 m
3
for 1,000 tonnes of coal. One hectare of natural forest and
half a hectare of reforested areas are needed to obtain this amount of timber. This
means that for one million tonnes of coal, 50,000 m
3
of mine timbers would be needed
from 500 ha of 12- to15-year-old plantation forest in Quangninh.
At present, Quangninh’s forest is not able to meet the demand for mine timbers
for the Quangninh coal industry because of its degradation. It provided only 10% of the
demand in 1996. Obtaining additional timbers from the neighboring provinces entails a
high transportation cost. As a result, the needed timber is provided from illegal logging
in Quangninh province. According to reports by state-owned farms, Quangninh’s forest
18
exploitation is six to ten times higher than the national average, with the degradation
rate of Quangninh’s forest being also higher than the national average.
Mining activities, especially illegal mining and mining service activities, such as
forest-clearing, strongly affect the natural forest resources, the forest ecology and the
areas surrounding the mines. This damage includes soil erosion, which in turn results in
increasing areas of bald hills and a decreasing water level. In addition, crop
productivity is also reduced due to decreasing soil fertility in the agricultural land area.
The loss in agriculture (D
3
) includes: land opportunity cost (D
3
’) and loss in
harvest (D
3
’’)
where:
D
3
= D
3
’ +D
3
’’
D
3
’= Total agricultural land area x average productivity/agriculture
land area.
D
3
’’=Decrease in productivity per unit land area x total agricultural land
area affected by coal mining
The estimated loss to the agricultural sector (D
3
) is shown in Appendix 8.
Therefore, the total agriculture, forest and fishing losses, D, are:
D = D
1
+ D
2
+ D
3
where:
D
1
is loss to forest;
D
2
is loss to fishing; and
D
3
is loss to agricultural sector.
E. Impact on infrastructure by the coal industry
The estimation for this item requires identifying the areas with infrastructures
that were damaged by the coal industry.
The Campha coal region is located near a local residential area and its transport
routes have a lot of coal vehicles as well as coal mines near the municipality. Therefore,
this coal region was used as an example to estimate the cost of damaged infrastructure
caused by the coal industry:
where: E = loss to infrastructure
n = number of residential areas surrounding the coal mine
m
E = n ∑ P
i
i=1
19
i = local infrastructure to be repaired (e.g., roads, bridges and
drainage system)
m = total infrastructure items
P
i
= average repair cost per year of infrastructure item i
at the sample area
The estimated loss of infrastructure (E) is shown in Appendix 9.
where:
AEC
1
= Average environmental cost of a tonne of coal (1997 &1998)
A = Health cost
B = Air, water, and noise pollution treatment cost
C = Loss of tourism and recreation
D = Forestry, agriculture and fishing losses caused by the
coal industry
E = Cost of impacts on infrastructure by the coal industry
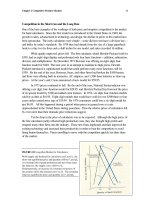
The Marginal Environmental Consumption Cost (MEC
2
)
The U-shaped pollution cost curve (Figure 2 from Hufschmidt, et al. 1983)
represents the relationship between damage costs (i.e., costs imposed by pollution –
external cost) and abatement costs (i.e., costs incurred to avoid/mitigate the effects of
pollution – environmental control costs or internal costs).
Total cost curve Abatement cost curve
Cost
Min Cost
Damage cost curve
O Pollution abatement
Figure 2. U-shaped Pollution Cost Curve
AEC
1
(1997 & 1998) = (A + B + C + D + E)/ Average total coal products of
the coal industry in year 1997 plus 1998