Báo cáo " PROTECTING AGRICULTURAL CROPS FROM THE EFFECTS OF TROPOSPHERIC OZONE EXPOSURE: Reconciling Science and Standard Setting in the United States, Europe, and Asia" ppt
Bạn đang xem bản rút gọn của tài liệu. Xem và tải ngay bản đầy đủ của tài liệu tại đây (289.87 KB, 33 trang )
27 Sep 2001 16:34 AR AR143-09-MAU.tex AR143-09-MAU.SGM ARv2(2001/05/10) P1: GSR
Annu. Rev. Energy Environ. 2001. 26:237–68
Copyright
c
2001 by Annual Reviews. All rights reserved
PROTECTING AGRICULTURAL CROPS FROM THE
EFFECTS OF TROPOSPHERIC OZONE EXPOSURE:
Reconciling Science and Standard Setting in the
United States, Europe, and Asia
Denise L. Mauzerall and Xiaoping Wang
Woodrow Wilson School of Public and International Affairs, Princeton University,
Princeton, New Jersey 08544; e-mail: ,
Key Words air pollution, agriculture, standards, development
■ Abstract Ozone (O
3
) is well documented as the air pollutant most damaging to
agricultural crops and other plants. Most crops in developed countries are grown in
summer when O
3
concentrations are elevated and frequently are sufficiently high to
reduce yields. This article examines the difficulties in scientifically determining the
reduction in yield that results from the exposure of agricultural crops to surface O
3
and
then transforming that knowledge into efficient and effective regulatory standards. The
different approaches taken by the United States and Europe in addressing this issue
as well as the few studies that have been conducted to date in developing countries
are examined and summarized. Extensive research was conducted in the United States
during the 1980s but has not been continued. During the 1990s, the European com-
munity forged ahead with scientific research and innovative proposals for air-quality
standards. These efforts included the development of a “critical level” (CL) for O
3
based on a cumulative exposure above a cutoff concentration below which only an ac-
ceptable level of harm is incurred. Current research focuses on estimating O
3
dosage to
plants and incorporating this metric into regulatory standards. The US regulatory com-
munity can learn from current European scientific research and regulatory strategies,
which argue strongly for a separate secondary standard for O
3
to protect vegetation.
Increasing impacts of O
3
on crops are likely in developing countries as they continue to
industrialize and their emissions of air pollutants increase. More research is needed on
surface O
3
concentrations in developing countries, on their projected increase, and on
the sensitivity that crop cultivars used in developing countries have to O
3
. The threat of
reduced agricultural yields due to increasing O
3
concentrations may encourage devel-
oping countries to increase their energy efficiency and to use different energy sources.
This could simultaneouslyachievealocalbenefit through improved regional air quality
and a global benefit through a reduction in the emission of greenhouse gases.
1056-3466/01/1022-0237$14.00 237
27 Sep 2001 16:34 AR AR143-09-MAU.tex AR143-09-MAU.SGM ARv2(2001/05/10) P1: GSR
238 MAUZERALL
WANG
CONTENTS
1. INTRODUCTION 238
2. BACKGROUND SCIENCE 240
2.1. Chemistry of Tropospheric O
3
Formation 240
2.2. Trends in Surface O
3
Concentrations 240
2.3. Mechanisms by Which O
3
Damages Plant Tissue 243
3. REVIEW OF CROP-LOSS ASSESSMENT STUDIES AND
REGULATORY POLICIES 244
3.1. United States 244
3.2. Europe 248
3.3. Asia 251
4. SYNERGISTIC EFFECTS OF O
3
AND OTHER
ENVIRONMENTAL FACTORS ON CROPS 253
5. SUMMARY OF DIFFERENT EXPOSURE INDICES: STRENGTHS
AND WEAKNESSES 256
6. ECONOMIC ASSESSMENTS 259
7. RECOMMENDATIONS FOR FUTURE RESEARCH 261
8. SUMMARY AND CONCLUSIONS 262
1. INTRODUCTION
Tropospheric ozone (O
3
) is a major component of smog. A scientific review by
the US Environmental Protection Agency (EPA) of the effects of O
3
found that
exposure to ambient O
3
levels is linked to such respiratory ailments as asthma,
inflammation and premature aging of the lung, and to such chronic respiratory
illnesses as emphysema and chronic bronchitis (1). Detrimental effects on veg-
etation include reduction in agricultural and commercial forest yields, reduced
growth and increased plant susceptibility to disease, and potential long-term ef-
fects on forests and natural ecosystems (1). O
3
is also believed to contribute to
building and material damage. Once thought to be primarily an urban problem,
elevated O
3
concentrations are now recognized as extending far beyond city lim-
its. Elevated concentrations in rural regions significantly affect crop yields, forest
productivity, and natural ecosystems.
In international negotiations to limit the emission of CO
2
and other greenhouse
gases, a key issue has been the meaningful participation of developing countries.
Major developing countries suchasChinaandIndia haveindicatedtheirreluctance
to devoteresourcesto limiting CO
2
emissions intheface ofmorepressing domestic
concerns. Although CO
2
emissions do not have a direct negative effect on public
health or agriculture, the detrimental effects of the emission of reactive air pollu-
tants that contribute to the formation of O
3
and smog are more easily recognized.
Most developing nations are facing increasingly severe urban and regional air pol-
lution, with associated costs, detrimental effects on human health (2) and natural
ecosystems, and, as is discussed in this article, decreases in agricultural yields.
Although in the near future developing countries may be relatively unconcerned
27 Sep 2001 16:34 AR AR143-09-MAU.tex AR143-09-MAU.SGM ARv2(2001/05/10) P1: GSR
OZONE IMPACTS ON AGRICULTURE 239
about climate change, their levels of urban and regional air pollution are increasing
in severity and are demanding attention. Fossil-fuel combustion emits both car-
bon dioxide (CO
2
), the primary greenhouse gas, and reactive air pollutants such
as nitric oxides (NO
x
= NO + NO
2
), the primary precursors for O
3
production
outside of urban areas. By choosing energy technologies wisely, these countries
can simultaneously reduce their emissions of NO
x
and CO
2
. These choices may
result in improvements both in public health and in future agricultural yields, as
well as in a reduction in the rate of increase in CO
2
emissions. For countries that
are concerned about providing enough food for their growing populations while
remaining independent of foreign food imports, the reduction in agricultural yields
in key staple crops due to air pollution may be an incentive to explore methods
that reduce both local and regional air pollution and CO
2
emissions.
Attempts to control tropospheric O
3
concentrations in the United States have
been motivated primarily by the need to protect human health. However, studies
conducted in the early 1980s in the United States and during the 1990s in Europe
and other countries—including Japan, Pakistan, and Mexico—have indicated that
many agricultural crops are adverselyaffected by exposure to tropospheric O
3
con-
centrations elevated above natural background levels. Crop sensitivities vary both
by crop species and by the type of strain within a species (cultivar), as well as being
influenced byvariousmeteorologicalfactors, includingtemperature,humidity, soil
moisture, and radiation. However, the yield of several major food crops appears to
decline when exposed to O
3
concentrations, which have become common during
the growing season in the United States and Europe. Research indicates that expo-
sure to O
3
, alone or in combination with other pollutants, results in approximately
90% of the air-pollution–induced crop loss in the United States (3).
The standard that best protects human health is different from the one needed to
protect crops. As is shown in this article, setting the same standard to protect both
human health and welfare is not optimal for either evaluating damage to vegetation
or protecting it. A variety of exposure indices have been developed to evaluate
crop-yield loss based on experimental data. Those indices that accumulate O
3
concentrations above a thresholdoverthegrowingseasonbetterrepresent crop loss
than indices that rely on either seasonal mean or peak O
3
concentrations. Recent
research in Europe has emphasized the development of standards that account for
the variability of flux into the plant rather than just ambient O
3
concentration or
cumulative exposure.
This article focuses on research that has been conducted on the exposure of
agricultural crops to enhanced concentrations of surface O
3
, the reductions in crop
yields thatresult,the development of environmental standardstoprotect vegetation
from O
3
damage, and the costs associated with lost yields. This paper is divided
into seven sections. Section 2 is an overview of the science of tropospheric O
3
formation, trends in surface O
3
concentration, and the mechanism by which O
3
damages plant tissue. Section 3 reviews the regulatory policies and crop-loss as-
sessmentstudiesconducted todatein developed(UnitedStates, Europe,andJapan)
and developing countries and presents these results in tabular form. Section 4
27 Sep 2001 16:34 AR AR143-09-MAU.tex AR143-09-MAU.SGM ARv2(2001/05/10) P1: GSR
240 MAUZERALL
WANG
summarizes the strengths and weaknesses of different exposure indices. Section
5 is an overview of the economic assessments of the costs associated with lost
yields. Section 6 makes recommendations for future research, and Section 7 con-
cludes with recommendations for the form of an appropriate standard to protect
vegetation from O
3
exposure.
2. BACKGROUND SCIENCE
2.1. Chemistry of Tropospheric O
3
Formation
O
3
isapollutant that isformedin thetropospherefrom a complexseries of sunlight-
driven reactions between nitrogen oxides (NO
x
= NO + NO
2
), carbon monoxide
(CO), and hydrocarbons, and it is also transported into the troposphere from the
stratosphere. The primary source of NO
x
to the troposphere is fossil-fuel combus-
tion. Secondary sources of NO
x
include biomass burning, lightning, and soils (4).
Hydrocarbons are emitted from a range of human activities, including fossil-fuel
combustion, direct evaporation of fuel, solvent use, and chemical manufacturing.
Terrestrial vegetation also provides a large natural source of hydrocarbons. NO
x
and CO are both directly harmful to human health and are regulated as criteria
pollutants by the US EPA.
O
3
production occurs via the catalytic reactions of NO
x
with CO and hydrocar-
bons in the presence of sunlight. O
3
production is favored during periods of high
temperature and insolation, which typically occur under stagnant high-pressure
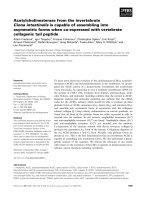
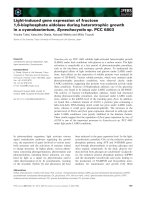
systems in summer. A schematic representation of O
3
formation is shown in
Figure 1. A critical difficulty in regulating O
3
has occurred because in regions
of high NO
x
(primarily urban centers and power plant plumes), O
3
formation is
limited by the availability of hydrocarbons. In regions of low NO
x
(primarily rural
areas with abundant emission of natural hydrocarbons), O
3
formation is limited by
the availability of NO
x
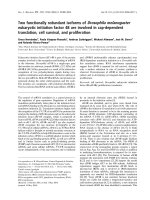
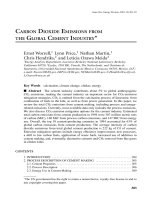
(5). Figure 2 shows O
3
concentrations as a highly nonlinear
function of volatile organic compounds (VOC) and NO
x
emissions (6). Scientists
and regulators now recognize that to control O
3
concentrations in most nonurban
locations, because of the availability of natural hydrocarbons, it is necessary to
limit the emission of NO
x
.
2.2. Trends in Surface O
3
Concentrations
O
3
concentrations vary considerably from day to day, year to year, and location
to location because of meteorological conditions (winds, sunlight, temperature,
humidity) thatvaryinboth time and spaceandbecause of variations intheemission
of NO
x
and hydrocarbons. Thus, establishing regional trends must be done in the
face of significant variability. A clear upward trend in surface O
3
concentrations
from preindustrial times to the mid-1980s has been established, however.
Concentrations of surface O
3
in central Europe 100 years ago were approxi-
mately 10 parts per billion (ppb) and exhibited a seasonal cycle with a maximum
during the spring months (8). By 1950, O
3
levels at a rural site near Paris were
27 Sep 2001 16:34 AR AR143-09-MAU.tex AR143-09-MAU.SGM ARv2(2001/05/10) P1: GSR
OZONE IMPACTS ON AGRICULTURE 241
Figure 1 Schematic of tropospheric O
3
production. O
3
is both transported into the tropo-
sphere fromthe stratosphere and producedwithin the tropospherebyphotochemical reactions
between NO
x
(NO
x
= NO + NO
2
) and HO
x
(HO
x
= OH + HO
2
). Emissions of NO
x
, CO,
and hydrocarbons from fossil-fuel combustion, fires, and biogenic processes lead to the pro-
duction of O
3
via a complex set of catalytic chemical reactions that take place in the presence
of sunlight. NO
x
is primarily removed from the atmosphere via conversion to nitric acid
(HNO
3
), which is deposited at the earth’s surface. HO
x
, produced by the oxidation of CO
and hydrocarbons, is removed by conversion to peroxides (H
2
O
2
), which are also deposited
at the earth’s surface. Peroxyacetylnitrate (PAN) is a reservoir species for NO
x
that is stable
at low temperatures and decomposes at warm temperatures, hence permitting long-distance
transport of NO
x
, the key precursor to O
3
formation in rural locations.
about 15–20 ppb and around 1980 were 30 ppb (9). Trends of rural O
3
in Europe in
the 1980s have been statistically insignificant (9). Like Europe, the United States
has had no significant increasing trend in O
3
concentrations detected in rural data
between 1980–1995 (10). However, median rural O
3
concentrations in the eastern
UnitedStatesonsummerafternoonsduringthisperiodrangedfrom50–80ppbwith
ninetieth percentile values frequently in excess of 100 ppb (10). These levels are
known to cause crop damage. Maximum O
3
concentrations are no longer observed
in the spring but occur in summer because of increased photochemical production
ofO
3
resultingfromincreasedemissions ofNO
x
andVOCs.Mostcropsinthe world
are grown in summer when O
3
photochemical production and resulting concentra-
tions are at their most elevated and are frequently sufficient to reduce crop yields.
In developing countries there is little data available on the ambient concen-
trations of O
3
in rural areas. However, the current increase in fossil-fuel com-
bustion and resulting NO
x
emissions are projected to result in increasing O
3
27 Sep 2001 16:34 AR AR143-09-MAU.tex AR143-09-MAU.SGM ARv2(2001/05/10) P1: GSR
242 MAUZERALL
WANG
Figure 2 NO
x
versus hydrocarbon limitation of O
3
production. O
3
concentrations (in
parts per billion by volume, ppbv) are calculated by a model as a function of NO
x
and
hydrocarbon (VOC) emissions. The thick line separates the NO
x
-limited (top left) from
the hydrocarbon-limited (bottom right) regimes. Note that in a NO
x
-limited regime, O
3
concentrations increase as NO
x
emissions increase but do not change as hydrocarbon
emissions increase. In a hydrocarbon-limited regime, O
3
concentrations increase more
quickly with an increase in hydrocarbon emissions and more slowly with an increase
in NO
x
emissions (6). Immediately surrounding the line, increases in either NO
x
or
hydrocarbon emissions will result in an increase in O
3
concentrations. [Adapted from
Jacob (7).]
concentrations. For example, in China, NO
x
emissions are projected to triple be-
tween 1990 and 2020 (11).
Tropospheric O
3
concentrations elevated above natural background levels were
initially identified in urban areas. Today it is recognized that O
3
is a regional rather
than an urban pollution problem, and concerns about international transboundary
and intercontinental transport are increasing. In fact, because of the nonlinear
NO
x
/hydrocarbon chemistry,O
3
concentrations are frequently higherdownwind of
citiesthantheyarein theheartof anurban center,makingthem aparticularproblem
for agricultural production. The increasing dependence that industrialized society
has placed on fossil fuels has resulted in increasing emissions of O
3
precursors
and pollution in “metro-agro-plexe” regions in which intense urban-industrial and
agricultural activities cluster together in a single large network of lands affected
by human activity (12).
27 Sep 2001 16:34 AR AR143-09-MAU.tex AR143-09-MAU.SGM ARv2(2001/05/10) P1: GSR
OZONE IMPACTS ON AGRICULTURE 243
2.3. Mechanisms by Which O
3
Damages Plant Tissue
Uptake of O
3
by plants is a complex process involving micrometeorology that
brings O
3
into the plantcanopy. Onceinthecanopy,O
3
can be absorbedbysurfaces
(stems,leaves,andsoil)andintotissues,primarilyintoleavesviathestomata(small
openings in the bottom of the leaf surface whose aperture can be controlled by the
plant). In general, stomata open in response to light and increasing temperature
and close in response to decreasing humidity, water stress, and increased CO
2
or
air pollutants, such as O
3
(1, 13). To modify or degrade cellular function, O
3
must
diffuse in the gas phase from the atmosphere surrounding the leaves, through the
stomata,becomedissolvedinwatercoatingthe cellwalls, andthen enterthecells of
theleaf(1).UptakeofO
3
byleavesiscontrolledprimarily bystomatal conductance,
which varies as a function of stomatal aperture. Uptake of O
3
by plant cuticles was
found to be a negligible fraction of uptake by plants with open stomata (14).
There is a general pattern of stomatal opening in the morning due to the presence
of sunlight and a closing in the evening, with possible midday stomatal closure
occurringduringperiodsof hightemperature anddrought(15).AbsorptionofO
3
by
leaves is a function of both stomatal conductance and ambient O
3
concentrations.
O
3
absorption can be estimated from models of stomatal conductance and O
3
concentrations.
Plants are able to protect themselves from permanent injury due to O
3
expo-
sure either through thick cuticles, the closure of stomata, or detoxification of O
3
near or within sensitive tissue. These protection devices come at a cost: either a
reduction in photosynthesis, in the case of stomatal closure, or in carbohydrate
used to produce detoxification systems (1,16). For detoxification to occur, it ap-
pears that the plant produces an antioxidant that reacts with O
3
, thus protecting the
tissue from damage (17). O
3
that has not been destroyed reacts at the biochemical
level to impair the functioning of various cellular processes (18). Black et al. (19)
reviews several studies that demonstrate direct effects of O
3
on various reproduc-
tive processes, including pollen germination and tube growth, fertilization, and
the abscission or abortion of flowers, pods, and individual ovules or seeds (19).
Physiological effects of O
3
uptake are manifest by (a) reduced net photosynthe-
sis, (b) increased senescence, and (c) damage to reproductive processes (1, 19).
Thus O
3
exposure will have an impact on both plant growth and crop yields. The
exact response of a given specimen will depend on its ability to compensate for
O
3
injury. Dose-response relationships thus vary by plant species, crop cultivar,
developmental stage, and externalenvironmental factors,suchaswater availability
and temperature, which influence the opening and closing of stomata.
Because of the expense involved in conducting long-term growth studies to
determine O
3
effects on plants, only a small proportion of the total number of
commercial crop cultivars have been examined. However, an enormous variabil-
ity in O
3
sensitivity has been found. Currently, standards to protect crops from
exposure to O
3
do not account for the physiological aspects of the effects O
3
has
on plants but rather are based on either peak O
3
concentrations (United States) or
cumulative exposure to O
3
(Europe). Recent research has focused on establishing
27 Sep 2001 16:34 AR AR143-09-MAU.tex AR143-09-MAU.SGM ARv2(2001/05/10) P1: GSR
244 MAUZERALL
WANG
the parameters that control the intake of O
3
into plants so as to develop a stan-
dard that is physiologically based rather than an empirical fit to data collected in
exposure-response experiments.
3. REVIEW OF CROP-LOSS ASSESSMENT STUDIES
AND REGULATORY POLICIES
An evaluation of the impacts of O
3
on crop yields on a local, regional, or national
scale requires three types of information: (a) knowledge of crop distributions
and yields within the region under study; (b) an air-quality database outside of
urban areas from which estimates of crop exposure to O
3
can be made; and (c)
an air-pollutant–dose/crop-response function that relates crop yield of specific
cultivars to O
3
exposure (21). In most countries, crop distributions and yields are
the best known of the three needed parameters. In the United States and Europe,
O
3
monitoring networks exist; however, almost no ambient O
3
data exists outside
of urban areas in developing countries. Large-scale studies (described below) have
been conducted in the United States and Europe to establish O
3
-exposure/crop-
response relationships for crop cultivars grown in these regions. Tables 1 and 2
provide an overview of the experimental studies conducted in the past decade on
yield response to O
3
exposure as an extension of the review conducted by Heck
(22).
3.1. United States
In the United States, the Clean Air Act mandates the protection of human health
and welfare from the effects of exposure to tropospheric O
3
through the setting of
primary and secondary National Ambient Air Quality Standards (NAAQS). Public
health is protected by primary standards. Ecological resources, including crops,
are part of public welfare and are protected by secondary standards. In the United
States to date, the primary and secondary standards for O
3
have been set equal to
each other. In 1997, a new EPA regulation that increased the stringency of both
the primary and secondary O
3
standards from 0.12 parts per million (ppm) of O
3
measured over 1 hour, not to be exceeded more than three times in 3 years, to
0.08 ppm measured over 8 hours, with the average fourth highest concentration
over a 3-year period determining whether a location is out of compliance. This
standard was contested in court, and in February 2001, the US Supreme Court
upheld the way the federal government sets clean-air standards. The NAAQS are
required to be reviewed every five years and were last reviewed in 1996 (1). Hence,
with the upcoming review, the US EPA has the opportunity to consider a secondary
standard specifically designed to protect vegetation.
A recent analysis of O
3
data for the contiguous United States for the 1980–
1998 period shows that the average number of summer days per year in which O
3
concentrationsexceeded 0.08ppmis intherange of8–24in thenortheastand Texas
27 Sep 2001 16:34 AR AR143-09-MAU.tex AR143-09-MAU.SGM ARv2(2001/05/10) P1: GSR
OZONE IMPACTS ON AGRICULTURE 245
and 12–73 in Southern California (23). The probability of violation increases with
temperature and exceeds 20% in the northeast for daily maximum temperatures
above 305 K (23). It appears that violations are considerably more widespread for
the new standard than for the old standard. The pollution-control policies enacted
to bring areas into compliance with the old standard have been at least as effective
in lowering daily maximum 8-hour average O
3
concentrations as they have been
in lowering daily maximum 1-hour average O
3
concentrations (23).
In 1979, during a review of the NAAQS for O
3
, the US EPA recognized the
importance of determining O
3
-dose/plant-response relationships for economically
important crop species. They chose to use crop yield as the metric of response
because of its usefulness in setting a secondary standard to protect public welfare
(21). As a result, in 1980, the EPA initiated the National Crop Loss Assessment
Network (NCLAN), which was the first large-scale and systematic study of the
impact of O
3
on crops in the world.
The primary objectives of the NCLAN study were to (a) define the O
3
exposure/
crop-yield response relationship for the major agricultural crops; (b) assess the
national economic consequences resulting from the reduction in agricultural yield;
and (c) increase understandingofthecause/effect relationshipthatdeterminescrop
response to pollutant exposure (21). At the start of the NCLAN study, Heck et al.
estimated thatyieldlosses due toO
3
exposureaccountedfor 2%–4% ofthetotalUS
cropproduction(3).TheNCLANstudyfindingsarereviewedby Heck(22). Table 1
includes a summary of smaller studies conducted in the United States following
NCLAN and their findings. These studies corroborate variable yet substantial
reductions in yield in a variety of crops as a result of elevated O
3
concentrations.
For example, a 40% reduction in soybean yield was found for soybeans exposed
to 70–90 ppb of O
3
, but no effect was seen on broccoli at 63 ppb of O
3
.
The NCLAN program utilized monitoring of ambient O
3
concentrations by
an extensive national network operated by the EPA as part of the Storage and
Retrieval of Aerometric Data system. A statistical process, called kriging, was
used to interpolate the O
3
concentrations observed at the monitoring stations to the
ambient 7-h mean O
3
concentrations at the field sites during the 5-month growing
season (May-September) (24).
During the NCLAN program, plants were grown in the field using open-top
chambers in which the O
3
concentration to which the plants were exposed could be
controlled and monitored. Early in the program, O
3
was added in fixed increments
to the chambers for 7 h/day in excess of the ambient O
3
concentrations. Later the
program was revised so that O
3
was added for 12 h/day.
Heck et al. (25) compared four O
3
averaging times for their efficacy in fitting
the O
3
-dose/crop-yield–response data. Two seasonal means [1-h/day and 7-h/day
(0900–1600 h) mean O
3
concentrations], and two peak concentrations (maximum
daily 1-h and 7-h mean O
3
concentrations occurring during the growing season)
were used. Only the seasonal mean O
3
statistics were found to be useful for es-
timating yield reductions of a given crop from data obtained from different sites
or different years, whereas peak statistics could not be used for other locations or
27 Sep 2001 16:34 AR AR143-09-MAU.tex AR143-09-MAU.SGM ARv2(2001/05/10) P1: GSR
246 MAUZERALL
WANG
TABLE 1 Field experiments on O
3
impacts on agricultural crops in developed countries
a
Location Crop Method Response Reference
US—Southern Broccoli (Brassica oleracea L.), OTC with CF (M12 = 14 ppb), Yields of lettuce and broccoli 62
California lettuce (Lacuca dativa L.), NF (36 ppb), and 1.5 times NF were not affected by O
3
+;
and onion (Allium cepa L.) (63 ppb); exposed from 4 weeks only one cultivar of onions
after germination till harvest had 5% yield loss at AA
US—Maryland Soybean (Glycine max L. Merr. OTC with CF (M7 = 23 ppb), NF Yield reduced by 15% in NF, and 63
cv. Clark) (40 ppb) and O
3
++ (66 ppb) 26% in O
3
++ relative to CF
US—San Joaquin Cotton (Gossypium hirsutum L. cv. OTC with CF (M7 = 7–19 ppb) and Yield losses ranged from 0% to 20% 64
Valley, CA SJ2) NF (23–53 ppb), and AA (31–56 ppb) in NF compared with CF across all
in open plots experimental sites and years and in
proportion to O
3
concentrations
US—North Carolina Tomato (Lycopersicon esculentum CSTR chambers with 0 ppb O
3
and Final yield reduced by 31% at O
3
++ 65
L. cv. Tiny Tim) O
3
++
(daily mean = 80 pph)
US—Raleigh, NC Soybean (Glycine max L. Merr. OTC with CF (M12 = 21–25 ppb) Seed yield reduced by 41% at O
3
++ 66
cv. Essex) and O
3
++ of 70–92 ppb relative to CF
UK—Northumberland Winter wheat (Triticum aestivum Simple unclosed fumigation system with 13% yield reduction of winter wheat 67, 68
L. cv. Riband), winter oilseed treatments of AA with daily mean of and 14% yield reduction of winter
rape (Brassica napus ssp. 30 ppb and O
3
++ at 80 ppb oilseed rape at O
3
++ relative to AA
Oleifera var. biennis L.), fivee cultivars
Europe Spring wheat (Triticum aestivum OTC with NF (M12 = 17–44 ppb) and O
3
++ did not cause significant yield 48,69,70
(ESPACE-wheat sites) L. cv. Minaret) O
3
++ (32–73 ppb) reduction for Minaret relative to NF
Netherlands Bean (Phaseolus vulgaris cv. Lit) Use of EDU Use of EDU enhanced dry pod 71
yield by 20% on average
Netherlands Bean (Phaseolus vulgaris cv. Pros) OTC with various treatments (M9 = Yield loss is linearly related to AOT40; 72
0–75 ppb or AOT 40 = 0–17700 ppbh) 5% yield loss corresponds to AOT40
of 1600 ppbh, and 10% loss to
1700 ppbh
27 Sep 2001 16:34 AR AR143-09-MAU.tex AR143-09-MAU.SGM ARv2(2001/05/10) P1: GSR
OZONE IMPACTS ON AGRICULTURE 247
UK—Sutton Potato (Solanum tuverosum cv. OTC with AA (M8 = 21 ppb) and O
3
++ did not affect tuber yields but 73
Bonington Bintje) O
3
++ (50 ppb) reduced above-ground dry weight
by 8.4% compared with AA
UK—Sutton Bean (Phaseolus vulgaris cv. Lit) OTC with CF (M7 = 8 ppb), NF, 10% yield reduction in England at 74
Bonington; or O
3
++ 38 ppb, and 11% in France at
France—Pau 39 ppb, compared with CF
Italy—central Peach tree (Prunus persica L. OTC with CF (AOT60 = 4 ppbh), No significant impact on fruit yield 75
cv. Batsch) AA (5398 ppbh), and O
3
++ at AA compared with CF, but
negative impact on plant growth
and fruit quality found
Italy—north Bean (Phaseolus vulgaris cv. OTC with CF (7-h daily mean = 18%–31% seed yield loss in NF 76
Taylor's horticulture) 10 ppb) and NF (45–50 ppb) relative to CF
Sweden—southwest Spring barley (Hordeum vulgare OTC with CF (M7 = 6 ppb), NF No yield reduction at up to 45 ppb 77
L. cv. Lina) (29ppb), or NF with O
3
++ (45 ppb) of M7 compared with CF
Spain—eastern Watermelon [Citrullus lanatus OTC with CF (10-h daily mean = Fruit yield loss was 19% in 1988 78, 79
(Thunb.) Matsum & Nakai 8 = 11 ppb in 1988 and 8–14 and 39% in 1989
cv. Toro] in 1989) and NF (21–45 ppb in 1988
and 36–61 ppb in 1989)
Japan Rice (Oryza sativa L. cvs. Field chamber system with O
3
Yield loss at 50 ppb ranges from 3% 80
Koshi-hikari and Nippon-bare) concentration at 0.5, 1.0, 1.5, 2.0, to 10% relative to background
or 2.75 times AA (i.e. M7 = level of 20 ppb; results comparable
15–97 ppb) to rice studies in the US (81)
a
AA, ambient air; AOT40 (AOT60), accumulated exposure of hourly concentrations (for daylight hours during which the mean global radiation was 50 W/m
2
or higher) above 40 (60) ppb
over the growing season; CF, charcoal-filtered air; CSTR, continuously stirred tank reactor; EDU, N-(2-(2-oxo-1-imidazolidinyl) ethyl)-N
phenylurea, an antioxidant; ESPACE-wheat,
European Stress Physiology and Climate Experiment Project 1, on wheat; M7, seasonal mean of all hours from 0900 to 1600 h; M12, seasonal mean of all hours from 0800 to 2000 h;
NF, nonfiltered air where O
3
concentration in theOTC is nearambient level;OTC, open-top chambers; O
3
+,O
3
concentrations above the CF levels; O
3
++,O
3
concentrations above the AA levels.
27 Sep 2001 16:34 AR AR143-09-MAU.tex AR143-09-MAU.SGM ARv2(2001/05/10) P1: GSR
248 MAUZERALL
WANG
time periods (25). A study evaluating 613 numerical exposure-response indices
found thatindicesthatweight peak concentrations using a sigmoid(ordiscrete0-1)
weighting scheme and accumulate exceedances over a threshold concentration of
60 ppb give a better fit to yield data in the United States than do indices that use
mean concentrations over a growing season or peak values alone (26, 27). Also,
preferential weight given to O
3
concentrations during the daytime (0800–2000 h),
when leaf stomata are open and gas exchange is maximized, was found to be im-
portant (28). In addition, indices that positively weighted O
3
exposure between
plant flowering and maturity resulted in additional improvement but were deemed
too complex to be used in an air-quality standard.
The indices described above are empirical and do not directly account for the
physiological mechanism by which O
3
doses are delivered or physiological effects
incurred. More recent work has begun to examine the physiological mechanisms
by which plants are affected by O
3
and to propose standards that take O
3
flux
as it relates to plant response into account. An air-quality standard to protect
vegetation that is biologically relevant, and hence includes factors that influence
flux (concentration and conductance) and effective absorbed dose (rate of uptake
minus rate of defensive neutralization or repair), has been advocated recently in
the United States (29) because damage to vegetation is more likely correlated with
a dose-based index than an exposure-based index. Research is needed to refine
various techniques for determining fluxes into plants and for accumulation of
flux data in the standard setting process. Further research is also needed on plant
defensive responses, canopy-scale conductances, and plant response, including
effects on photosynthesis (29). As is discussed in the next section, some of this
research is under way in Europe.
As part of the standard setting process, EPA reviews all pertinent literature ev-
ery 5 years (most recently in 1996) and publishes a summary in the Air Quality
Criteria for Ozone and Related Photochemical Oxidants document (1). An index
that accumulates all hourly O
3
concentrations during the growing season and gives
greater weight to higher concentrations has major advantages over mean and peak
indices, as judged by better statistical fits to the data (30). Unfortunately, to date,
the scientific findings reviewed in the EPA’s criteria document have not been suffi-
ciently influential to result in setting a secondary standard that is more protective of
crops and natural vegetation than the primary, peak-concentration–based standard
used today.
3.2. Europe
AlthoughEuropeanresearchontheimpactof O
3
oncropsstartedlaterthanresearch
in the United States, it forged ahead during the 1990s and has been more influential
in the standard-setting process than it has been in the United States. The European
approach has centered around the concept of a “critical level” (CL), which is
based on a cumulative exposure above a cutoff concentration below which only
an acceptable level of harm is incurred.
27 Sep 2001 16:34 AR AR143-09-MAU.tex AR143-09-MAU.SGM ARv2(2001/05/10) P1: GSR
OZONE IMPACTS ON AGRICULTURE 249
During the late 1980s and 1990s, the potential impact of ground-level O
3
on
plants and human health came into focus in Europe. Between 1987 and 1991 the
basic NCLAN methodology was used in nine countries in Europe on a variety of
crops, including wheat, barley, beans, and pasture, during the European Open Top
Chamber (EOTC) program. Like the NCLAN studies, the experiments involved
the exposure of a number of crops grown in open-top containers to a range of
O
3
concentrations over the growing season. Experimental results indicated yield
reductionswere highlycorrelatedwithcumulativeexposuretoO
3
aboveathreshold
of 30–40 ppb during daylight hours (31). A cumulative indicator of O
3
exposure
above a 40-ppb threshold (AOT40) was therefore established (for a full description
of this standard, see Section 4).
The AOT40 associated with a5%yieldreductionofwheatwas determined to be
the most appropriate value for a CL for O
3
(32). Based on this criteria, the AOT40
wassetat3000 ppbh accumulated duringdaylighthoursfor the three months (May,
June, and July) when clear sky radiation is above 50 W/m2 (32–34). This is the
timeperiod duringwhichspringplantedcropsexperiencemaximumgrowthandare
therefore likely most sensitive to O
3
. Wheat was selected for the derivation of the
CL because available datawasmorecomprehensiveandbecausethecropappeared
to be relatively sensitive to O
3
. However, it is known that there are large variations
in response to O
3
between species and that environmental conditions alter plant
uptake and response (32). Currently, the AOT40 parameter exceeds 3000 ppbh
in most of the European Union with the exception of northern Scandinavia and
the UK (32a). This implies that most of Europe could be losing at least 5% of its
annual wheat yield.
The AOT40 concept forms the basis of the “level 1” analysis of the potential
risk of O
3
on plants in Europe. The level 1 approach does not consider biological
or climatic factors that will influence the O
3
dose and vegetative response. To
accurately estimate the yield loss caused by O
3
, it is believed that a “level 2”
approach is needed. An exceedance of the current level 1 CL does not necessarily
mean that there will be damage to vegetation, but only that the risk of damage
existsforsensitivespeciesand conditions. Likewise, the degreeto which the level 1
standard is exceeded is insufficient to determine the extent of damage to vegetation
or the economic impact of O
3
damage. This is because exposure to high O
3
levels
is correlated with high temperatures and humidity. During hot, dry conditions,
plants usually close their stomata, which helps protect them from O
3
exposure.
Also, plant sensitivity varies as a function of plant growth stage at the time of
the excess O
3
. The level 2 approach would include consideration of parameters
that influence the flux of O
3
into the plant and which are critical in converting O
3
exposure to O
3
dose (35). Parameters important in determining O
3
dose include
soil moisture conditions, vapor pressure deficit (VPD), and temperature.
A recent study on wheat in Sweden found that when AOT40 is compared with
an alternative flux-based standard (CFO
3
), which in addition to O
3
concentration
accounts for VPD, light, and temperature, CFO
3
provided a more consistent rela-
tionship between relativeyield loss and O
3
exposure than did AOT40 (36). CFO
3
is
27 Sep 2001 16:34 AR AR143-09-MAU.tex AR143-09-MAU.SGM ARv2(2001/05/10) P1: GSR
250 MAUZERALL
WANG
the cumulative flux of O
3
(uptake) to the leaves. In northern Europe, although the
O
3
concentrations are lower than in southern and central Europe, the potential for
O
3
uptake at a given O
3
concentration is higher because of higher levels of humid-
ity (36). Thus, the net O
3
uptake may vary according to a different geographical
pattern than indicated by AOT40. A standard that was able to weight O
3
concen-
tration based on environmental factors of importance in O
3
uptake would be an
improvement over the current methods of evaluating damaging O
3
concentrations.
Recent findings by the UN/ECE ICP–Vegetation Program (the United Nations
Economic Commission for Europe International Cooperative Program on effects
of air pollution and other stresses on crops and nonwood plants) further the objec-
tive of implementing a level 2 standard. The UN/ECE ICP–Vegetation Program
coordinates ambient air experiments over large areas of Europe to investigate the
effectsofambientO
3
pollution on crops. In 1995 and 1996, O
3
injury was observed
at sites throughout Europe from the United Kingdom to Russia and from Sweden
to Italy (37). Based on the 1995 data, two short-term CLs that incorporate O
3
dose
and air-saturation VPD were derived. They are (a) an AOT40 of 200 ppbh over
5 days when mean VPD (0930–1630 h) is below 1.5 kPa and (b) and AOT40 of
500 ppbh over 5 days when mean VPD (0930–1630 h) is above 1.5 kPa (37). Thus
the ICP vegetation experiments have shown that O
3
injury can occur over much
of Europe and that plants are most at risk in conditions of high atmospheric hu-
midity. The AOT40 CLs, modified to include VPD criteria, are a first step toward
identifying a feasible standard that takes flux, and hence O
3
dose to the plant, into
account.
The implementation of an effects-based international or national control strat-
egy aimed at reducing the impacts of O
3
on vegetation and associated air pollutants
requires an integrated approach. The UK Photochemical Oxidant Review Group
concluded that all the following are needed: (a) a definition of the appropriate CLs;
(b) maps showing geographically resolved CLs, assigned on the basis of specific
vegetation types, (map 1); (c) maps showing geographically resolved O
3
exposures
(map2); (d)mapsbasedonoverlaysof maps1and2showinggeographicallywhere
and to what extent CLs are exceeded; (e) maps based on current or future emission
scenarios showing modeled O
3
exposures (map 3); and (f) maps based on overlays
of maps 1 and 3 showing where O
3
CLs are predicted to be exceeded in the future
(32). In addition, maps of such key climatological parameters as temperature and
humidity are necessary to improve the CL concept so that it becomes a measure of
plant dose rather than exposure. Thus, a truly interdisciplinary approach is needed,
with a dialog between members of the effects, measurement, mapping, modeling,
and policy-making communities. Such efforts are under way in Europe.
The European Long Range Transboundary Air Pollution Convention (LRTAP)
was the first internationally legally binding instrument to deal with problems of
reactive air pollution on a broad regional basis. It was signed in 1979 and entered
into force in 1983. It has greatly contributed to the development of international
environmental law and created the essential framework for controlling and reduc-
ing the damage that transboundary air pollution can cause to human health and
27 Sep 2001 16:34 AR AR143-09-MAU.tex AR143-09-MAU.SGM ARv2(2001/05/10) P1: GSR
OZONE IMPACTS ON AGRICULTURE 251
the environment in Europe. LRTAP was initially written to control the emission of
sulfur dioxide (SO
2
) emissions. A number of protocols followed ratification of the
Convention, including the 1988 Protocol on the Control of Emissions of Nitrogen
Oxides (NO
x
) and their Transboundary Fluxes, and the 1999 Gothenburg Protocol
to Abate Acidification, Eutrophication, and Ground-level Ozone (38). The NO
x
protocol initially required the freezing of emissions of nitrogen oxides at 1987
levels. This was a crucial first step to controlling O
3
concentrations in Europe. The
1999 Gothenburg Protocol sets emission ceilings for 2010 for four pollutants: sul-
fur, NO
x
, volatile organic compounds (VOCs), and ammonia. These ceilings were
negotiated on the basis of scientific assessments of pollution effects and abate-
ment options. Parties whose emissions have more severe environmental or health
impacts and whose emissions are relatively cheap to reduce will have to make the
biggest cuts. Once the Gothenburg Protocol is fully implemented, Europe’s NO
x
emissions will be cut by 41% and its VOC emissions by 40%, compared with
1990. In addition, the European Union is involved in negotiations that are likely
to reduce NO
x
emissions below levels agreed on in LRTAP (M. Amman, personal
communication). These substantial reductions in emissions should help to reduce
O
3
levels in Europe and will likely bring much of Europe closer to the current
growing-season level 1 AOT40 CL of 3000 ppbh O
3
. Further research is needed
to determine whether these reductions in NO
x
emissions will be sufficient to bring
O
3
below the level 2 standards that are currently beginning to be considered.
3.3. Asia
Although O
3
is the most important air pollutant affecting crop production in North
America and Europe, its impact in developing countries, where the economic and
social consequences of loss of production may be critical, is uncertain. A recent
review by Ashmore & Marshall (39) assesses the current and future significance of
O
3
impactson agricultureinAsia,Africa,and LatinAmerica(39).Outsideofglobal
chemicaltracermodel results,little informationisavailableonO
3
concentrationsin
rural parts of these continents, but because of expectations of increased emissions
of O
3
precursors, it is likely that O
3
concentrations will become sufficiently high
in the future to have increasingly adverse effects on sensitive species (39).
As emissions from fossil-fuel combustion have increased in Asia, Japanese
scientists have become interested in the impact of O
3
and SO
2
deposition on agri-
culture and forest ecosystems. Some small studies have been conducted in India
and Pakistan, and a study conducted in the United Kingdom simulated Chinese
agriculture. Studies conducted on the adverse effects of O
3
on crops in developed
countries (including Japan) are listed in Table 1. Table 2 summarizes the studies
conducted in developing countries to date. The rice cultivars used in a Pakistani
study appear to have a much greater sensitivity to O
3
than other cultivars (40).
Similar variability among cultivars of other crops is possible, making it clear that
further studies of cultivars used in developing countries are critical. It is possible
that given local O
3
concentrations and crop strains used in developing countries,
27 Sep 2001 16:34 AR AR143-09-MAU.tex AR143-09-MAU.SGM ARv2(2001/05/10) P1: GSR
252 MAUZERALL
WANG
TABLE 2 Field experiments on O
3
effects on agricultural crops in developing countries
a
Location Crop Method Response Reference
Pakistan—Punjab Winter wheat (Triticum OTC with CF (6-h daily mean = 5 ppb) 33%–47% yield reduction in wheat 82–84
aestivum cvs. Pak-81 and NF (25–45 ppb for wheat and and 37%–51% in rice in NF,
and Chakwal-86) 10–54 ppb for rice) compared with CF
Rice (Oryza sativa cvs.
Basmati-385 and IRRI-6)
Indian—Punjab Potato (Solanum tuberosum Dusting with activated charcoal Plants treated with EDU did not develop visible 85
cv. Kufri jyoti) or addition of EDU injury, whereas untreated plants did
Egypt—Abbis and Radish (Raphanus sativus), Application of EDU In radishes, root and shoot dry weight decreased, 86
Alexandria turnip (Brassica rapa) respectively, by 30% and 17% in Abbis and
24% and 18% in Alexandria; in turnip, they
decreased by 17% and 11% in Abbis and
showed no significant effect in Alexandria
Mexico—Montecillos Bean (Phaseolus vulgaris cvs. Application of EDU 4.5% yield reduction in untreated plants 39
Canario 107 and Pinto III) of Canario 107; 40.7% yield reduction
in untreated plants of Pinto III
China—Chongqing 11 local crop species: eggplant, Seed sown in controlled chambers at Typical foliar injury restricted to rice, eggplant, 87
cauliflower, Chinese leaves, Newcastle University, UK; OTC with tomato, and pepper; all species but wheat, maize,
tomato, lettuce, wheat, maize, CF and air with O
3
concentration and radish, and zucchini found to be O
3
sensitive in
radish, zucchini, pepper, rice pattern similar to Chongqing (hourly terms of growth; only eggplant and pepper (cv. Yu2)
mean of 15–75 ppb; 7-h daily mean = showed significant O
3
-induced reductions in
59 ppb) over a 28-day period root-shoot partitioning; rice appeared to be more
sensitive in terms of growth and visible injury
than cultivars grown in Pakistan, Japan, and US
a
CO
2
+, enhanced CO
2
concentration above ambient levels. Other abbreviations as in Table 1.
27 Sep 2001 16:34 AR AR143-09-MAU.tex AR143-09-MAU.SGM ARv2(2001/05/10) P1: GSR
OZONE IMPACTS ON AGRICULTURE 253
O
3
may cause a larger reduction in crop yield in developing than in developed
countries. No Asian or developing country government has organized a large-
scale investigation of the effect of O
3
on crops, such as has been conducted in the
United States and Europe. Investigations have partly made use of the experimental
results of the US NCLAN study for modeling work or have examined specific
crop cultivars to establish a dose-response relationship for a local crop strain. Re-
cent work in Japan has attempted to improve and generalize the dose-response
functions obtained by the NCLAN experimental results by utilizing crop-growth
models (41). These models attempt to parameterize physiological functions at the
individual plant and leaf level in order to explain the variation in O
3
-dose/yield-
reduction–responserelationships.There is,however,anincreasing interestin better
understanding the impacts of O
3
on agriculture in Asia.
A recent study on the impacts of O
3
on agriculture in China utilized a global
three-dimensional chemical tracer model to calculate surface O
3
concentrations
and then applied the NCLAN and EOTC studies dose-response data to Chinese
crops. It found that reductions in crop yields in 1990 in China were less than 3%
for most grain crops (except soybean) but that predictions for 2020 suggested that
crop losses for soybeans and spring wheat might reach 20% and 30%, respectively
(42). Another study that made measurements of O
3
concentrations at four loca-
tions in China and then used a regional model to predict O
3
concentrations over
the rest of the country also concluded that impacts on Chinese wheat were likely
to become significant in the future (43). China’s concerns about food security may
make greenhouse gas mitigation strategies that reduce surface O
3
concentrations
more attractive than those that do not. Three-dimensional photochemical model-
ing indicates that the outflow of emissions from China results in increases in O
3
concentrations in the boundary layer (0–2.1 km) over Japan (44). It is expected that
as fossil-fuel combustion increases in China, the outflow from continental Asia
will have an increasingly large effect on O
3
concentrations above Japan and the
Pacific Ocean, and potentially the United States as well (45,46).
4. SYNERGISTIC EFFECTS OF O
3
AND OTHER
ENVIRONMENTAL FACTORS ON CROPS
A crop-loss assessment effort must understand the interrelationship between O
3
,
other air pollutants, and biological and environmental factors (22). Heck (22) re-
views observed interactive effects. Table 3 summarizes similar studies that were
carried out during the 1990s, as an update of Heck (22). Most of this research was
conducted as individual studies, except for the European Stress Physiology and
Climate Experiment Project 1, on wheat (ESPACE-wheat). The ESPACE-wheat
project was initiated in 1994 to investigate the response of agroecosystems to ele-
vated atmospheric carbon dioxide concentrations, climatic variation, and physio-
logical stresses (such as O
3
or water/nutrient shortage). From 1994–1996, a total of
25 open-top chambers experiments were carried out in nine European countries,
and a large database was created to provide data to improve, extend, and vali-
date mechanistic wheat-growth simulation models (47). The program employed a
27 Sep 2001 16:34 AR AR143-09-MAU.tex AR143-09-MAU.SGM ARv2(2001/05/10) P1: GSR
254 MAUZERALL
WANG
TABLE 3 Field experiments on the interactive effects of O
3
and other environmental factors on
crops
Location Crop Effect Reference
O
3
and CO
2
US—North Tomato (Lycopersicon CO
2
+ significantly enhanced growth and 65
Carolina esculentum L. cv. Tiny yield whereas O
3
+ suppressed vegetative
Tim) growth and reduced fruit yield; CO
2
+
ameliorated some of the detrimental
effects of O
3
+ on vegetative growth and
yield of mature fruit
US—North Soybean (Glycine max O
3
+ (CO
2
) stressed plants and suppressed 88–90
Carolina L. Merr. cv. Essex) (increased) growth and yield; CO
2
-induced
stimulation was greater for plants stressed
by O
3
+ than for nonstressed plants
US—Massachusetts Soybean (Glycine max O
3
+ reduced seed yields by 41% at ambient 66
L. Merr. cv. Essex) CO
2
but caused no reduction occurred at CO
2
+
US—Maryland Winter wheat (Triticum No significant interactive effects were observed 91, 92
aestivum L. cvs. for either wheat or corn; averaged
Massey and Saluda) over two CO
2
treatments, O
3
caused 15%–11%
and corn (Zea mays L. yield loss for wheat and 9% for corn at O
3
++
cv. Pioneer 3714) relative to CF; CO
2
+ (150 ppm above AA)
increases wheat (C
3
crop) yield by 15%–26%
and corn (C
4
crop) yield by 4%
US—Maryland Soybean (Glycine max Leaf photosynthesis rates, plant biomass, pods 63
L. Merr. cv. Clark) per plant, and grain yields were stimulated
by CO
2
+ in the presence of O
3
++; the negative
impact of ambient O
3
on growth and productivity
were largely counteracted by CO
2
+; the effect of
CO
2
+ in combination with O
3
on stomatal
conductance appeared to be additive
Europe Spring wheat (Triticum No effect on phenological development, rate 69, 70,
(ESPACE-wheat aestivum L. cv. of leaf emergence, final leaf number, and 93–98
study) Minaret) duration of grain filling by CO
2
+ or O
3
+;few
interactive effects of CO
2
+ and O
3
+ on tillering
and LAI; CO
2
+ ameliorated the negative effect of
O
3
+ on leaf area duration, senescence of the flag
leaves during grain filling and yield loss;
CO
2
+ increased grain yield by up to 33%,
a 7-h daily mean O
3
of 60 ppb under ambient
CO
2
level did not significantly affect grain yield;
CO
2
+ does not protect against substantial
O
3
+-induced yield losses resulting from its direct
deleterious impact on reproductive processes
UK—Sutton Potato (Solanum O
3
+ was insufficient to reduce tuber yields compared 73
Bonington tuverosum cv. with AA; CO
2
+ enhanced crop growth during early
Bintje stages of the season but had no effect
on yield; there was no significant effect between
CO
2
+ and O
3
+ for any of the growth and
yield variables examined
UK Spring wheat (Triticum CO
2
+ fully protected against the detrimental 99
aestivum L. cv. effects of O
3
+ on biomass but not yield
Wembley)
27 Sep 2001 16:34 AR AR143-09-MAU.tex AR143-09-MAU.SGM ARv2(2001/05/10) P1: GSR
OZONE IMPACTS ON AGRICULTURE 255
TABLE 3 (Continued)
Location Crop Effect Reference
O
3
and water stress
US—mid–Ohio Common milkweed, In 1988, O
3
levels were high but injury 100
River Valley white ash, tulip tree, to vegetation was very low because of
wild grape, black drought stress; however, in 1989, O
3
levels
cherry, etc. were much lower, yet optimum growing
condition resulted in greater foliar injury
US (part of Soybean (Glycine max Compared with well-watered regime, soil-moisture 101
NCLAN) L. Merr.) stress reduced O
3
-induced yield loss;
yield loss induced by soil-moisture stress is
the greatest when O
3
levelislow
UK Kenaf (Hibiscus O
3
damage was alleviated by mild water 102
cannabinus L.) stress but enhanced by severe
water stress
O
3
with NO
x
and/or SO
2
US (part of Soybean (Glycine max No interactions between O
3
and SO
2
found 101
NCLAN) L. Merr.)
US Watermelon [Citrullus SO
2
enhanced phytotoxicity of O
3
to 103
lanatus (Thunb.) watermelon
Matsum & Nakai]
Germany Spring barley (Hordeum No consistent effect of any of O
3
/NO
x
and O
3
/SO
2
104
vulgare L. cvs. Arena combinations on any of the crops could be
and Alexis); spring detected across seasons and cultivars; O
3
/NO
x
wheat (Triticum and O
3
/SO
2
mixtures reduced yield loss to
(aestivum L. cvs. varying degrees; NO
x
and SO
2
seemed to act
Turbo and Star) antagonistically to O
3
with one exception
Switzerland Spring wheat (Triticum NO at low O
3
concentration induced effects on 105
aestivum L. cv. Albis) yield and physiological parameters similar to
those of increased O
3
concentrations; no
adverse effect of NO at higher O
3
concentrations
Pakistan Rice (Oryza sativa L.) O
3
(40–42 ppb for 8 h/day) is more phytotoxic 40
than NO
2
(21–23 ppb for 24 h/day) at the
concentrations used; no significant interactions
were found
O
3
,CO
2
and nitrogen (N)
US—Raleigh Cotton (Gossypium CO
2
+ generally stimulated growth and yield 106
hirsutum L.) whereas O
3
exposure suppressed growth
and yield; stimulation induced by CO
2
increased
as O
3
stress increased; these interactions occurred
for a range of soil N levels
Germany Spring wheat (Triticum CO
2
+ increased yield by 23% at 120 kg 107
aestivum L. cv. of N and 47% at 330 kg of N; Minaret
Minaret) was not effected by O
3
+
O
3
and NH
3
Netherlands Bean (Phaseolus Adverse effects of O
3
+ on biomass and 72
vulgaris cv. Pros) pod yield did not depend on
the NH
3
level
a
LAI, leaf area index; NCLAN, National Crop Loss Assessment Network. Other abbreviations as in Tables 1 and 2.
27 Sep 2001 16:34 AR AR143-09-MAU.tex AR143-09-MAU.SGM ARv2(2001/05/10) P1: GSR
256 MAUZERALL
WANG
standard protocol for experimental and modeling procedures. Environmental data,
i.e., air temperature, global radiation, humidity, and trace-gas concentrations, were
also collected and cover a considerable range of values (48).
A summary of the findings of the ESPACE-wheat program with particular
regard to the interactive effect between CO
2
and O
3
on responses of spring wheat
is summarized in Table 3. Most of the studies on the interactive effect of CO
2
and O
3
found that elevated CO
2
concentrations partially ameliorated the negative
effects of elevated O
3
concentrations. Table 3 also includes a summary of the
findings of studies focusing on the interactive effects of O
3
and water stress, O
3
with NO
x
and/or SO
2
,O
3
with CO
2
and nitrogen, and O
3
with ammonia (NH
3
).
Studies on O
3
and water stress found that soil-moisture stress reduced O
3
-induced
yield loss because plants close their stomata to conserve water. Synergistic effects
of O
3
with NO
x
,SO
2
, and NH
3
were not consistently detected across studies.
5. SUMMARY OF DIFFERENT EXPOSURE INDICES:
STRENGTHS AND WEAKNESSES
A variety of alternative statistical approaches have been examined to summarize
the exposure of plants to ambient air pollution. These approaches have become
increasingly sophisticated over time. Exposure indices weight exposure duration
and peak concentration in a variety of ways.
Index =
n
i=1
w
i
∗
f(C
O3
)
i
is the generic representation of the indices. C
O3
is the hourly mean O
3
concen-
tration, f(C
O3
) is a function of C
O3
, w
i
is a weighting scheme that relates ambient
concentrations to flux into the plant, and n is the number of hours over which O
3
concentrations are summed (1).
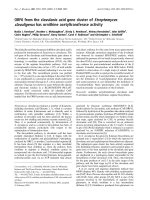
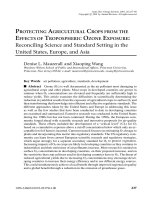
Figure 3 shows the weighting factors for AOT40, SUM06, and W126. AOT40
is defined as:
AOT40 =
n
i=1
[C
O3
− 40]
i
for C
O3
≥ 40 ppb, [AOT40 units: ppbh],
where C
O3
is the hourly O
3
concentration in parts per billion (ppb), i is the index,
and n is the number of hours with C
O3
> 40 ppb over the 3-month growing period
that has been set as the evaluation period for arable crops. AOT40 is currently used
to define CLs for O
3
to protect crops and natural vegetation, including forests in
Europe (see Section 3.2). SUM06 is defined as:
SUM06 =
n
i=1
[C
O3
]
i
for C
O3
≥ 60 ppb, [SUM06 units: ppbh],
where parameters are defined in the same way as they are for AOT40. The seasonal
SUM06 value is determined by summing hourly O
3
concentrations during three
consecutive months of the growing season (1). The precise three months to use is
27 Sep 2001 16:34 AR AR143-09-MAU.tex AR143-09-MAU.SGM ARv2(2001/05/10) P1: GSR
OZONE IMPACTS ON AGRICULTURE 257
Figure 3 Weighting factors for AOT40, SUM06, and W126.
leftambiguous.SUM06is favoredby researchersin theUnited Statesforprotection
of vegetation. The SUM06 index uses a higher threshold, but once the threshold is
reached, it accumulates exposures more rapidly than AOT40. W126 is defined as:
W126 =
n
i=1
C
i
∗
w
i
where w
i
= 1/(1 + 4403
∗
exp(−0.126
∗
C
i
)),
[W126 units: ppbh],
W126 is generally viewed as better representing observed yield loss but is more
difficult to implement as a regulatory standard.
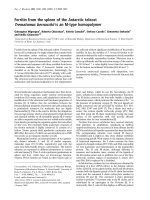
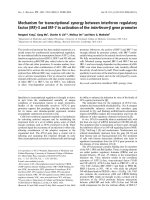
Figure 4 shows the relative yield loss calculated for wheat, rice, corn, and soy-
beans using the 7-hand12-hmeanindices,andthe cumulativeSUM06andAOT40
indices. These indices are all determined by an empirical fit of data primarily ob-
tained from the open-top container experiments conducted as part of the NCLAN
or EOTC programs. The empirical data fit is performed using Weibull or exponen-
tial functions that capture aspects of plant response to O
3
that linear functions do
not (49). The Weibull function is of the form: y = α exp[−(C
O3
/ω)
λ
] where y is
plant response, C
O3
is O
3
concentration, α is the theoretical yield at zero O
3
, ω is
a scale parameter on O
3
dose, and λ is a shape parameter (49a).
The indices described above are based on retrospective statistical analysis of
data from the US NCLAN and/or EOTC studies. However, by retrospectively
analyzing the NCLAN and EOTC data, Legge et al. (51) show that the cumulative
frequency of intermediate hourly O
3
concentrations is an important determinant of
crop-yield loss (51). This is because moderate O
3
levels frequently occur during
periods of the day when stomata are open and crop uptake is high. The NCLAN
analysisindicated thatthe cumulativefrequencyofoccurrenceofO
3
concentrations
between 50 and 87 ppb is the best predictor of crop response in the United States,
27 Sep 2001 16:34 AR AR143-09-MAU.tex AR143-09-MAU.SGM ARv2(2001/05/10) P1: GSR
258 MAUZERALL
WANG
Figure 4 Ozone exposure-response functions for specific crops. (a) Exposure-
response functions are based on 7-hour (9
AM to 4 PM) mean O
3
concentrations for
spring wheat, winter wheat, and rice, and 12-hour (8
AM to 8 PM) mean concentra-
tions for corn and soybean with an O
3
reference level of 25 ppb (20 ppb for 12-hour
mean) (49). (b) The SUM06 and AOT40 cumulative exposure-response functions use
an O
3
reference level of 0 ppmh. All exposure-response functions use a Weibull fit
of the data except AOT40 which uses a linear fit; an exponential function was used
for one of the rice exposure-response functions in (a). (32, 50; D. Olszyk, personal
communication). The US EPA Criteria Document (1) provides the Weibull function
coefficientsforindividual crop cultivars.Inthe plots shown here,weused an averageof
the coefficients of all studied cultivars of a particular species to represent the Weibull
coefficients for that species.
27 Sep 2001 16:34 AR AR143-09-MAU.tex AR143-09-MAU.SGM ARv2(2001/05/10) P1: GSR
OZONE IMPACTS ON AGRICULTURE 259
whereas results from EOTC indicate a range of 35–60 ppb as important in Europe.
This supports the idea that different thresholds for O
3
exposure in Europe (40 ppb)
and the United States (60 ppb) are appropriate for the standard-setting process.
As discussed in Section 3.1, current research in Europe and the United States
has begun to focus on developing control strategies based on flux-oriented dose-
response relationships (36, 52).
From the best evidence to date, it appears that exposure indices for setting
air-quality standards to protect vegetation should (a) accumulate hourly O
3
con-
centrations, (b) give preferential weight to daytime concentrations between 0800
and 2000 h, (c) give preferential weight to higher O
3
concentrations, and (d ) ac-
count forvariations inhumidity. There isatrade-offbetweenthemost scientifically
correct standard/evaluation tool and a standard that is manageable from a policy
perspective. However, the research and standard-setting currently under way in
Europe provides a useful template for consideration in the United States.
6. ECONOMIC ASSESSMENTS
The US Clean Air Act unambiguously bars consideration of emission control costs
from the process of setting air-quality standards (53). It does, however, permit
consideration of the costs of damages incurred by air pollution. Costs are also
considered when determining how states will meet air-quality standards. A variety
of economic assessments have been conducted to evaluate the economic impact
of O
3
on agriculture. Several reviews of US-based economic assessments have
been conducted (e.g. 1, 22,54–56). Table 4 summarizes additional studies that
were conducted but includes the 1989 study by Adams et al. (49) to represent
the US NCLAN study. These studies indicate that ambient O
3
concentrations are
imposing substantial economic costs on agriculture. For instance, Adams et al.
found that if O
3
is reduced by 25% from what it was during the 1981–1983 period
in theUnitedStates, the economicbenefitswould beapproximately$US1.9 billion
(1982 dollars) (49). Conversely, a 25% increase in O
3
pollution was estimated to
result in costs of $US 2.1 billion.
Although both the US and Europe supported comprehensive research programs
on the impacts of O
3
on agriculture (NCLAN and EOTC, respectively), the United
States has conducted more-thorough economic assessments. The NCLAN and
EOTC studies adopted different approaches, the former designed to provide dose-
response information for use in economic assessments and the latter to study the
mechanisms of O
3
impact and the interactions of O
3
with other environmental
factors. Spash (57) argued that the EOTC program would have been more useful
had it been designed to include an economic assessment of O
3
impacts.
The limitations of the earlier economic assessments persist in the later evalua-
tions listed in Table 4. They include limited O
3
data, extrapolation from a limited
set of crop and cultivar dose-response data (57), uncertainty about appropri-
ate exposure measures, and potential errors arising from the economic model
used (58). However, Adams & McCarl (59) argued that changes in key physical
27 Sep 2001 16:34 AR AR143-09-MAU.tex AR143-09-MAU.SGM ARv2(2001/05/10) P1: GSR
260 MAUZERALL
WANG
TABLE 4 Studies on the annual economic damage resulting from the impact of O
3
exposure
on crops
Region Crops Damage/benefit Comments Reference
US Corn, wheat cotton, $1.89 billion (1982 Benefits of 25% O
3
reduction from 49
alfalfa, forage, rice, dollars); results the average O
3
levels over
soybeans, sorghum similar to Adams the years 1981 through 1983 in
et al. (108) all regions; welfare approach
a
adopted
US Corn, soybeans $17–$82 million Benefits of meeting O
3
standards 109
(1992 dollars) of W126 = 20 (75) ppmh are
$17 (50) million; revenue
approach
b
adopted
US Corn, wheat, cotton, $2–$3.3 billion Benefits from completely 110
soybeans, barley, (1990 dollars) eliminating O
3
precursor
alfalfa, rice, sorghum emissions from motor vehicles;
welfare approach adopted
Netherlands 14 crops in the $320 million Consumers’ net gain from reducing 111
country (1983 dollars) air pollution (including O
3
,
SO
2
, and HF
c
) to background
levels; 70% of crop production
loss is caused by O
3
Netherlands All crops in the 310 million euros Benefits of reducing O
3
to the 112
country (1993–1996 euros) natural background levels;
welfare approach adopted
China Rice, wheat, corn, $2 billion Benefits of reducing O
3
to the W&M
d
soybeans (1990 dollars) natural background levels;
revenue approach adopted
a
Welfare approach refers to mathematical programming models or econometric models based on microeconomic theory
(112). It takes into account the response of input and output market prices to the differential changes that pollution control
causes in each person’s production and consumption opportunities as well as the input and output changes that those
affected can make to minimize losses or maximize gains from changes in production and consumption opportunities and
in the prices of these opportunities (55).
b
Revenue approach is a simple multiplication technique that equates damage to change in yield multiplied by a fixed
market price. It assumes no change in producer acreage and input decisions or in market prices. Adams et al. (113) find that
the simple multiplication technique overestimates the damage by 20% as a result of its failure to account for mitigating
adjustments as well as partially compensating price effects.
c
HF = hydrogen fluoride.
d
X. Wang & D. L. Mauzerall, manuscript in preparation.
parameters had to be substantial if they were to alter benefit estimates significantly,
given the extent of the NCLAN study. The interactions of O
3
with CO
2
and water
stress are important (see Table 3 for description of effects between O
3
and other
environmental factors) but were not included in any of these studies.
It is difficult to directly compare numerical cost estimates between studies be-
cause the sources of O
3
pollution that are evaluated, the crops that are considered,
the dose-response functions that are used, and the assumed economic environmen-
tal conditions differ considerably. In addition, considering aggregated effectsofO
3
on agriculture can be deceptive (56). For example, in US studies where national
effects are reported, the significant impacts of O
3
in the San Joaquin Valley of
California may be obscured. High-level studies both in the United States and in
27 Sep 2001 16:34 AR AR143-09-MAU.tex AR143-09-MAU.SGM ARv2(2001/05/10) P1: GSR
OZONE IMPACTS ON AGRICULTURE 261
Europe can obscure significant differences in regional effects of O
3
because of
both regional variations in ambient O
3
levels and variations in the importance of
O
3
-sensitive crops produced within the region.
Using a simple welfare approach, we estimate that O
3
pollution in the year 1990
may have resulted in decreased yields of four major grain crops in China worth
approximately $2 billion (1990 dollars) (X. Wang & D.L. Mauzerall, manuscript
in preparation).
7. RECOMMENDATIONS FOR FUTURE RESEARCH
Substantial progress has been made in the past 20 years on understanding how
exposure to O
3
reduces crop yields and damages vegetation. However, there are
many areas where research is just beginning. The following is a list of areas where
further knowledge would be particularly valuable.
More systematic and extensive work is needed on crop strains that are used in
the developing world. These strains may be different from those used in the United
States and Europe, where the large-scale systematic studies have been conducted.
In addition, O
3
monitoring is neededindevelopingcountriesto determine O
3
levels
outside urban regions.
To date there has been little work coupling projected increases in tropospheric
O
3
in developing countries with impacts on agricultural yields. Work in this area
has started withtheuseof global and regionalchemicaltracermodels that calculate
O
3
concentrations globally to examine the impact of surface O
3
on crop yields in
China (42, 43; X. Wang & D. Mauzerall, manuscript in preparation). With the
likely increase of emissions of both greenhouse gases and reactive air pollutants,
this is becoming increasingly important.
Given the probable increase in O
3
concentrations in large parts of the northern
hemisphere, it may be worthwhile to evaluate the feasibility of developing crop
strains that are more resistant to O
3
. Although in traditional breeding programs air
pollution resistance has not usually been targeted as a desirable trait, the prospect
of breeding plants with enhanced resistance to common air pollutants is begin-
ning to be examined (20, 61). Because different cultivars of the same crop species
vary in their sensitivity to O
3
, it should be feasible to select and breed plants with
enhanced resistance. In the future, biotechnology could be used to enhance resis-
tance toairpollutants,but before identificationofgene(s)controlling O
3
sensitivity
can be determined, the principle mechanisms underlying the sensitivity/resistance
to O
3
must be better understood (61). In addition, an important question to ad-
dress is whether making use of O
3
-resistant cultivars would result in a trade-off
of such desirable characteristics as flavor, nutritional content, etc., in the crop.
The general consensus of the scientific community, as summarized in the US EPA
criteria document, is that because of the variety of detrimental effects O
3
imposes
on natural ecosystems and human health, top priority should be given to solving
the problem of O
3
pollution at its source and not by selecting pollution-tolerant
cultivars (1).