VietnamNetherlands mekong delta masterplan project me kong delta water resources assessment studies
Bạn đang xem bản rút gọn của tài liệu. Xem và tải ngay bản đầy đủ của tài liệu tại đây (3.08 MB, 68 trang )
Vietnam-Netherlands Mekong Delta Masterplan project
MEKONG DELTA
WATER RESOURCES ASSESSMENT STUDIES
January 2011
LUAN VAN CHAT LUONG download : add
TABLE OF CONTENTS
TABLE OF CONTENTS....................................................................................................... 2
LIST OF FIGURES................................................................................................................ 4
LIST OF TABLES ................................................................................................................. 5
ABBREVIATIONS AND ACRONYMS................................................................................ 5
CHAPTER 1. DESCRIPTION OF THE MEKONG DELTA OF VIETNAM.................. 6
1.1.
ADMINISTRATIVE OVERVIEW ................................................................................ 6
1.2.
TOPOGRAPHY .............................................................................................................. 6
1.3.
RIVER SYSTEM ............................................................................................................ 7
CHAPTER 2. HYDROLOGY AND SURFACE WATER RESOURCES....................... 10
2.1.
CLIMATE AND EXPECTED CLIMATE CHANGE ................................................. 10
2.1.1. Air temperature........................................................................................................... 10
2.1.2. Evaporation................................................................................................................. 10
2.1.3. Air humidity ............................................................................................................... 10
2.1.4. Wind........................................................................................................................... 10
2.1.5. Rain ............................................................................................................................ 12
2.1.6. Climate change ........................................................................................................... 13
2.2.
HYDROLOGICAL REGIMES .................................................................................... 15
2.3.
SURFACE WATER QUANTITY ................................................................................ 16
2.4.
FLOODING................................................................................................................... 17
2.5.
SALTWATER INTRUSION ........................................................................................ 19
2.6.
IMPACTS OF UPSTREAM DEVELOPMENTS ........................................................ 21
2.6.1. Current upstream flow................................................................................................. 21
2.6.2. Further data on the upstream flow of the Mekong river................................................ 23
2.7.
POSSIBLE MEASURES TO IMPROVE THE SITUATION ..................................... 24
2.7.1. Integrated water resources planning for MDV and Decision No.84/2006/Q -TTg....... 24
2.7.2. Adaptation measures for climate change and sea level rise........................................... 24
CHAPTER 3. WATER QUALITY ................................................................................... 26
CHAPTER 4. HYDROGEOLOGY AND GROUNDWATER RESOURCES .............. 36
4.1.
GEOLOGY.................................................................................................................... 36
4.1.1 Tectonics and faulting ..................................................................................................... 36
4.1.2 Stratigraphy .................................................................................................................... 36
4.2.
HYDROGEOLOGY AND GROUNDWATER RESOURCES.................................... 36
4.2.1. The aquifer system in the Mekong Delta ........................................................................ 36
4.2.2. Groundwater quality ...................................................................................................... 39
2
LUAN VAN CHAT LUONG download : add
4.2.3. Groundwater reserves..................................................................................................... 42
4.2.4. Present Groundwater utilization ..................................................................................... 43
CHAPTER 5. WATER DEMAND AND WATER BALANCE ....................................... 45
5.1.
METHODOLOGY........................................................................................................ 45
5.2.
RURAL, URBAN AND INDUSTRIAL WATER DEMAND....................................... 45
5.3.
WATER FOR NAVIGATION...................................................................................... 48
5.4.
PRESENT WATER BALANCE................................................................................... 48
CHAPTER 6. ISSUES TO BE SOLVED .......................................................................... 51
CHAPTER 7. _Toc283708758CONCLUSIVE REMARKS ........................................... 53
References .......................................................................................................................... 55
APPENDIX 1;Water demand assessment source materials............................................. 56
APPENDIX 2; Description of aquifer systems in the Mekong Delta .............................. 59
3
LUAN VAN CHAT LUONG download : add
LIST OF FIGURES
Figure 1: Administrative map of the Mekong Delta of Vietnam...................................6
Figure 2: Topographic map of the Mekong Delta.........................................................7
Figure 3: Map of existing river/canal system of the Mekong Delta in Vietnam ............9
Figure 4: Map of hydro-meteorological stations.........................................................11
Figure 5: Spatial distribution of annual rainfall ..........................................................12
Figure 6: Flooding extent in the Mekong Delta with sea level rise 75cm....................15
Figure 7: Variation of flood levels 2000 at Tân Châu and Châu
c..........................17
Figure 8: Spatial distribution of maximum flood flow and total volume of the flood
2000 (using VRSAP model simulation) ...................................................18
Figure 9: Salinity intrusion isolines in some dry years ...............................................20
Figure 10: Water works development plan for Mekong Delta ....................................25
Figure 11: Water quality monitoring network ............................................................27
Figure 12: pH in 2008 at some stations ......................................................................30
Figure 13: pH in different water resources in 2002-2008 ...........................................30
Figure 14: EC in fields and main streams in 2008 ......................................................31
Figure 15: Salinity at M Tho, 2002-2008 ................................................................31
Figure 16: TSS in fields and rivers in 2008 (right) and TSS in rivers in 2002- 2008
(left) ..........................................................................................................32
Figure 17: T-N in river courses and canals in (data for 2008).....................................32
Figure 18: NH4+ and NO2&3- (data for 2002-2008) ....................................................33
Figure 19: T-N in 2002-2008 & T-P in 2002-2008....................................................33
Figure 20: BOD5 and COD (data for 2008). ..............................................................34
Figure 21: BOD5 in 2002-2008 & COD in 2002-2008 .............................................34
Figure 22. Cross –section III-III ................................................................................37
Figure 23: Map of 120 sub-irrigation areas ................................................................47
4
LUAN VAN CHAT LUONG download : add
LIST OF TABLES
Table 1: Rainfall frequency all the Mekong Delta................................................. 13
Table 2. The change of climate and sea level in southern Vietnam up to 2100 by an
average emission scenario (B2)............................................................................. 14
Table 3. Level of monthly temperature change (°C) in southern Vietnam up to 2100 by
an average emission scenario (B2) ........................................................................ 14
Table 4. Average monthly rainfall change (%) in southern Vietnam up to 2100 by an
average emission scenario (B2)............................................................................. 14
Table 5: Total flow volumes in the Mekong Delta at Tan Chau and Chau Doc stations
(unit: Million m3). ................................................................................................ 16
Table 6. The Mekong river flow at some locations................................................ 22
Table 7. Comparision of recent flow with previous flow at Pakse (unit: m3/s) ...... 22
Table 8. Comparision of recent flow with previous flow at Kratie (unit: m3/s) ..... 22
Table 9. List of hydropower projects upstream Mekong basin .............................. 23
Table 10: List the standard method of testing water quality .................................. 28
Table 11: Coliform in 2008 (MPN/100 ml)........................................................... 35
Table 14. Results of calculation of static reserves (m3/day)................................... 42
Table 15. Results of calculation of dynamic reserves (m3/day).............................. 42
Table 16: Groundwater utilization in the Mekong Delta........................................ 44
Table 17: Monthly water flow demand ................................................................. 46
Table 18: Monthly water volume demand ............................................................. 46
Table 19: Water requirements for navigation/waterway transportation................. 48
Table 20: Present water balance............................................................................ 49
ABBREVIATIONS AND ACRONYMS
POR
Plain of Reeds
LXQ
Long Xuyen Quadrant
CMP
Ca Mau Peninsula
MD
Mekong Delta of Vietnam
TCVN
Vietnamese Standard
5
LUAN VAN CHAT LUONG download : add
CHAPTER 1. DESCRIPTION OF THE MEKONG DELTA OF VIETNAM
1.1 ADMINISTRATIVE OVERVIEW
The Mekong Delta of Vietnam (MD) is formed by the lower part of the Mekong river
delta, and includes 13 cities and provinces of Long An, Tien Giang, Dong Thap, Vinh
Long, Tra Vinh, Can Tho, Hau Giang, Soc Trang, Ben Tre, An Giang, Kien Giang,
Bac Lieu and Ca Mau. The total natural area comprises approximately 3.96 million
hectares (excluding Duc Hoa District Long An Province and Phu Quoc island province
Kien Giang), accounting for 79% of the whole MD and forming 5% of the Mekong
River basin. The Mekong Delta of Vietnam is surrounded by: (a) Vietnam-Cambodia
border in the North; (b) Pacific ocean / South China Sea to the East (the so-called East
sea), (c) Gulf of Thailand in the West (the so-called West sea), and (c) Vam Co Dong
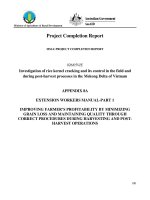
River and Ho Chi Minh City in the North-West (Figure 1).
Figure 1: Administrative map of the Mekong Delta of Vietnam
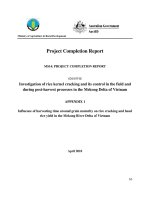
1.2 TOPOGRAPHY
The Mekong Delta of Vietnam consists of flat terrain, mostly of average height of 0.7
to 1.2 m, except for some high hills in the northern delta province of An Giang (Map
1/25000, Ministry of Water Resources, 1984 and also in the 2003 Digital Terrain
Model of the Mekong delta). Along the Cambodian border, the terrain is highest, from
2.0 to 4.0 m above sea level, then lower to the central plains, from 1.0 to 1.5 m high,
and only 0.3 to 0.7 m in the tidal and coastal areas.
6
LUAN VAN CHAT LUONG download : add
Figure 2: Topographic elevation map of the Mekong Delta
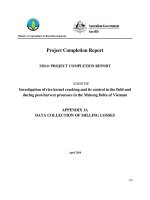
1.3 RIVER SYSTEM
The Mekong Delta river system comprises a relatively dense network of river courses
and canals, including the natural river systems and canals:
- The main natural river branches and canals in the Mekong delta are formed by
the two systems of the Tien River and Hau River (respectively the lower branches of
the Mekong and Bassac rivers). These rivers flow to the sea in estuaries via nine river
mouths as Tieu, Dai, Ba Lai, Ham Luong, Co Chien , Cung Hau, Dinh An, Ba Thac
and Tranh De (river mouths in the territory of Ba Thac in Soc Trang province have
been covered in the 1970’s) and a short river Vam Nao river linking the Tien and Hau
7
LUAN VAN CHAT LUONG download : add
main branches. Vam Co River (including the Vam Co Dong-Vam Co Tay) runs
parallel to the east of the Tien River, Cai Lon-Cai Be River, My Thanh, Ganh Hao,
Ong Doc, Bay Hap rivers flow to the West and East Sea.
The Tien and Hau rivers transfer the largest amounts of water with a total annual flow
of 325.41 billion m3 observed at station Tan Chau (on the Tien river) and 82.43 billion
m3 in station Chau Doc (on the Hau river); the flow rate on the Tien River / Hau River
is 80/20. Both the Tien river and Hau river are wide and deep, with the average width
of about 1000-1500 m and an average depth of 10-20 m (and locations where the depth
is over 40 m). However, near the mouth, the river widens and the riverbed is raised by
siltation. Within the two rivers courses many elongate islands have formed. River
processes cause shore erosion and sedimentation and complex flow patterns cause
instability of river banks.
Vam Co River system consists of two branches (Vam Co Dong and Vam Co Tay), that
originate in Cambodia, and flow east through the Mekong Delta.
- The Cai Lon-Cai Be are tidal rivers, derived from the center of the Ca Mau
peninsula and flow to the sea through the Cai Lon river mouth. The estuary is very
wide but not deep.
- The system of manmade canals in the Mekong delta was constructed primarily
during the past century, with the primary purpose to develop agriculture and
transportation. Until now, the canal system has developed into a dense network with 3
levels of major, primary and secondary canals. The primary and secondary canal
systems have a high density, with some 80-10 m / ha, and a total of 30,000-40,000 km
of canals in all the Mekong Delta. Figure 3 below illustrates the density of the
irrigation systems.
8
LUAN VAN CHAT LUONG download : add
Figure 3: Map of existing river/canal system of the Mekong Delta in Vietnam
9
LUAN VAN CHAT LUONG download : add
CHAPTER 2. HYDROLOGY AND SURFACE WATER RESOURCES
2.1 CLIMATE AND EXPECTED CLIMATE CHANGE
The Mekong Delta, being located in a tropical monsoon region, is hot year-round and
has a seasonal distribution of dry-wet months depending on the operation of the
monsoon. The dry season usually coincides with the period of control of the NorthEast monsoon that lasts from November to April, and the weather is characterized by
dry heat and little rain. The wet season coincides with the period of control of the
South-West monsoon that lasts from May to October, and the climate is characterized
by hot, humid, and (high) rainfall. Specific features are as follows:
2.1.1 Air temperature
The average temperature in January varies from about 27-28oC. May is the month with
the lowest temperature (an average of 25.5oC) and the hottest month is IV (28oC).
There is a relative equal distribution of temperatures across the delta region.
2.1.2 Evaporation
The evaporation regime also changes little over time and space. In terms of time in the
year evaporation is highest in the months III, IV and V. The highest amounts for these
months vary around 180-220 mm. As soon as the rain starts in months VIII to IX,
lower evaporation is reached, from 100-150 mm.
2.1.3 Air humidity
Relative humidity reaches high values in May and decreases towards the dry season.
Average humidity in months VIII, IX and X ranges from 84-89%, while in months II
and III it ranges from 67-81%.
2.1.4 Wind
The winds in the north-east of the Mekong delta are prevalent during the dry season,
from months XII-IV and in the south-west prevalent during the rainy season, (months
V-X). Average wind speeds are about 2.0 m/s. General, closer to the sea, wind speeds
often increase in months I, II and III. Wind speeds in low-pressure periods and storms
can reach 15-18 m/s (with a storm number of 5 in 1997).
Sunshine hours are on average 6 hours per day (approximately 2,000-2,500 hours per
year). Months II, III have the highest number of sunshine hours, with 8-9 hours a day,
while months VIII, IX have less hours of sunshine, with an average 4.6 to 5.3 hours per
day.
10
LUAN VAN CHAT LUONG download : add
Figure 4: Map of hydro-meteorological stations. Monitoring data are available on
monthly temperature T, humidity H, wind speed W, Solar radiation S, water
evaporation E. Calculation of potential evaporation (ETo) is on the basis of these
meteorological data.
11
LUAN VAN CHAT LUONG download : add
2.1.5 Rain
The Mekong Delta has an average rainfall of approximately 1800 mm, but with an
uneven distribution both in space and time. The western region has the most rainfall
with annual average from 2000-2400 mm, while the east has from 1600-1800 mm
rainfall on average. The central plains stretching from Long Xuyen, Chau Doc-Can
Tho to Tra Vinh - Cao Lanh - Go Cong have the lowest rainfall, with averages of
1200-1600 mm. The amount of rain is very unevenly distributed over the year.
Approximately 90% of annual rainfall is concentrated in the rainy months. Rainfall in
the dry season accounts for only 10%, with months I, II, III having almost no rain
(often triggering severe droughts). In the rainy season occasionally, there is continuous
rain, which may last for 3-5 days, with a relatively large amount of rain, causing
flooding and an increase in water levels.
Figure 5: Spatial distribution of annual rainfall
12
LUAN VAN CHAT LUONG download : add
Rainfall data: Data on monthly rainfall are available for 23 years in 42 stations
distributed evenly throughout the region. Calculated statistical mean ( ) and standard
deviation ( ) of monthly rainfall time series are often formulated in a probability
distribution Log-normal R = ex, z, where R is the rainfall, x= +z , the z value by 0.8416, or zero or +0.8416 corresponding value R with a frequency of 80% (in low
water) or 50% (medium water) or 20% (much water). There are no data gaps in rainfall
time series, except for a few month in 2-3 years of U Minh and Ganh Hao stations.
By calculating the average arithmetic average of rainfall stations in the whole Mekong
Delta region reached approximately 1660 mm, in a wet year the frequency of 20% of
annual rainfall reaches 1955 mm (up 17% compared to average), in dry years it only
reaches 1410 mm (down 15%).
Table 1: Rainfall frequency all the Mekong Delta
Unit: mm
Month
Annual
Freq.
I
II
III
IV
V
VI
VII
VIII
IX
X
XI
XII
total
80%
2.5
2.5
3.9
12.5
94.5
140.0
146.1
150.8
171.9
198.0
51.4
8.2
1410.8
50%
7.1
7.9
13.5
36.0
152.4
196.6
220.3
214.4
239.3
278.6
104.4
24.3
1659.3
20%
26.0
29.1
51.6
111.3
251.0
278.1
336.6
306.7
334.9
394.6
222.9
77.2
1955.6
2.1.6 Climate change
Climate change is one of the biggest challenges for mankind in the 21st century.
Climate change will seriously affect the production, life and the environment
throughout the world. Temperature increases, sea level rises causing flooding, salt
water intrusion and detrimental effects on agriculture. All this creates a substantial risk
for the industrial and socio-economic system in the future.
In Vietnam during the last 50 years, average annual temperatures have risen about 0.5
to 0.7°C, sea level rise was about 20 cm. Climate change has caused disasters,
particularly typhoons, floods and more intensive droughts.
The Ministry of Natural Resources and Environment (MONRE) studied possible
climate change and sea level rise scenarios for Vietnam. Under these scenarios, the
climate in all regions of Vietnam will undergo changes. In the late 21st century,
average temperatures in Vietnam could have increased by about 2.3°C; total annual
rainfall and wet season rainfall may have increased while dry season rainfall will have
decreased. A sea level rise is anticipated of about 75cm.
Scenarios of global greenhouse gas emission levels were selected to calculate the
alternative climate change scenarios (A2, B2=average) for Vietnam. The figures
represent the calculated changes compared to the figures over the period 1980-1999.
13
LUAN VAN CHAT LUONG download : add
Table 2. The change of climate and sea level in southern Vietnam up to 2100 by an
average emission scenario (B2)
Milestones in the 21st century
Parameters
2020 2030 2040 2050 2060 2070 2080 2090 2100
Temperature
(oC)
increase 0.4
0.6
0.8
1.0
1.3
1.6
1.8
1.9
2.0
Rainfall increase (%)
0.3
0.4
0.6
0.7
0.8
0.9
1.0
1.0
1.0
Sea level rise (cm)
12
17
23
30
37
46
54
64
75
Table 3. Level of monthly temperature change (°C) in southern Vietnam up to 2100 by
an average emission scenario (B2)
Months
Milestone in the 21st century
2020
2030
2040
2050
2060
2070
2080
2090
2100
XII-II
0.3
0.5
0.6
0.8
1.0
1.3
1.5
1.5
1.7
III-V
0.4
0.6
0.8
0.9
1.2
1.4
1.7
1.8
1.9
VI-VIII
0.5
0.7
0.9
1.2
1.5
1.8
2.0
2.1
2.1
IX-XI
0.5
0.6
0.9
1.2
1.4
1.8
1.9
2.1
2.3
Table 4. Average monthly rainfall change (%) in southern Vietnam up to 2100 by an
average emission scenario (B2)
Months
Milestones in the 21st century
2020
2030
2040
2050
2060
2070
2080
2090
2100
XII-II
-3.0
-4.4
-6.2
-8.1
-8.7
-11.4
-12.8
-14.2
-15.4
III-V
-2.8
-4.1
-5.8
-7.5
-9.1
-10.6
-12.0
-13.2
-14.3
VI-VIII
0.3
0.5
0.6
0.9
1.1
1.2
1.4
1.5
1.6
IX-XI
2.6
3.8
5.3
6.8
8.3
9.6
10.9
11.9
13.0
Based on scenarios of sea level rise, inundation maps have been constructed, the first
step is for the area of the Mekong delta based on the topographic map scale 1/2000 and
1/5000 and the digital elevation model with a 5x5m resolution for the whole region.
Average current sea levels were calculated based on the measured tidal data at Vung
Tau (period 1979-2007).
An inundation area map of the Mekong delta for 75 cm of sea level rise is shown in the
figure below.
14
LUAN VAN CHAT LUONG download : add
Figure 6: Flooding extent in the Mekong Delta with a sea level rise 75cm
2.2 HYDROLOGICAL REGIMES
Hydrological regimes in the Mekong Delta are affected directly by the river flow, the
tidal regime of the East Sea (South China Sea) and for some parts of the delta by the
tidal regime in the Gulf of Thailand (West Sea). The East Sea has a semi-diurnal and
irregular sea-tide regime, while the West Sea is diurnal.
Based on the influence of these diverse tidal patterns and cycli, the Mekong Delta can
be divided into three different regions hydrologically. These are: (a) the northern
plains, including sections of the province of An Giang and Dong Thap, an area about
300,000 ha), where the impact of the river floods is dominant; (b) an area with
combined river flood-tidal impacts; this region is bound by the Cai Lon river-Xeo Chit
channel Lai Hieu canal - Mang Thit river and Ben Tre-Cho Gao canals with an area of
about 1.6 million ha), and (c) the coastal delta regions with direct influence of the
primary tides; this includes the entire coastal region of the East Sea, with an area of
about 2.0 million ha).
Seasonal flooding in the Mekong Delta usually begins in months VI-VII and ends in
months XI- XII, with an average peak flow entering the delta of around 28,000-30,000
m3/s. This is followed by a seasonal average dry flow of about 3,000-5,000 m3/s.
Both high and low flood regimes prevail for about 6 months.
15
LUAN VAN CHAT LUONG download : add
Total average annual river flow in the Mekong Delta in the upstream parts of the Tien
and Hau rivers is ~408 billion m3 (according to data measured from 2000 to 2008 at
Tan Chau and Chau Doc stations). With flooding in the flood season the border region
accounts for 14-18% of the total flood into the territory of Vietnam (estimated 57
billion m3) and surface water by rain on the plains accounts for 11% of the whole
water volume (estimated 45 billion m3).
2.3 SURFACE WATER QUANTITY
Firstly, stations in main tributaries (stations on the river) or primary river/canals
(tributary channels) are identified. Statistical analysis can be performed on the monthly
flow data of stations to obtain delta-wide hydrological characteristics.
In the Mekong Delta there are only five stations along the main river courses i.e. on the
Tien river (Tan Chau and My Thuan stations), the Hau river (station Chau Doc and
Can Tho) and on the Vam Nao river (Vam Nao station). Vam Nao river is the short
connection between the Tien River and Hau River in An Giang province. Data time
series for this area are short; stations My Thuan and Can Tho have data continuously
from 2003 to 2006, station Tan Chau, Chau Doc and Vam Nao have data continuously
from 2000 to 2007.
Stations Tan Chau and Chau Doc are most important for measuring the flow of the
entire basin, viz. the upstream Mekong River, to the Mekong Delta. Station Vam Nao
quantifies flow from the Tien river to the Hau river. Stations My Thuan and Can Tho
quantify flow of the two rivers Tien and Hau river after flowing through the Plain of
Reeds area (POR) and Long Xiuyen Quadrant (LXQ), and after distribution of water
through main irrigation channels in the POR and LXQ regions. Stations My Thuan and
Can Tho are also influenced by sea tide.
The Mekong Delta has some local hydrological stations that measure the water level in
the regular channels and other stations measuring water in coastal estuaries. Estuarine
coastal stations and local stations in the coastal provinces measure salinity. However,
all the local stations and the estuarine stations do not consistently measure the flow.
Therefore, within the delta sub-regions are considered as secondary basins; these are:
Plain of Reeds (POR), Long Xuyen Quadrant (LXQ), the Middle Plains, between the
courses of the Tien and Hau rivers, and the Ca Mau Peninsula (CMP). Since
comprehensive quantification of local flow data for these sub-areas is not possible, a
quantitative analysis is performed by means of a river hydraulic model simulation.
Table 5: Total flow volumes in the Mekong Delta at Tan Chau and Chau Doc stations
(unit: Million m3).
Freq.
Month
Annual
16
LUAN VAN CHAT LUONG download : add
average
I
II
III
IV
V
VI
VII
VIII
IX
X
XI
XII
P80%
(dry)
17329
9577
6918
5989
8056
16257
32953
55687
62951
63397
42290
28527
366162
P50%
(AVR)
20536
11844
8390
6924
10328
22699
42177
62745
68040
66297
47917
33353
405207
P20%
(Wet)
24338
14648
10174
8006
13243
31693
53984
70697
73540
69331
54293
38996
448415
2.4 FLOODING
Every year, the overflowing of the Mekong River floods a large area in the northern
part of the Mekong Delta. Floods may reach an area of about 1.2 to 1.4 million ha in a
regular flood and even 1.7 to 1, 9 million ha in a major flood, with a depth from 0.5 to
4.0 m and the time from 3-6 months. Flooding in the Mekong Delta can be divided into
three periods.
Early flood season (months VII-VIII): the main rivers flood quickly and the rivers
flowing into canals to fields distribute the floodwaters. During this flood much silt is
brought that forms the main source for rice field nutrients in the flood season.
Figure 7: Variation of flood levels 2000 at Tân Châu and Châu
c
17
LUAN VAN CHAT LUONG download : add
Figure 8: Spatial distribution of maximum flood flow and the total volume of the flood
in the year 2000 (using VRSAP model simulation).
18
LUAN VAN CHAT LUONG download : add
A second flooding period is when floodwaters reach high levels (exceeding 4.0 m at
Tan Chau, and Chau Doc exceeding 3.8 m). These floodwaters enter the delta from
two directions a) perpendicular from the main river courses and b) from the VietnamCambodia border region directly. The border flows spill over after flooding and silt
deposition in the most flooded areas of Cambodia, and subsequently overflow into the
POR and LXQ
The third period is the period when the flood is in recession, usually starting by the end
of October when the flow spilling from Cambodia has decreased, down the Mekong
delta flood water recedes gradually until December
According to the classification of the National Center for Meteo-Hydrological
Forecasting, the water levels at Tan Chau for a low flood are: 4.0 m (warning level I),
4.0 to 4.5 m; for an average flood (warning level II) and for a major flood >4.5 m
(warning level III), with a corresponding flood frequency of 13.2%, 46.2% and the
average large flood 40.6%. Statistics show that in 60 years, on average every 2 years
there is a flood alarm for warning level III (at Tan Chau the water level is over 4.5 m).
2.5 SALTWATER INTRUSION
Saltwater intrusion in the Mekong Delta is a complex process, depending on the
magnitude of the floods, the ability to supply fresh water from upstream during the dry
season, summer-autumn paddy production status and timing of the rainy season. In
general, with late monsoon rains and with water volumes from upstream to just below
70% of the average, the salt will intrude very far inland, like for example in 1977,
1993, 1998 and 2004-2005.
Every year, the highest salinities occur late in the dry season, usually in April,
sometimes in early May. With salinity 1g/liter, the length of the salinity intrusion is 40
- 50km upstream, the less likely on the Mekong River branches and higher on the Vam
Co River. With the start of the flood season, flood waters from upstream push the salt
back to the estuaries. In the mid-flood season (Month IX, X), salt 1g/liter is usually
located in the estuaries only.
In the Plain of Reeds salt intrusion progresses through the Tien River and Vam Co Tay
River. Vam Co Tay has no resources upstream, and salt water may intrude far. Salinity
also depends on the Tien River flows from the upstream Mekong River. Years of often
large flood flows may push the salt intrusion outwards. In contrast, after a small flood
the salt intrusion may reaches far upstream the rivers and canals.
In the Ca Mau Peninsula, the salt water intrusion is extremely serious and most
complex in the Mekong Delta. The land area is bordered on two side by the East Sea
and West Sea respectively. Two different tidal regimes affect the river flow in the
canal system and restrict the transfer of fresh water from the Hau river towards the
deeper interior fields.
The Long Xuyen Quadrant area is directly affected by salt water from the West Sea.
The main canals in the Long Xuyen Quadrant from Tri Ton to Cai San take water from
the Hau river and drain this out to sea. The West sea tide has only a small amplitude.
19
LUAN VAN CHAT LUONG download : add
Most of the west coast channels have salinity control gates, but Vam Rang and Ha
Giang channels are still open enabling saltwater intrusion.
Figure 9: Salinity intrusion isolines in some dry years
20
LUAN VAN CHAT LUONG download : add
Utilization of saline water: Salinity in the eastern coastal region is around 30-34 g/l;
the salinity in the western coastal region is about 22-28 g/l. This regional pattern is
influenced by the country's river systems flowing into the Delta. The salinity gradient
in the zone from Soai Rap to the eastern part of Ca Mau Cape shows the largest
amplitude.
Given the influence of alkalines washed from contaminated soil in the Ca Mau
peninsula in the rainy season, the pH in estuarine, coastal areas in the Ca Mau
Peninsula changes significantly, from 4.45 to 8.7, However in the dry season there is a
stable pH (range 8.1 to 8.7). Like in the Ca Mau peninsula, the west coast territory in
Kien Giang province is affected by the flood drainage system to the West sea. During
the beginning of the rainy season acid waters with other pollutants are becoming a
serious threat to the aquaculture in brackish and salt water in the coastal zone from
Hon Dat to Ha Tien.
Aquaculture in salt water is a relatively new production method that has brought
economic returns, gradually changing the economic structure in the coastal provinces
and contributing the food supply, employment, increased income and reduction of
poverty. The total area of aquaculture in 2007 reached 660,614 ha (584,065 ha of
shrimp, 54,612 ha of fish, and 21,937 ha of farming oysters scallop, buildings, crab).
The area of shrimp and fish is found mainly in Ca Mau, Bac Lieu, Tra Vinh, Ben Tre,
Tien Giang and Kien Giang. It is already observed that the concentration of ponds and
the production systems are contributing to the deterioration of water quality.
Salty water for the aquaculture ponds is usually taken directly from the large estuaries
of the Mekong; from the Soai, Vam Co River and through canals connecting the East
Sea (for parts of Ca Mau, Bac Lieu, Soc Trang, Tra Vinh, Ben Tre, Tien Giang and
Long An). At the West sea salt water is directed from the larger rivers such as the Cua
Lon, Bay Hap, Ong Doc, Cai Lon and dozens of other canals connecting directly to the
West sea.
2.6 IMPACTS OF UPSTREAM DEVELOPMENTS
2.6.1. Current upstream flow
Upstream flow at specific locations was computed using hydrological models with the
following results:
The Great Lake (Ton Le Sap) upstream of the Mekong delta in Cambodia has a full
storage volume of 80 billion m3 and regulates upstream flow to store flood waters and
release again later to increase dry flow downstream.
Impact of upstream developments on the flow pattern of the Mekong Delta
Before 1990, there was only 1 hydropower plant in the Mekong River Basin (Nam
Ngum, with an active reservoir volume of 4700 million m3). In the period from 1991
to 2003 four additional large hydropower plants (with a total active volume of 1926
million m3) were built. Data analysis for flows at Pakse shows that flows in the dry
months have significantly increased in recent years, as compared to before.
21
LUAN VAN CHAT LUONG download : add
Table 6. The Mekong river flow at some locations
Location
Catchment area (km2)
nh H ng
Annual volume (billion m3)
74,00
Chiang Sean
189. 000
84,43
Luang Prabang
268.000
121,34
Nong Khai
302.000
140,62
Nakhon Phanom
373.000
249,42
Mukdahan
391.000
269,41
Pakse
545.000
317,09
River mouth
745.000
475,00
Table 7. Comparision of recent flow with previous flow at Pakse (unit: m3/s)
NO
Period
Jan
Feb
Mar
Apr
Five year average Q(1)
1986 - 1990
2447
2068
1879
1729
Five year average Q(2)
1991 - 1995
2619
2025
1749
1651
Five year average Q(3)
1996 - 2000
2626
2122
1903
1904
Five year average Q(4)
2001 - 2005
2993
2399
2125
2058
Q(4) - Q(1)
546
331
246
329
Q(4) - Q(2)
374
374
376
307
Table 8. Comparision of recent flow with previous flow at Kratie (unit: m3/s)
NO
Period
Jan
Feb
Mar
Apr
Five year average Q(1)
1986 - 1990
3394
2340
1932
1840
Five year average Q(2)
1991 - 1995
3813
2732
2189
2134
Five year average Q(3)
1996 - 2000
4337
3204
2473
2718
524
472
284
584
Q(3) – Q(2)
The above table 8 also shows monthly flow at Kratie that significantly increased in
recent years. These figures indicate the positive impact of upstream reservoirs on the
dry season flow.
22
LUAN VAN CHAT LUONG download : add
Table 9. List of hydropower projects upstream Mekong basin
No
1
Reservoir name
m Ngum
River
m Ngum
Active
volume
(Million
m3)
Year of
completion
Country
4700
1971
Laos
2
Mam Wan
Mêkong
258
1993
China
3
Theun Hiboun
Theun
Hiboun
694
1998
Lao
4
Yaly
Sesan
779
2001
Vietnam
5
Dachao Han
Mêkong
240
2003
China
6
Plei Kroong
Sesan
948
2008
Vietnam
7
Sesan 4A
Sesan
204
2008
Vietnam
Nam Theun
3378
2009
Lao
8
m Theun 2
9
Boun Kuop
Serepok
523
2009
Vietnam
10
Nam Ngum 2
Nam ngum
2994
2010
Lao
11
Nâm Lik2
Nam Lik
826
2010
12
Jing Hong
Mêkong
230
2010
China
As expected, the upstream reservoirs will increase downstream flow in the dry seasons.
However, critical situations will occur in extremely dry years when reservoir water
shortages happened with resulting unsuitable operational procedures for reservoir
management. Under such conditions, the downstream flow regime is significantly
affected.
Further data on the upstream flow of the Mekong River: (MRC, 2009)
Six upstream reservoirs in China with a total volume of 21 billion m3
total basin wide water)
(4,6% of
Sub-basins of the lower Mekong basin in Laos, Thailand, Cambodia and the
Central Highlands of Vietnam:
Existing 40 reservoirs with volume of 22 billion m3 ( 4,7%)
By 2030: 70 reservoirs with additional 20 billion m3 (4,2% )
Main lower stream of Laos, Thailand and Cambodia: The total volume of 11
reservoirs is 2,5 billion m3 (0,5%).
23
LUAN VAN CHAT LUONG download : add
Basin total volume of reservoirs is 100 billion m3 and this forms 18 % Mekong
annual flow.
Water demand: Water demand in 2030 will increase by 50% compared to demand
in 2000. By 2050 it will have increased by about 100%.
Upstream flow at Kratie: changes by 2050:
Annual flow: Increase 870 m3/s, (+6,9 % of average flow in 1985-2000).
Average flood flow: Decrease 1.669 m3/s, (-7,4%)
Average dry flow: Increase 848 m3/s, (+19,7%).
In a report of the Asian Development Bank (2009) flow changes in the Mekong basin
by 2070-2099 are predicted as follows:
Maximum flow Qmax increase +19% for the Mekong delta.
Minimum flow Qmin decrease -29 % for the Mekong delta.
2.7 POSSIBLE MEASURES TO IMPROVE THE SITUATION
2.7.1 Integrated water resources planning for Mekong Delta and Decision
No.84/2006/Q -TTg
In the year 2005 MARD executed a master plan study on integrated water resources
planning for the delta, including analysis of local socio-economic developments and
particularly looking for more effective crop patterns. Through the study, MARD
submitted the water work portfolio for approval by the Prime Minister under the
Decision No.84/2006/Q -TTg dated 19/4/2006.
The Decision assigned tasks and solutions for the sub-regions POR, LXQ, BTHR and
CMP as well as proposed a number of investment projects (water works) for the period
2006-2010 and 2011-2020.
The Decision proposed a long/term development plan to adapt and solve critical issues
in the dry season caused by upstream developments. The possible measures were
identified as suitable changes in cropping patterns, increasing water storage in canals
and local storage basins, further studies on development of large sluice gates in main
stream mouths.
2.7.2 Adaptation measures for climate change and sea level rise
MARD is implementing further water resources planning studies for climate change
and sea level rise adaptation. A number of proactive measures and adaptation
guidelines for in particular salinity intrusion were recommended as follows:
Completion of projects listed in decree 84/2006/QD-TTg and additional works
proposed by the provincial authorities
Construction of sea dikes, associated works and coastal roads
Construction of estuary dikes and culverts
24
LUAN VAN CHAT LUONG download : add
Construction of water diversion channels/pipes for coastal sub-areas
Construction of flood control systems
Improvement of inland systems for agriculture
Development of urban drainage systems
Building large sluice gates at river mouths: (i) The Cai Lon-Cai Be sluice, (ii) Vam
Co sluice, (iii) Ham Luong sluice, (iv) Cung Hau sluice and (v) Co Chien sluice.
The location of important sluices is presented in Figure 10.
Vàm C sluice
Hàm Luông sluice
Cái L n-Cái Bé sluice
Chiên sluice
Cung H u sluice
Figure 10: Water works development plan for Mekong Delta
25
LUAN VAN CHAT LUONG download : add