influenza a virus migration and persistence in north american wild birds
Bạn đang xem bản rút gọn của tài liệu. Xem và tải ngay bản đầy đủ của tài liệu tại đây (938.8 KB, 13 trang )
Influenza A Virus Migration and Persistence in North
American Wild Birds
Justin Bahl1,2., Scott Krauss3., Denise Kuăhnert4,5, Mathieu Fourment1, Garnet Raven6, S. Paul Pryor6,
Lawrence J. Niles7, Angela Danner3, David Walker3, Ian H. Mendenhall1, Yvonne C. F. Su1,
Vivien G. Dugan8,9, Rebecca A. Halpin8, Timothy B. Stockwell8, Richard J. Webby3, David E. Wentworth8,
Alexei J. Drummond4,5, Gavin J. D. Smith1,10*, Robert G. Webster3*
1 Laboratory of Virus Evolution, Program in Emerging Infectious Diseases, Duke-NUS Graduate Medical School, Singapore, 2 Center for Infectious Diseases, The University
of Texas School of Public Health, Houston, Texas, United States of America, 3 Department of Infectious Diseases, St. Jude Children’s Research Hospital, Memphis,
Tennessee, United States of America, 4 Department of Computer Science, University of Auckland, Auckland, New Zealand, 5 Allan Wilson Centre for Molecular Ecology and
Evolution, University of Auckland, Auckland, New Zealand, 6 Environment Canada, Canadian Wildlife Service, Edmonton, Alberta, Canada, 7 Conserve Wildlife Foundation
of New Jersey, Bordentown, New Jersey, United States of America, 8 J. Craig Venter Institute, Rockville, Maryland, United States of America, 9 Division of Microbiology and
Infectious Diseases/National Institute of Allergy and Infectious Diseases/National Institutes of Health/Department of Health and Human Services, Bethesda, Maryland,
United States of America, 10 Duke Global Health Institute, Duke University, Durham, North Carolina, United States of America
Abstract
Wild birds have been implicated in the emergence of human and livestock influenza. The successful prediction of viral
spread and disease emergence, as well as formulation of preparedness plans have been hampered by a critical lack of
knowledge of viral movements between different host populations. The patterns of viral spread and subsequent risk posed
by wild bird viruses therefore remain unpredictable. Here we analyze genomic data, including 287 newly sequenced avian
influenza A virus (AIV) samples isolated over a 34-year period of continuous systematic surveillance of North American
migratory birds. We use a Bayesian statistical framework to test hypotheses of viral migration, population structure and
patterns of genetic reassortment. Our results reveal that despite the high prevalence of Charadriiformes infected in
Delaware Bay this host population does not appear to significantly contribute to the North American AIV diversity sampled
in Anseriformes. In contrast, influenza viruses sampled from Anseriformes in Alberta are representative of the AIV diversity
circulating in North American Anseriformes. While AIV may be restricted to specific migratory flyways over short time frames,
our large-scale analysis showed that the long-term persistence of AIV was independent of bird flyways with migration
between populations throughout North America. Analysis of long-term surveillance data provides vital insights to develop
appropriately informed predictive models critical for pandemic preparedness and livestock protection.
Citation: Bahl J, Krauss S, Kuăhnert D, Fourment M, Raven G, et al. (2013) Influenza A Virus Migration and Persistence in North American Wild Birds. PLoS
Pathog 9(8): e1003570. doi:10.1371/journal.ppat.1003570
Editor: Raul Andino, University of California San Francisco, United States of America
Received June 25, 2012; Accepted June 18, 2013; Published August 29, 2013
Copyright: ß 2013 Bahl et al. This is an open-access article distributed under the terms of the Creative Commons Attribution License, which permits unrestricted
use, distribution, and reproduction in any medium, provided the original author and source are credited.
Funding: This study was supported by contracts HHSN266200700005C, and HHSN272200900007 from the National Institute of Allergy and Infectious Disease,
National Institutes of Health, Department of Health and Human Services. JB and GJDS are supported by the Duke–NUS Signature Research Program funded by the
Agency for Science, Technology and Research, Singapore, and the Ministry of Health, Singapore. The funders had no role in study design, data collection and
analysis, decision to publish, or preparation of the manuscript.
Competing Interests: The authors have declared that no competing interests exist.
* E-mail: (GJDS); (RGW)
. These authors contributed equally to this work.
though there is evidence that Anseriformes infected with influenza A
virus have hampered migration, these hosts vector influenza
viruses vast distances [11–12]. Disease transmissions between the
millions of conspecific birds at congregating sites throughout the
world contribute to the genetic variability and reassortment of
influenza A viruses [13,14]. It is not coincidental that these major
breeding, feeding, and staging sites are also regions of high viral
prevalence [14–21].
Recent efforts to assess invasive virological threats have focused
on increased surveillance and early detection of introduced viral
strains [22–24]. Influenza A viruses have transmitted between the
Eurasian and North American wild Anseriformes and Charadriformes
gene pools where birds from both continental regions commingle
and therefore the threat posed by introduction of H5N1 to North
America remains. However, once a virological threat has entered
Introduction
Migrating wild birds have been implicated in the spread and
emergence of human and livestock influenza, including pandemic
influenza and highly pathogenic H5N1 avian influenza [1–3].
Viral transmission between wild birds and domestic poultry has
contributed to genomic reassortment and confounded disease
control efforts [2,4]. Subsequently, with the reintroduction of
H5N1 to wild birds the virus has spread throughout Eurasia and
Africa [5–9]. While it is contentious as to whether wild birds are
the primary vectors spreading H5N1 viruses over long distances,
there is little doubt that these animals play a role in confounding
disease surveillance and control efforts.
It is estimated worldwide that over 50 billion birds migrate
annually between breeding and non-breeding areas [10]. Even
PLOS Pathogens | www.plospathogens.org
1
August 2013 | Volume 9 | Issue 8 | e1003570
Spatial Diffusion of Avian Influenza A Virus
circulating in North America (Lineages I and II) and a third
lineage that is a mix of North American and Eurasian isolates
(Figure S1). All gene sequences that were of Eurasian origin were
excluded from all further analysis in this study, including those that
belonged to the mixed Eurasian/North American lineage.
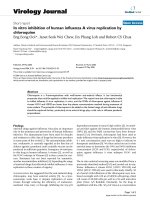
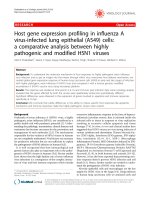
Comparative genomic analysis of H3 subtype viruses isolated
from the Alberta and Delaware Bay sites was conducted to test
AIV evolutionary dynamics in different hosts. In Alberta, where
birds sampled were primarily juvenile Anseriformes [20] the H3-HA
phylogeny showed that H3 viruses were recovered in almost every
year (ntax = 94), with both Lineage I and II viruses present
(Figure 1A). In contrast, in Delaware Bay, where only Charadriiformes were sampled, H3 viruses were detected in only 7 years
(ntax = 69) from 24 years of surveillance (Figure 1B). In those years
when H3 viruses were isolated in Delaware Bay, only a single
clade was detected each sampling season and no co-circulation of
these clades was apparent. While viral prevalence in Delaware Bay
and Alberta are similar [17], Anseriformes host a representative
diversity of AIV in North America. In contrast, Charadriiformes host
limited viral diversity exhibiting local epidemic-like dynamics [25]
suggesting Charadriformes in Delaware Bay are being infected from
a currently undetected AIV population.
We used multidimensional scaling of times of most recent
common ancestor (tMRCAs) and patristic distances for each gene
segment (excluding NA) to test differences in reassortment between
populations (Figure 1C, D). In this analysis, the spread of each
point cloud represents the statistical uncertainty in the phylogenetic history of each gene and we expect non-reassortant genes will
have overlapping point clouds [26]. For both Alberta and
Delaware Bay these analyses clearly indicate high levels of
reassortment and that the evolutionary histories of the HA and
internal genes are therefore partially independent, although the
HA and PB1 from Delaware Bay show a higher level of similarity.
To evaluate evolutionary dynamics and migration patterns of
H3 subtype viruses throughout North America we identified
viruses from avian hosts sampled in 20 defined discrete geographic
regions excluding those sequences with recently introduced from
Eurasia as described above (ntax = 437). The tMRCA of Lineages
I and II was estimated to be ,1942 (95% Bayesian Credibility
Interval 1926–1962). The mechanism for maintenance of this deep
divergence remains unknown, as viruses from both lineages have
co-circulated in geographically overlapping host populations,
primarily Anseriformes, throughout the entire surveillance period.
One possibility is that this deep divergence is the product of (i) a
very large host meta-population and (ii) relatively rare cross-species
transmission rate when compared to annual seasonal epidemic
dynamics leading to a lack of synchronicity of partial immunity
across host species so that more than one lineage can effectively
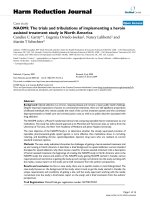
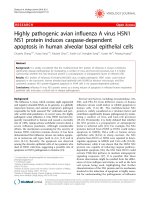
survive long periods of time. Although there was little evidence for
geographic structuring of the virus population over extended
periods, an obvious exception is a single lineage that has circulated
for more than 10 years in birds sampled from Delaware Bay
(Figure 2).
Ancestral state reconstruction of virus geographic location
suggests that the population of Lineage II was localized in
southeast Alberta prior to migrating to other locations across all
North American flyways (Figure 2). However, the apparent
geographic isolation of viruses from Alberta may be an artifact
as sampling in this location began 12 years before other sites.
Furthermore, in Lineage I, where sampling was temporally and
spatially more consistent, we found no evidence of localized
ancestral populations.
We next estimated rates of viral migration between discrete
geographic locations treating each gene as an independent dataset
Author Summary
Despite continuous virological surveillance (1976–2009) in
wild waterfowl (Anseriformes) and shorebirds (Charadriiformes), the ecological and evolutionary dynamics of avian
influenza A virus (AIV) in these hosts is poorly understood.
Comparative genomic analysis of AIV data revealed that
the high prevalence of Charadriiformes infected in Delaware Bay is a reservoir of AIV that is phylogenetically
distinct from AIV sampled from most North American
Anseriformes. In contrast, influenza viruses sampled from
Anseriformes in Alberta are representative of the remaining
AIV diversity sampled across North America. While AIV may
be restricted to specific migratory flyways over short time
frames, our large-scale analysis showed that this population genetic structure was transient and the long-term
persistence of AIV was independent of bird flyways. These
results suggest an introduced virus lineage may initially be
restricted to one flyway, but migration to a major
congregation site such as Alberta could occur followed
by subsequent spread across flyways. These generalized
predictions for virus movement will be critical to assess the
associated risk for widespread diffusion and inform
surveillance for pandemic preparedness.
the North American bird population there is little information
regarding how that virus may behave or diffuse between spatially
distant migratory bird populations.
The prediction of viral spread and disease emergence, as well as
formulation of preparedness plans has generally been based on ad
hoc approaches. This is largely due to a critical lack of knowledge of
viral movements between different host populations [13–17]. The
patterns of viral spread and subsequent risk posed by wild bird
viruses therefore remain unpredictable. Methodological advances
present an opportunity for large-scale assessment of spatiotemporal patterns of viral movement between migrating bird populations.
In this study we identified 20 discrete regions in North America
where influenza viruses have been systematically collected from
wild birds to determine whether the viral population was
structured according to host migratory flyways, and rates of gene
flow between these populations. Avian influenza viruses were
isolated annually throughout our surveillance in Alberta, Canada
and Delaware Bay, USA and an additional 287 genomes were
sequenced. Using full genome data we characterize the reassortment dynamics, spatial diffusion patterns and evolutionary
genomics of influenza A viruses in North America collected over
a 25-year period from migratory birds.
Results
Avian influenza H3 viruses were among the most frequently
isolated influenza subtype from our surveillance in Alberta,
Canada and Delaware Bay, USA [17]. We therefore randomly
selected 200 H3 subtype isolates collected from 1976 to 2009 –
plus an additional 100 influenza isolates of multiple subtypes – for
full genome sequencing. Thirteen isolates could not be sequenced
and a number of additional isolates were mixed samples
containing multiple subtypes. As a result, 163 H3 subtype viruses
and 124 isolates of other subtypes were sequenced. The newly
sequenced H3-HA genes were analyzed with publically available
H3-HA data to estimate the phylogenetic history (number of taxa
(ntax) = 531). This large scale phylogeny of globally sampled H3
viruses from wild birds revealed three major lineages, two
PLOS Pathogens | www.plospathogens.org
2
August 2013 | Volume 9 | Issue 8 | e1003570
Spatial Diffusion of Avian Influenza A Virus
Figure 1. A) H3-HA phylogenetic tree for isolates from Alberta. B) H3-HA phylogenetic tree for isolates from Delaware Bay. C) H3-HA
phylogenetic tree for isolates from Alaska. D) Multidimensional scaling of tree-to-tree TMRCA estimates from Alberta. For reference, the space
occupied by human H3N2 viruses from similar analysis is centered (grey circle). E) Multidimensional scaling of tree-to-tree patristic distance from
Delaware Bay. F) Multidimensional scaling of tree-to-tree patristic distance from Alaska.
doi:10.1371/journal.ppat.1003570.g001
PLOS Pathogens | www.plospathogens.org
3
August 2013 | Volume 9 | Issue 8 | e1003570
Spatial Diffusion of Avian Influenza A Virus
PLOS Pathogens | www.plospathogens.org
4
August 2013 | Volume 9 | Issue 8 | e1003570
Spatial Diffusion of Avian Influenza A Virus
Figure 2. Bayesian relaxed clock HA gene phylogenetic tree from all H3 wild bird isolates in North America. The two co-circulating
North American lineages (I and II) are annotated to the right of the tree. Branches are colored according to ancestral state location estimated from
geographical tip-state observations for all observed localities.
doi:10.1371/journal.ppat.1003570.g002
We show that our surveillance within Alberta, which includes
convergence points for all four migratory flyways [28,29], is
capturing the majority of genetic diversity of the North American
influenza gene pool. Breeding birds converging in this region
facilitate the spread and generation of influenza virus genetic
diversity indicating the importance of Anseriformes’ social behavior
in persistence of the virus population.
The site at Delaware Bay has been identified as a hotspot for
avian influenza A viruses [30], where hundreds of thousands of
migrating Charadriiformes stopover annually to feed in highly dense
congregations. Our results showed limited genetic diversity
coupled with high prevalence of infection indicating an epizootic
in Charadriiformes that does not play a significant role in the shaping
the sampled AIV diversity within North American Anseriformes.
Even though this hotspot is not representative of gene pool
diversity, these viruses are ultimately derived from the same
population of viruses common throughout North America. The
transmission of viruses between populations of birds is most likely
occurring where migratory Anseriformes and Charadriiformes commingle, possibly in South and Central America or Arctic breeding
grounds. The role of Charadriiformes in the persistence and
transmission of influenza A viruses therefore warrants further
study, especially on a more comprehensive spatial scale.
We show that the long-term persistence of the influenza A virus
gene pool in North American wild birds may be independent of
migratory flyways. Although virus migration could be restricted
within a flyway over short time periods, our results show strong
support for longer-term lateral diffusion of viral lineages between
host populations. In our study, data points were not assigned to a
flyway but discrete sites were assigned and used to inform within
and between flyway migration rates using tip-dated time-dependent phylogenetic reconstructions. While this does contradict
previous work by Lam et al [27], which suggested that migratory
flyways and distance might represent a barrier for migration, both
studies show that migration between flyways does occur [27]. Our
study shows that the short-term evolutionary consequences of
these ecological barriers may be rapidly erased by East-West virus
migration, and that such diffusion may be critical for the survival
and persistence of novel virus lineages introduced to North
American wild birds.
Subtype specific host distribution, geographic state definition
and host ecology may also be a source for the differences observed
between the two studies [27]. While we found no correlation
between distance migrated and rate of migration, analysis of the
H3-HA indicated that subtype specific diffusion patterns might be
different. In turn this may be related to host specificity of H3
viruses. Furthermore, in our study we cannot detect migration
events where the distance migrated is less than 400 km due to the
definition we used for geographic states (59659 latitude-longitude
square).
The data used in our analysis included collections from resident
and short distance migratory birds [31]. This data was unavailable
to Lam et al [27], and may further account for the observed
differences. In our study we assume that virus migration was the
same regardless of host. This assumption may be valid when
analyzing viruses from all hosts in a single analysis, it is unlikely to
be justified when considering specific hosts. Flyways are often
applied universally to all hosts, whereas there are clear differences
to capitalize on the extra historical information generated by
genetic reassortment. While each gene segment analysed supported lateral diffusion between migratory flyways over time, analysis
of migration paths using single gene segments yielded contradictory answers (Figure S2, S3, S4, S5, S6, S7, S8). For example, the
PB1 gene analysis highly supported migration events within the
Pacific flyways, although none of the other gene segment analyses
did (Figure S4). This is probably a reflection of the high rates of
reassortment unlinking the evolutionary history of individual gene
segments between subtypes.
We further analyzed all publically available PA, PB1, PB2, NP
and M sequence data from wild aquatic birds isolated between
1985–2009 in North America. The HA, NA and NS gene
segments were not included in this analysis due to the deep
divergence between the subtypes [16]. In this analysis we defined
16 geographic states and a 17th state termed ‘‘Other’’, that
maintained phylogenetic tree structure. The ‘‘Other’’ state
included taxa isolated prior to 1998 where few geographic
locations were sampled and locations where few isolates were
encountered over the surveillance period [27]. This analysis
included more than 1300 sequences for each gene. The migration
pattern was jointly estimated from all gene datasets in a single
analysis even though the taxon number and subtype between each
gene dataset was not identical. The phylogenetic tree space was
sampled independently for each dataset, but we assumed the
migration parameters were linked. These parameters were
estimated across all gene trees to elucidate the migration history
of the avian influenza population in North American wild birds
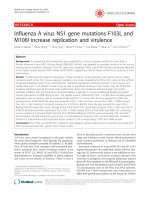
and showed similar levels of within versus between flyway
migration rates (Figure 3). This was confirmed by statistical
comparison of these rates, which showed no significant difference
in diffusion patterns (mean within flyway rate.mean between
flyway rate, Bayes factor (BF) = 0.968; mean between flyway
rate.mean within flyway rate, BF = 1.033).
Table 1 shows the mean migration rates for all statistically
supported state transitions recovered from our analysis. The
diffusion patterns recovered from this analysis show that when all
subtypes, hosts and locations are considered there is extensive
mixing of influenza A virus between populations (Figure 4).
However, it is unlikely that this pattern can be generalized for
individual subtypes. For example, analysis of H3-HA gene
segments with the six other internal gene segments (excluding
NA) showed greater within flyway migration compared to between
flyway migration (Figure S2, S3, S4, S5, S6, S7, S8, S10).
Surprisingly, we could not reject the null hypothesis that migration
rates are unrelated to the distance between locations (Pearson
correlation coefficient = 20.037; Mantel test of rates vs distance,
p = 0.317, Figure S10). However, the large-scale spatial diffusion
and persistence of AIV is facilitated by comingling of birds in
congregation sites located where multiple flyways overlap, such as
Alberta (Figure 4). Taken together these results suggest that the
AIV population mixes extensively and rapidly despite large
geographic separation between sampling locations.
Discussion
Our goal was to understand the migration dynamics and
diffusion patterns of influenza virus in their natural hosts by
utilizing over 30 years of continuous systematic surveillance data.
PLOS Pathogens | www.plospathogens.org
5
August 2013 | Volume 9 | Issue 8 | e1003570
Spatial Diffusion of Avian Influenza A Virus
Figure 3. A) Mean migration rate per MCMC step within flyway migration rates vs Mean between flyway migration jointly
estimated from all publically available PA, PB1, PB2, NP and M gene segments. B) Density distribution of mean within flyway and mean
between flyway rates.
doi:10.1371/journal.ppat.1003570.g003
PLOS Pathogens | www.plospathogens.org
6
August 2013 | Volume 9 | Issue 8 | e1003570
Spatial Diffusion of Avian Influenza A Virus
Table 1. Statistically supported state transitions indicating migratory events.
Transition Between y
Distance in km
Median Rate
Mean Rate
Mean indicator{
Bayes Factor*
Ontario-Ohio
Texas
1991
7.46
7.64
1
.100
Alaska
NW Alberta
1619
2.57
2.68
1
.100
New Brunswick
Delaware Bay
1359
1.44
1.51
1
.100
British Columbia
SE Alberta
713
1.37
1.41
1
.100
Ontario-Ohio
Delaware Bay
715
1.19
1.24
0.77
29
13
Alaska
New Brunswick
4797
1.01
1.11
0.6
Oregon
California
556
0.93
0.97
1
.100
Quebec-NY State
Texas
2665
0.87
0.87
0.61
13
SE Alberta
Ontario-Ohio
2514
0.77
0.8
0.85
47
British Columbia
Ontario-Ohio
3141
0.69
0.71
0.52
10
British Columbia
California
1390
0.63
0.65
1
.100
Quebec-NY State
Mississippi-Louisiana
2009
0.63
0.64
1
.100
Quebec-NY State
Delaware Bay
858
0.57
0.59
1
.100
Ontario-Ohio
Mississippi-Louisiana
1373
0.49
0.51
0.99
.100
Delaware Bay
Mississippi-Louisiana
1432
0.4
0.42
1
.100
NW Alberta
Quebec-NY State
3188
0.39
0.4
1
.100
Quebec-NY State
New Brunswick
616
0.25
0.26
1
.100
British Columbia
SW Alberta
749
0.18
0.19
1
.100
California
Quebec-NY State
4029
0.13
0.14
1
.100
SW Alberta
Ontario-Ohio
2447
0.12
0.13
0.74
25
y
State Transition between the ‘‘Other’’ and Texas was supported once in our analysis (BF = 64, I = 88) likely due to the broad taxonomic sampling included in the ‘‘Other’’
state and phylogenetic uncertainty in estimating migration.
{
The indicator is the posterior probability of observing non-zero migration rates in the Bayesian sampled trees.
*Bayes factor greater than 6 with indicator value greater than 0.50 was the minimum criteria for significance; 6#BF,10 statistically significant; 10#BF,30 strong
statistical support; 30#BF,100 very strongly supported; BF$100 decisive.
doi:10.1371/journal.ppat.1003570.t001
Delaware Bay (Delaware and New Jersey) since 1985. Ducks were
sampled post-breeding and prior to southern migration during July
through early September at various wetlands in the following
regions of Alberta: Vermilion (1976–1978), Grand Prairie/Fairview (1979–1984, 1992–2011), Edmonton/Stettler (1979, 1981,
1983–2009), Brooks (1992–1995), and High River (1993–2000,
2002–2003, 2005–2007). Sampling occurred during duck banding
operations conducted by the Canadian Wildlife Service after ducks
were captured in swim-in bait traps. Birds banded in Alberta have
been recovered in all four North American flyways but most
mallards are recovered in the Central and pacific flyways. In 1984
samples were also collected from ducks captured in decoy traps
during late April to early May in the Vermilion area. Overall, the
majority of samples were obtained as cloacal swabs (n = 18,057)
and tracheal/oropharyngeal specimens accounted for most of the
remaining samples (n = 1,641; 1,293 of the oral swabs being
collected since 2007). Hatch-year ducks were sampled more
frequently than after-hatch-year ducks (n = 11,923 versus 7,559,
respectively). A variety of duck species were sampled – primarily
dabbling ducks. The most abundantly sampled species are mallard
(Anas platyrhynchos), northern pintail (Anas acuta), and blue-winged
teal (Anas discors) with these three species accounting for 93% of the
total specimens. Other species (listed in decreasing rank order of
samples obtained) include redhead (Aythya americana), green-winged
teal (Anas crecca), american wigeon (Anas americana), gadwall (Anas
strepera), canvasback (Aythya valisineria), lesser scaup (Aythya affinis),
american coot (Fulica americana), northern shoveler (Anas clypeata),
bufflehead (Bucephala albeola), cinnamon teal (Anas cyanoptera),
common goldeneye (Bucephala clangula), ruddy duck (Oxyura
in the behavior and ecological habits of different hosts (see
supporting information Text S1).
Using our model for virus transmission generalized predictions
for movement of an introduced Eurasian virus and the associated
risk for widespread diffusion can be inferred. An introduced virus
lineage to Alaska might initially be restricted to the Pacific Flyway,
but migration to a major congregation site such as Alberta could
occur with subsequent spread across flyways occurring shortly
after. While the establishment of introduced lineages into North
America may be rare, introduction and reassortment events with
Eurasian and North American strains probably occur more
frequently than detected [16,17,32].
The development of fully resolved ecological and viral risk
models depend upon the continued long-term active surveillance
in major bird congregation zones. While the resolution and
detection of migration events has been enhanced with increased
surveillance in recent years, critical information for wild bird
surveillance remains sparse. This is especially evident as no
sampling in Central and South America was available for this
study. A comprehensive understanding of spatial diffusion patterns
of viruses introduced to wild animal populations is critical for the
development of preparedness plans in response to emerging viral
threats.
Materials and Methods
Sampling, virus isolation and sequencing
Systematic influenza surveillance has been conducted in ducks
in Alberta, Canada since 1976, and in shorebirds and gulls at
PLOS Pathogens | www.plospathogens.org
7
August 2013 | Volume 9 | Issue 8 | e1003570
Spatial Diffusion of Avian Influenza A Virus
Figure 4. Patterns of viral migration jointly estimated across the 5 internal protein gene segments. Lines connecting discrete regions
indicate statistically supported ancestral state changes and are thickened according to statistical support. There are five categories of support. The
thinnest lines indicate 6#BF,10 (supported); 10#BF,30 (strong support); 30#BF,100 (very strong support) and the thickest lines with BF#100
(decisive support). Dashed lines indicate statistical supports between 3#BF,6 but with posterior probabilities ,0.5.
doi:10.1371/journal.ppat.1003570.g004
jamaicensis), greater scaup (Aythya marila), hooded merganser
(Lophodytes cucullatus), and wood duck (Aix sponsa).
Fecal samples from Charadriiformes – shorebirds and gulls were collected in May at Delaware Bay from ruddy turnstone
(Arenaria interpres), red knot (Calidiris canutus), semipalmated
sandpiper (Calidris pusilla), sanderling (Calidiris alba), and dunlin
(Calidris alpina) starting in 1985 and continuing to the present.
Samples were also obtained from breeding colonies of gulls –
primarily laughing gull (Larus atricilla) and herring gull (Larus
argentatus). It is during this period in May that shorebirds
(waders) are migrating north from South America to their
breeding grounds in the Canadian Arctic. Delaware Bay serves
as a stopover point where the birds can re-fuel on the
abundance of eggs deposited by the coincident spawning of
horseshoe crabs (Limulus polyphemus).
Although most of the 10,350 samples obtained were from
freshly deposited feces on beaches we also collected 213 cloacal
swabs from captured birds spanning the years 1986–1989 and
2000. A subset of 440 samples was collected outside of the May
surveillance period at the following times; September 1985,
September and November 1986, and June-September 1988. It
should be noted that from 1988 through 2002 multiple swabs
(usually 3) were combined to constitute a single sample vial. In the
years prior to 1988 most sample vials contained an individual
swab, and all samples since 2003 have been from single fecal
deposits.
Approximately 19 sample sites were established around
Delaware Bay and varied from year-to-year. Six sites were used
on the west side of Delaware Bay in Maryland and Delaware from
1985 through 1989. Sampling was performed at 13 sites on the
east side of the bay in New Jersey in all years. Table S1
summarizes prevalence and bird population estimates from
PLOS Pathogens | www.plospathogens.org
Delaware Bay, the Prairie pothole region and the central flyway
[33–37].
The majority of the swabs were derived from fecal deposits and
therefore it was not possible to identify the species that served as
the source of the sample in over half of the specimens. However,
the birds tend to congregate in groups of like species, and gull feces
were easily discriminated from other bird droppings, therefore in
many instances we could attribute the source of the sample to a
particular species. Otherwise the sample was considered ‘‘shorebird’’ or ‘‘gull’’.
Swabs were collected using a dacron tipped applicator and
placed in transport medium containing 50% phosphate buffered
saline and 50% glycerol adjusted to pH 7.2 and supplemented
with penicillin G, streptomycin, polymyxin B, gentamycin, and
nystatin. In Alberta the duck swabs were placed immediately in
liquid nitrogen and returned to the laboratory. Shorebird samples
from Delaware Bay were immediately placed on ice and shipped
to the laboratory within 6 days of collection. Storage of the
specimens prior to testing was at 270uC.
Viruses were isolated in 10-day-old embryonated chicken eggs
as previously described [38,39]. Virus subtypes were determined
by antigenic analysis in hemagglutination inhibition tests [38],
neuraminidase inhibition tests, and/or by RT-PCR [40] and
sequence analysis.
Through exploratory examination of surveillance records from
Alberta and Delaware Bay we determined that H3 subtype viruses
have been most frequently isolated throughout the time period
1985–2009. We therefore focused our sequencing efforts on this
time period and randomly selected 200 viruses for full genome
sequencing. This data was further supplemented with an
additional 100 viruses randomly selected for genomic sequencing
of various subtypes.
8
August 2013 | Volume 9 | Issue 8 | e1003570
Spatial Diffusion of Avian Influenza A Virus
included in the analysis due to the deep divergence between NA
subtypes, while distribution of locations and time was sparse or
inconsistent for individual NA genes. However, H3-HA gene
sequences were sampled throughout North America and we
therefore analyzed all H3-HA gene sequences isolated from wild
aquatic birds (ntax = 437).
We used time-stamped sequence data with a relaxed-clock
Bayesian Markov chain Monte Carlo method as implemented in
BEAST v1.6.2 and BEAST 2 for phylogenetic analysis [44,45].
For all analyses we used the uncorrelated lognormal relaxed
molecular clock to accommodate variation in molecular evolutionary rate amongst lineages, the SRD06 codon position model,
with a different rate of nucleotide substitution for the 1st plus 2nd
versus the 3rd codon position, and the HKY85 substitution model
then applied to these codon divisions [46]. This analysis was
conducted with a time-aware linear Bayesian skyride coalescent
tree prior over the unknown tree space with relatively uninformative priors on all model parameters a normal prior on the mean
skyride size (log units) of 11.0 (standard deviation 1.8) [47]. We
performed three independent analyses of 50 million generations.
These analyses were combined after the removal of an appropriate
burn-in (10%–20% of the samples in most cases) with 5000
generations sampled from each run for a total of 15,000 trees and
parameter estimates.
We further compared relative genetic diversity and reassortment patterns of viral isolates from Alberta and Delaware Bay by
estimating phylogenies as described above for these populations
independently.
All samples were sequenced using a high-throughput NextGeneration sequencing pipeline at the JCVI that includes the 454/
Roche GS-FLX and the Illumina HiSeq 2000. Viral RNA was
first reverse transcribed and amplified by multi-segment RT-PCR
(M-RTPCR) [41], which simultaneously and specifically amplifies
all influenza A virus segments in a single reaction, irrespective of
the virus subtype. The amplicons were barcoded and amplified
using an optimized SISPA protocol [42]. Barcoded amplicons
were quantitated, pooled and size selected (,800 bp or ,200 bp)
and the pools were used for Next Generation library construction
(50–100 viruses/library).
One library was prepared for sequencing on the 454/Roche
GS-FLX platform using Titanium chemistry while the other was
made into a library for sequencing on the Illumina HiSeq 2000.
The sequence reads from the 454/Roche GS-FLX data were
sorted by barcode, binned by sample, trimmed, searched by
TBLASTX against custom nucleotide databases of full-length
influenza A segments downloaded from GenBank to filter out both
chimeric influenza sequences and non-influenza sequences amplified during the random hexamer-primed amplification. For each
sample, the filtered 454/Roche GS-FLX reads were then binned
by segment, and de novo assembled using CLC Bio’s clc_novo_assemble program. The resulting contigs were searched against
the corresponding custom full-length influenza segment nucleotide
database to find the closest reference sequence for each segment.
Because of the short read length of the sequences obtained from
the barcode-trimmed Illumina, HiSeq 2000 these were not
subjected to the TBLASTX filtering step. Both 454/Roche GSFLX and Illumina HiSeq 2000 reads were then mapped to the
selected reference influenza A virus segments using the clc_
ref_assemble_long program.
At loci where both GS-FLX and Illumina sequence data agreed
on a variation (as compared to the reference sequence), the
reference sequence was updated to reflect the difference. A final
mapping of all next-generation sequences to the updated reference
sequences was then performed. Any regions of the viral genomes
that were poorly covered or ambiguous after Next Generation
sequencing were PCR amplified and sequenced using standard
Sanger sequencing approach.
Through sequencing, some of these selected viruses have been
identified as more than one isolate (‘‘Mixed’’ in table S3). The
direct sequencing method does not allow us to determine which
internal gene segments are associated with which subtype.
Furthermore, some variants could not yield unique gene sequences
for each potential virus identified. Hence, some mixed variants
contain more than 8 associated sequences, but fewer than 16. As
such, these were not included in the analysis of genomic
reassortment patterns. Other variants could not be completely
sequenced and have subsequently been submitted as ‘‘Draft.’’ Out
of the 300 variants submitted for sequencing, 287 full genomes
have been completed. All data generated for this study has been
made publicly available via the Influenza Virus Resource at NCBI
[43] (Accession numbers CY101081to CY103740).
Estimation of viral migration rates between discrete host
populations using the internal gene sequences
Analysis of migration paths using single gene segments yields
answers that do not have to agree with each other, due to multiple
factors such as sampling bias and/or reassortment. Therefore, we
implemented one inclusive analysis of all genes in which each gene
is treated as an independent dataset, but shares the migration
parameters with all other genes. In order to estimate migration
patterns for a single subtype as well as an average migration
pattern of the entire AIV gene pool we devised two datasets. The
first dataset focused on seven gene segments from H3 influenza A
(excluding NA) as this was the most commonly isolated subtype
throughout the surveillance period in both Alberta and Delaware
Bay. Secondly, we analyzed all publically available PB1, PB2, PA,
NP, M gene segments (excluding recent introductions from
Eurasia) to estimate the viral migration patterns across the entire
population of birds regardless of subtype. HA, NA and NS genes
were not included due to the deep divergence between subtypes.
This latter analysis resulted in a dataset of more than 1300
sequences for each of the five genes included.
While the phylogeny and substitution rates were separate for
each gene, based on a joint migration process a single migration
matrix was estimated. We used a reversible continuous-time
Markov chain model to estimate the migration rates between
geographical regions and the general patterns of avian influenza A
virus circulation in different populations [48]. In these analyses we
used a constant-population coalescent process prior over the
phylogenies and uncorrelated lognormal relaxed molecular clocks.
Here we identified 16 discrete geographic regions, based on
observed sampling locations, estimated from a 59659 latitudelongitude square (Supporting Data Files; File S1, Table S2, S3,
Figure S12), plus an additional character state containing taxa
isolated prior to 1998 and locations with fewer than four sequences
isolated. We selected discrete geographic sites based on the grid
instead of assigning taxa to discrete flyways as these vary to a large
Bayesian phylogenetic and coalescent analysis
We analyzed 1441 genomic sequences of influenza A viruses in
wild birds (Table S2 shows NCBI accession numbers). For each
dataset prepared we removed all recent introductions from Eurasia
and focused this study solely on viral gene segments that have been
circulating in North America for the last 25 years. Each internal
gene dataset contained .1300 sequences. While no whole
genomes with Eurasian origins were evident in the datasets
examined, numerous reassortant genes with recent Eurasian
ancestry were detected. The neuraminidase (NA) gene was not
PLOS Pathogens | www.plospathogens.org
9
August 2013 | Volume 9 | Issue 8 | e1003570
Spatial Diffusion of Avian Influenza A Virus
degree between potential host populations and overlap between
geographic zones. By defining the discrete characters in such a
manner we were able to group a number of sampling sites and
establish a parameter limit that could be addressed by the data
available. A limitation of this approach is that migration rates
between locations less than 400 km could not be detected. The
ancestral states were mapped onto the internal nodes of
phylogenetic trees sampled during the Bayesian analysis (Supporting Data Files; Figures S2, S3, S4, S5, S6, S7, S8). Given the large
number of states, a Bayesian stochastic search variable selection
(BSSVS) was employed to reduce the number of parameters to
those with significantly non-zero transition rates [48]. The BSSVS
explores and efficiently reduces the state space by employing a
binary indicator (I) [48]. From the BSSVS results, a Bayes factor
(BF) test can be applied to assess the support for individual
transitions between discrete geographic states. The BF was
deemed statistically significant where I.0.5 and the BF.6 from
the combined independent analyses. Therefore our minimal
critical cutoff for statistical supports were 6#BF, 10 indicating
substantial support, 10#BF,30 indicating strong support,
30#BF,100 indicates very strong support and BF.100 indicating decisive support [48–50]. Within flyway rate estimates were
compared with between flyway rate estimates to determine if
migration of the viral population was structured by flyway. The
Pearson correlation coefficient and the Mantel statistical test of
correlation (100000 permutations) were conducted to test correlation between migration rate and distance between sites.
Ethics statement
All animal experiments were performed following Protocol
Number 081 approved on August 19, 2011 by the St. Jude
Children’s Research Hospital Institutional Animal Care and
Use Committee in compliance with the Guide for the Care and
Use of Laboratory Animals, 8th Ed. These guidelines were
established by the Institute of Laboratory Animal Resources and
approved by the Governing Board of the U.S. National
Research Council.
Supporting Information
Figure S1 Neighbor joining phylogenetic tree produced from an
HKY85 nucleotide substitution model optimized distance matrix
from all available H3-HA data, including sequences generated in
this study. The major lineages; Oceania, Eurasia, and North
American Lineages I and II are indicated to the right of the tree.
Bootstrap supports for these major lineages are indicated on the
tree. The scale bar indicates nucleotide substitutions/site.
(PDF)
Figure S2 H3 Hemagglutinin gene tree nexus file. Temporally
structured maximum clade credibility phylogenetic tree showing
the mixing of avian influenza A virus isolated from North
American wild birds for each individual gene dataset. Ancestral
state changes recovered from the discrete phylogeographic
analyses are indicated by color changes at tree nodes. Purple bars
on nodes indicated 95% confidence intervals of date estimates.
Trees with taxon labels and node annotations can be viewed in
FigTree (available from />Also applies to figures S3, S4, S5, S6, S7, S8.
(TREE)
Statistical comparison of genomic phylogenies for
reassortment
We used multidimensional scaling plots to visually assess the
strength of reassortment in Alberta and Delaware Bay. In this
analysis the tree-to-tree variation in branch lengths is visualized
as a cloud of points where the centroid of the cloud represents
the mean from the 500 trees used in the analysis. Here we
assume that gene segments with similar evolutionary histories
will occupy the similar locations in the 2-dimensional Euclidean
space where the cloud of points should overlap. We used two
metrics to assess the degree of reassortment of the influenza A
virus populations in the two discrete sampling regions: the time
to the most recent common ancestor (tMRCA) or patristic
distances calculated from a posterior distribution of trees. From
a posterior distribution of phylogenetic trees we estimated the
tMRCA for influenza A viruses sampled in each location from
each gene during each year and computed the correlation
coefficient of the tMRCAs between each pair of trees. This
method of tree to tree comparisons has been applied to seasonal
influenza A viruses [26] where the uncertainty of the phylogenetic history in the Bayesian posterior sampling of trees for each
influenza A gene segments was compared using the tMRCA
estimated for annual seasonal influenza A virus outbreaks in two
geographic locations.
In our data sets there was a sparseness of sampling through
time, especially in Delaware Bay. Therefore we encountered high
levels of uncertainty where no clear pattern was discernable and
zero distances between trees resulted in computational errors by
using the tMRCA to estimate phylogenetic uncertainty between
gene trees. To overcome this we computed the correlation matrix
of the pairwise tree distances. Here we calculated the correlation
coefficient for each pair of trees using the patristic distances
between every taxon, where the patristic distance is the sum of
branch lengths between two nodes. The dissimilarity matrix was
obtained by calculating one minus the correlation matrix.
PLOS Pathogens | www.plospathogens.org
Figure S3
PB2 gene tree nexus file.
(TREE)
Figure S4
PB1 gene tree nexus file.
(TREE)
Figure S5
PA gene tree nexus file.
(TREE)
Figure S6
NP gene tree nexus file.
(TREE)
Figure S7
M gene tree nexus file.
(TREE)
Figure S8
NS gene tree nexus file.
(TREE)
Figure S9 A) Mean migration rate per MCMC step within
flyway migration rates vs Mean between flyway migration jointly
estimated from a subsampled dataset of Figure S9 including 20
isolates per year and all H3 sequences available; B) Density
distribution of mean within flyway and mean between flyway rates.
(PDF)
Figure S10 Relationship of migration rate and distance. A)
Mean statistically supported rates vs distance between discrete
migration sites; B) Median statistically supported rates vs distance
between discrete migration sites; C) All Mean migration rates vs
distance between discrete migration sites; D) All Median rate
indicator vs distance between discrete migration sites.
(PDF)
Figure S11 Interactive Google Earth Supplementary Data.
GenBank Accession numbers and specific location of virus
sampling for all sequences used in this study in the 5u Latitude
10
August 2013 | Volume 9 | Issue 8 | e1003570
Spatial Diffusion of Avian Influenza A Virus
by 5u Longitude square used to define the discrete character for
ancestral state reconstruction.
(KML)
Research and Surveillance North American wild bird surveillance
efforts reporting from 2007.
(DOC)
Figure S12 PB2 gene tree nexus file used to estimate joint
migration. Interactive Tree files. Temporally structured maximum
clade credibility phylogenetic tree with all available data used to
jointly estimate the migration patterns summarized in Figure 4.
Ancestral state changes recovered from the discrete phylogeographic analyses are indicated by color changes at tree nodes.
Purple bars on nodes indicated 95% confidence intervals of date
estimates. Trees with taxon labels and node annotations can be
viewed in FigTree (available from />software/figtree/). Also applies to figures S13, S14, S15, S16.
(TREE)
Table S2
Figure S13
GenBank Accession numbers, isolation date and
location of virus sampling for additional sequences from public
databases used in this study.
(DOC)
Table S3 Associated geographic metadata and exact date of
sampling of newly sequenced avian influenza A viruses.
(DOC)
Table S4 Number of taxa included per protein coding region to
estimate average migration dynamics between discrete regions.
(DOC)
PB1 gene tree nexus file used to estimate joint
Text S1
migration.
(TREE)
Figure S14
PA gene tree nexus file used to estimate joint
Acknowledgments
migration.
(TREE)
Figure S15
The authors would like to thank Amanda D. Dey from the Endangered
and Nongame Species Program, New Jersey Division of Fish and Wildlife
for assistance in issuing surveillance permits. The authors also wish to
acknowledge the contribution of the NeSI high-performance computing
facilities and the staff at the Centre for Research at the University of
Auckland.
NP gene tree nexus file used to estimate joint
migration.
(TREE)
Figure S16
Supplementary information describing flyways and bird
behavior.
(DOC)
M gene tree nexus file used to estimate joint
migration.
(TREE)
Author Contributions
File S1 BEAST2 executable xml file detailing the parameters for
Conceived and designed the experiments: JB SK GJDS RGW. Performed
the experiments: JB SK AD DEW DK MF. Analyzed the data: JB AJD
DK SK GJDS RGW MF IHM RJW. Contributed reagents/materials/
analysis tools: GR SPP LJN YCFS VGD RAH TBS DEW AJD DW.
Wrote the paper: JB SK MF IHM AJD DEW GJDS RGW. Programing
for joint estimation of migration rates in BEAST: AJD DK. Programming
for statistical comparison of tree congruence for assessing reassortment:
MF.
the joint estimation of the single migration rate matrix from
independently generated phylogenies (BEAST2 available from
/>(TXT)
Table S1 Host Avifauna most frequently infected with influenza
A virus summarized from the Centers of Excellence for Influenza
References
1. Webster RG, Bean WJ, Gorman OT, Chambers TM, Kawaoka Y (1992)
Evolution and ecology of influenza A viruses. Microb Rev. 56: 152–179.
2. Vijaykrishna D, Bahl J, Riley S, Duan L, Zhang J, et al. (2008) Evolutionary
dynamics and emergence of panzootic H5N1 influenza viruses. PLoS Pathogens
4: e1000161.
3. Smith GJD, Bahl J, Vijaykrishna D, Zhang JX, Poon LLM, et al. (2009) Dating
the emergence of pandemic influenza viruses. Proc Natl Acad Sci USA 106:
11709–12.
4. Duan L, Bahl J, Smith GJD, Wang J, Vijaykrishna D, et al. (2008) The
development and genetic diversity of H5N1 influenza virus in China, 1996–
2006. Virology 380: 243–254.
5. Chen H, Smith GJD, Zhang SY, Qin K, Wang J, et al. (2005) Avian flu: H5N1
virus outbreak in migratory waterfowl. Nature 436: 191–192.
6. Al-Azemi A, Bahl J, Al-Zenki S, Al-Shayji Y, Al-Ahmad S, et al. (2008) Avian
influenza A virus (H5N1) outbreaks, Kuwait, 2007. Emerg Infect Dis 14: 958–
961.
7. Smith GJD, Vijaykrishna D, Ellis TM, Dyrting KC, Leung YHC, et al. (2009)
Characterization of avian influenza viruses A (H5N1) from wild birds, Hong
Kong, 2004–2008. Emerg Infect Dis 15: 402–407.
8. Kim H-R, Lee Y-J, Park C-K, Oem J-K, Lee O-S, et al. (2012) Highly
pathogenic avian influenza (H5N1) outbreaks in wild birds and poultry, South
Korea. Emerg Infect Dis 18: 480–483.
9. Ducatez MF, Tarnagda Z, Tahita MC, Sow A, de Landtsheer S, et al. (2007)
Genetic characterization of HPAI (H5N1) viruses from poultry and wild
vultures, Burkina Faso. Emerg Infect Dis 4: 611–613.
10. Berthold P (2001) Bird migration: a general survey. Oxford ornithology series.
Oxford: Oxford University Press. 266 p.
11. Latorre-Margalef N, Gunnarsson G, Munster VJ, Fouchier RAM, Osterhaus
ADME, et al. (2009) Effects of influenza A virus infection on migrating mallard
ducks. Proc R Soc B 276: 1029–1036.
12. Gunnarsson G, Latorre-Margalef N, Hobson KA, Van Wilgenburg SL, Elmberg
J, et al. (2012) Disease dynamics and bird migration—linking mallards Anas
PLOS Pathogens | www.plospathogens.org
13.
14.
15.
16.
17.
18.
19.
20.
21.
22.
23.
11
platyrhynchos and subtype diversity of the influenza A virus in time and space.
PLoS ONE 7(4): e35679. doi:10.1371/journal.pone.0035679.
Olsen B, Munster VJ, Wallensten A, Waldenstroăm J, Osterhaus ADME, et al.
(2006) Global patterns of influenza A virus in wild birds. Science 312: 384–388.
Krauss S, Webster RG (2010) Avian influenza virus surveillance and wild birds:
past and present. Avian Dis. 54: 394–398.
Obenauer JC, Denson J, Mehta PK, Su X, Mukatira S, et al (2006) Large-scale
sequence analysis of avian influenza isolates. Science 311: 1576–1580.
Dugan VG, Chen R, Spiro DJ, Sengamalay N, Zaborsky J, et al. (2008) The
evolutionary genetics and emergence of avian influenza viruses in wild birds.
PLoS Pathog 4(5): e1000076. doi:10.1371/journal.ppat.1000076.
Krauss S, Obert CA, Franks J, Walker D, Jones K, et al. (2007) Influenza in
migratory birds and evidence of limited intercontinental virus exchange. PLoS
Pathog 3(11): e167. doi:10.1371/journal.ppat.0030167.
Chen H, Smith GJD, Li KS, Wang J, Fan XH, et al. (2006) Establishment of
multiple sublineages of H5N1 influenza virus in Asia: Implications for pandemic
control. Proc Natl Acad Sci USA 103: 2845–2850.
Wilcox BR, Knutsen GA, Berdeen J, Goekjian V, Poulson R, et al. (2011)
Influenza-A viruses in ducks in Northwestern Minnesota: Fine scale spatial and
temporal variation in prevalence and subtype diversity. PLoS ONE 6(9): e24010.
doi:10.1371/journal.pone.0024010
Hoye BJ, Munster VJ, Nishiura H, Klaassen M, Fouchier RAM (2010)
Surveillance of wild birds for avian influenza. Emerg Infect Dis 16: 1827–1834.
Hill NJ, Takekawa JY, Cardona CJ, Meixell BW, Ackerman JT, et al. (2012)
Cross-seasonal patterns of avian influenza virus in breeding and wintering
migratory birds: A flyway perspective. Vector Borne Zoonotic Dis. 12: 243–253.
Pearce JM, Reeves AB, Ramey AM, Hupp JW, Ip HS, et al. (2011) Interspecific
exchange of avian influenza virus genes in Alaska: the influence of transhemispheric migratory tendency and breeding ground sympatry. Mol Ecol 20:
1015–1025.
Ip HS, Flint PL, Franson JC, Dusek RJ, Derksen DV, et al. (2008) Prevalence of
influenza A viruses in wild migratory birds in Alaska: Patterns of variation in
August 2013 | Volume 9 | Issue 8 | e1003570
Spatial Diffusion of Avian Influenza A Virus
24.
25.
26.
27.
28.
29.
30.
31.
32.
33.
34.
35.
36.
detection at a crossroads of intercontinental flyways. Virol J 4: 71. doi:10.1186/
1743-422X-5-71
Makaraova NV, Kaverin NV, Krauss S, Senne D, Webster RG (1999)
Transmission of Eurasian avain H2 influenza virus to shorebirds in North
America. J Gen Virol 80: 3167–3171.
Grenfell BT, Pybus OG, Gog JR, Wood JL, Daly JM, et al. (2004) Unifying the
epidemiological and evolutionary dynamics of pathogens. Science 303: 327–332.
Rambaut A, Pybus OG, Nelson MI, Viboud C, Taubenberger JK, et al. (2008)
The genomic and epidemiological dynamics of human influenza A virus. Nature
453: 615–619.
Lam TT, Ip HS, Ghedin E, Wentworth DE, Halpin RA, et al. (2012) Migratory
flyway and geographical distance are barriers to the gene flow of influenza virus
among North American birds. Ecology Letters 15: 24–33.
U.S. Geological Survey (2006) Migration of Birds: Routes of Migration.
Available: />Accessed 20 June 2012.
U.S. Fish and Wildlife Service (2011) Waterfowl population status, 2011.
Available: />PopulationStatus/Waterfowl/2011WaterfowlStatusReport.pdf. Accessed 20
June 2012.
Krauss S, Stallknecht DE, Negovetich NJ, Niles LJ, Webby RJ, et al. (2010)
Coincident ruddy turnstone migration and horseshoe crab spawning creates an
ecological ‘hot spot’ for influenza viruses. Proc R Soc B 277: 3373–3379.
Hill NJ, Takekawa JY, Ackerman JT, Hobson KA, Herring G, et al. (2012)
Migration strategy affects avian influenza dynamics in Mallards (Anas
platyrhynchos). Molecular Ecology 21: 5986–5999.
Bahl J, Vijaykrishna D, Holmes EC, Smith GJD, Guan Y (2009) Gene flow and
competitive exclusion of avian influenza A virus in natural reservoir hosts.
Virology 390: 289–297.
Squires RB, Noronha J, Hunt V, Garcia-Sastre A, Macken C, et al. (2012)
Influenza research database: an integrated bioinformatics resource for influenza
research and surveillance. Influenza Other Respi Viruses 6: 404–16 DOI:
10.1111/j.1750-2659.2011.00331.x.
Delany S, Scott D (2006) Waterbird Population Estimates, Fourth Edition.
Wageningen, Netherlands: Wetlands International.
U.S. Fish and Wildlife Service (2003) Delaware Bay shorebird-horseshoe crab
assessment report and peer review. U.S. Fish and Wildlife Service Migratory
Bird Publication R9-03/02. 2003 Arlington, VA. 99 p.
Niles LJ, Sitters HP, Dey AD, Arce N, Atkinson PW, et al. (2010) Update to the
status of the red knot Calidris canutus in the western hemisphere. Available:
PLOS Pathogens | www.plospathogens.org
37.
38.
39.
40.
41.
42.
43.
44.
45.
46.
47.
48.
49.
50.
12
Accessed 20
June 2012
Morrison RIG, McCaffery BJ, Gill RE, Skagen SK, Jones SL, et al. (2006)
Population estimates of North American shorebirds, 2006. Wader Study Group
Bull. 111: 67–85.
Palmer DF, Dowdle WR, Coleman MT, Schild GC (1975) Advanced laboratory
techniques for influenza diagnosis. Immunology Series No. 6. Atlanta: United
States Department of Health, Education and Welfare.
Hinshaw VS, Bean WJ, Webster RG, Easterday BC (1978) The prevalence of
influenza viruses in swine and the antigenic and genetic relatedness of influenza
viruses from man and swine. Virol 84: 51–52.
Hoffmann E, Stech J, Guan Y, Webster RG, Perez DR (2001) Universal primer
set for the full-length amplification of all influenza A viruses. Arch Virol 146:
2275–2289.
Zhou B, Donnelly ME, Scholes DT, St George K, Hatta M, et al. (2009) Singlereaction genomic amplification accelerates sequencing and vaccine production
for classical and swine origin human influenza A viruses. J Virol. 83: 10309–
10313.
Djikeng A, Halpin R, Kuzmickas R, Depasse J, Feldblyum J, et al. (2008) Viral
genome sequencing by random priming methods. BMC Genomics. 9: 5.
Bao Y, Bolotoz P, Dernovoy D, Kiryutin B, Zaslavsky L, et al. (2008) The
Influenza Virus Resource at the National Center for Biotechnology Information.
J Virol. 82: 596–601.
Drummond AJ, Ho SYW, Phillips MJ, Rambaut A (2006) Relaxed
phylogenetics and dating with confidence. PLoS Biology. 4: e88.
Drummond AJ, Rambaut A (2007) BEAST: Bayesian evolutionary analysis by
sampling trees. BMC Evolutionary Biology. 7: 214.
Shapiro B, Rambaut A, Drummond AJ (2006) Choosing appropriate
substitution models for the phylogenetic analysis of protein-coding sequences.
Mol Biol Evol. 23: 7–9.
Minin VN, Bloomquist EW, Suchard MA (2008) Smooth skyride through a
rough skyline: Bayesian coalescent-based inference of population dynamics. Mol
Biol Evol 25: 1459–1471.
Lemey P, Rambaut A, Drummond AJ, Suchard MA (2009) Bayesian
phylogeography finds its roots. PLoS Comp Biol. 5: e1000520.
Jeffreys H (1961) The Theory of Probability. Oxford: Oxford Univ. Press.
Bahl J, Nelson MI, Chen R, Ghedin E, Halpin R, et al. (2011) Temporally
structured metapopulation dynamics and persistence of influenza A H3N2 virus
in humans. Proc Nat Acad Sci USA 108: 19359–19364.
August 2013 | Volume 9 | Issue 8 | e1003570
Copyright of PLoS Pathogens is the property of Public Library of Science and its content may
not be copied or emailed to multiple sites or posted to a listserv without the copyright holder's
express written permission. However, users may print, download, or email articles for
individual use.