Báo cáo Y học: The Fe-only nitrogenase and the Mo nitrogenase from Rhodobacter capsulatus A comparative study on the redox properties of the metal clusters present in the dinitrogenase components doc
Bạn đang xem bản rút gọn của tài liệu. Xem và tải ngay bản đầy đủ của tài liệu tại đây (275.54 KB, 12 trang )
The Fe-only nitrogenase and the Mo nitrogenase
from
Rhodobacter capsulatus
A comparative study on the redox properties of the metal clusters
present in the dinitrogenase components
Stefan Siemann*, Klaus Schneider, Melanie Dro¨ ttboom† and Achim Mu¨ ller
Lehrstuhl fu
¨
r Anorganische Chemie I, Fakulta
¨
tfu
¨
r Chemie der Universita
¨
t Bielefeld, Bielefeld, Germany
The dinitrogenase component proteins of the conventional
Mo nitrogenase (MoFe protein) and of the alternative
Fe-only nitrogenase (FeFe protein) were both isolated and
purified from Rhodobacter capsulatus, redox-titrated
according t o t h e same procedures and subjected t o an EPR
spectroscopic comparison. In the course of an oxidative
titration o f the MoFe protein (Rc1
Mo
) t hree significant
S ¼ 1/2 EPR signals deriving from oxidized states of the
P-cluster were detected: (1) a r hombic signal (g ¼ 2.07, 1.96
and 1 .83), w hich showed a bell-shaped redox curve with
midpoint potentials ( E
m
)of)195 mV (appearance) and
)30 mV (disappearance), (2) a n axial sig nal (g
||
¼ 2.00,
g
^
¼ 1.90) with almost identical redox properti es a nd (3) a
second rhombic signal (g ¼ 2.03, 2.00, 1.90) at higher redox
potentials (> 100 mV). While the Ôlow-potentialÕ rhombic
signal and t he axial s ignal have b een both a ttributed to the
one-electron-oxidized P-cluster (P
1+
) present in two con-
formationally different proteins, t he Ôhigh-potentialÕ rhombic
signal has been suggested rather to derive from the P
3+
state.
Upon oxidation, the FeFe p rotein (Rc1
Fe
) exibited three
significant S ¼ 1/2 EPR signals as well. However, the Rc1
Fe
signals strongly deviated from the MoFe protein signals,
suggesting that t hey cannot simply be assigned to different
P-cluster states. (a) The most prominent feature is an
unusually broad s ignal a t g ¼ 2.27 and 2 .06, which proved
to be fully reversible and to c orrelate with c atalytic a ctivity.
The cluster giving rise to this signal appears to be involved in
the transfer of two electrons. The midpoint potentials
determined were: )80 mV (appearance) and 70 mV (dis-
appearance). (b) Under weakly acidic conditions (pH 6.4) a
slightly altered EPR signal occurred. It was characterized by
a shift of the g values to 2.22 and 2.05 and by the appearance
of an additional negative absorption-shaped peak at
g ¼ 1.86. (c) A very narrow rhombic E PR signal at
g ¼ 2.00, 1.98 a nd 1.96 appeared at positiv e redox potentials
(E
m
¼ 80 mV, intensity maximum at 160 mV). Another
novel S ¼ 1/2 signal at g ¼ 1.96, 1.92 and 1 .77 was observed
on further, enzymatic reduction of the d ithionite-reduced
state o f Rc1
Fe
with the dinitrogenase reductase component
(Rc2
Fe
) of t he same enzyme system (turnover conditions in
the presence of N
2
and ATP). When the Rc1
Mo
protein was
treated analogously, neither this Ôturnover signalÕ nor any
other S ¼ 1/2 signal were dete ctable. All Rc1
Fe
-specific EPR
signals detected are discussed and tentatively assigned with
special consideration o f the reference s pectra obtained from
Rc1
Mo
preparations.
Keywords: Fe nitrogenase; FeFe cofactor; FeMo cofactor;
P-cluster; EPR spectroscopy.
Four types o f n itrogenase systems have been demonstrated
to exist in bacteria and archea so far. They have been clearly
shown to b e genetically as well as biochemically distinct.
The fi rst gen etic nitrogen fixation (nif ) s ystem d iscovered i s
responsible for encoding the conventional molybdenum
(Mo)-containing nitrogenase. Two nitrogenase systems are
closely related to the M o nitrogenase, but Mo-independent.
One is the vanadium (V)-dependent nitrogen fixation (vnf )
system encoding a n itrogenase which c ontains V instead of
Mo in the cofactor (vanadium nitrogenase) [1–4], whereas
the other, represented by the alternative nitrogen fixation
(anf ) gene system, encodes a nitrogenase c ontaining neither
Mo, V nor a ny other heterome tal atom [4–9], and has
therefore been designated as the Fe nitrogenase or Fe-only
nitrogenase. Re cently, a heterotrimeric and completely
nif/vnf/anf-independent nitrogenase system has been repor-
tedtooccurinStreptomyces thermoautotrophicus,inwhich
electrons for N
2
reduction are derived from superoxide
oxidation coupled to CO oxidatio n [10].
Correspondence to A. Mu
¨
ller, Lehrstuhl fu
¨
rAnorganischeChemieI,
Fakulta
¨
tfu
¨
r Chemie, Universita
¨
t Bielefeld, Postfach 100131, 33501
Bielefeld, Germany. Fax: + 49 521 1066003,
Tel.: + 49 521 1 066153, E-mail: a.mue
Abbreviations: nif, nitrogen fixation; vnf, vanadium dependent nitro-
gen fixation; anf, alternative nitrogen fixation; FeMoco, iron–molyb-
denum cofactor; FeFeco, iron–iron cofactor; Rc1
Mo
, MoFe protein of
R. capsulatus;Rc1
Fe
,FeFeproteinofR. capsulatus;Rc2
Mo
,Fepro-
tein of the Mo nitrogenase of R. capsulatus;Rc2
Fe
, Fe protein of the
Fe-only nitrogenase of R. capsulatus; EXAFS, extended X-ray
absorption fine struc t ure.
Enzyme: nitrogenase (EC 1.18.6.1).
*Presen t address: Department o f Chemistry, University of Waterloo,
Waterloo, Ontario, Canada.
Presen t address: Transferstelle Umweltbiotechnology,
Ruhr-Univer sita
¨
t Bochum, 447 80 Bochum, G ermany.
(Received 1 9 September 200 1, revised 2 8 December 200 1, accepted
22 January 2002)
Eur. J. Biochem. 269, 1650–1661 (2002) Ó FEBS 2002
The characteristics of Mo, V and Fe nitrogenases have
been reviewed re cently b y Eady [ 3] and S mith [4]. All three
nitrogenase systems consist of two-component proteins, the
dinitrogenase component (MoFe protein, VFe protein,
FeFe protein) and the dinitrogenase-reductase component
(also termed Fe protein with respect to all three types of
nitrogenases). While the M oFe protein consists of four
subunits forming an a
2
b
2
tetramer, the dinitrogenase
proteins of the M o-independent, a lternative nitrogenases,
contain an additional s mall 13–15 kDa subunit to form a n
a
2
b
2
d
2
hexameric structure.
The dinitrogenase component of nitrogenases contains
two types of unique metal clusters, the so-called M -cluster
(FeMo cofactor, FeV cofactor, Fe Fe cofactor), which
represents the site of substrate reduction [11], and the
P-cluster, whose function is li kely to transfer electrons as well
as protons to the cofactor [12]. Based on X-ray crystal
structure analysis of MoFe proteins, the structures of the
FeMo cofactor (Fe
7
MoS
9
/homocitrate) and the P-cluster
(Fe
8
S
7
) have been elucidated [12,13], the specific site(s) of
substrate binding and reduction within the cofactor, how-
ever, still remain a matter of controversial discussion [14–17].
So far, only t hree Fe-only nitrogenases h ave been
genetically (as anf s ystems) as well as biochemically
identified and characterized. These are the enzymes of
Azotobacter vinelandii [5,6], Rhodospirillum rubrum [9] and
Rhodobacter capsulatus [8,18,19], the heterometal-free
N
2
-fixation s ystem f rom the latter organism being t he most
intensively studied.
During the early years of F e nitrogenase r esearch, doubts
were widespread as to whether an Fe-only nitrogenase can
be isolated as an intact, functioning enzyme. These doubts
primarily arose due to the fact t hat preparations of the type
of anf-dependent nitrogenase were, regardless of their origin,
generally characterized by either extremely l ow catalytic
activity [5,6,9,18] or the wrong cofactor (namely the Fe Mo
cofactor) i ncorporated into the alternative d initrogenase
component [6,19]. H owever, a compr ehensive c haracteriza-
tion of the F e-only nitrogenase isolated from R. capsulatus,
which included a detailed comparison with the Mo-contain-
ing nitrogenase from the same organism, showed that: (a) the
Fe nitrogenase components can indeed be isolated and
purified as intact and catalytically active proteins, and
(b) that the FeFe protein definitely does not contain a n
iron–molybdenum cofactor (FeMoco), but a clearly well-
functioning Fe-only cofactor [8]. Relatively high specific
activities have been reported f or N
2
reduction (350 nmol of
NH
3
formed per min per mg p rotein), acetylene reduction
as well as v ery high a ctivities (1300 nmol H
2
Æmin
)1
Æmg
)1
in
an N
2
atmosphere) for the evolution of molecular hydrogen
[8]. It is interesting to note that, particularly in the
simultaneous presence of a second substrate (N
2
or C
2
H
2
in addition to H
+
), t he H
2
production rates w ere d istinctly
higher than the respective activities of the Mo nitrogenase
( sixfold). Samples of such highly active FeFe protein
preparations contained 26 ± 4 Fe atoms per protein
molecule, but neither m olybdenum nor vanadium [8].
A recent
57
Fe-Mo
¨
ssbauer-/Fe-EXAFS study on the FeFe
protein from R. capsulatus provided strong evidence that:
(a) the FeFe cofactor is diamagnetic in the Na
2
S
2
O
4
-
reduced state containing 4Fe
II
and 4Fe
III
centers, and (b) the
main structural feature of the FeMoco, the central trigonal
prismatic arrangement of Fe atoms, is also present in the
FeFe cofactor, thus indicating a s tructural homology
between both cofactor types [20,21].
A definite identification of the Fe-only cofactor by EPR is
still lacking. Nevertheless, based on the results of preceding
investigations [8], the FeFe protein exhibited several inter-
esting and, with respect to the MoFe protein, deviating EPR
spectroscopic properties. (a) Highly active FeFe protein
samples (reduced with Na
2
S
2
O
4
) neither showed a FeMoco-
typical S ¼ 3/2 EPR signal nor any other signal indicative
of a S ¼ 3/2 spin s ystem. Instead they were, in agreement
with the analysis of Mo
¨
ssbauer spectra [21], EPR silent.
(b) A novel S ¼ 1/2 signal ( g ¼ 1.96, 1.92, 1.77) appeared
on dinitrogenase reductase-mediated reduction of the FeFe
protein (turnover conditions). (c) T wo further significant
EPR signals were observed when the FeFe protein was
partially oxidized with K
3
[Fe(CN)
6
] or thionine: an unusu-
ally broad signal centered at g ¼ 2.27 and 2.06 and a very
narrow rhombic signal at g ¼ 2.00, 1.98 and 1.96.
A conclusive assignment of these novel EPR signals to
either the cofactor or the P-cluster has proven elusive due to
the fact that both of these metal clusters present in the
Fe-only n itrogenase are d iamagnetic in the dithionite-
reduced state, but probably become EPR-active upon
oxidation.
In the present work we focused on the identification or
tentative assignment of the most significant EPR signals
detected with FeFe protein samples, by pursuing the
following approach: t he FeFe and the MoFe proteins were
isolated from the s ame organism, samples were prepared
according to the same procedures and subsequently char-
acterized and compared b y E PR spectroscop y, particularly
with respect to their r edox properties.
MATERIALS AND METHODS
Bacterial strains
The o rganisms used were the R. capsulatus wild-type s train
B10S and the Mo-resistant double mutant with a nifHDK
deletion as well as an additional d eletion in t he modABCD
region [19,22]. The products of the l atter genes are involved
in high-affinity molybdenum transport [22].
Growth medium and culture conditions
The growth m edium and culture c onditions applied w ere as
described previously [8].
Purification of nitrogenase proteins
Preparation of cell-free extracts (cell disruption by lysozyme
followed by ultracentrifugation) were performed as des-
cribed by Sch neider et al.[8].Inviewofthedifficultyin
separating the dinitrogenase (Rc1
Mo
) and dinitrogenase
reductase component (Rc2
Mo
) of the Mo nitrogenase
from R. capsulatus by DEAE chromatography, we used
Q-Sepharose (from Pharm acia), a stronger and m ore
effective anion exchanger, for the purification of both the
Fe-only and the Mo nitrogenase components. The column
(internal diameter: 2.5 cm) containing approximately
60 mL gel, was cooled to 8 °C with a cryostat and
equilibrated with Ar-gassed Tris buffer (50 m
M
,pH7.8)
containing NaCl (150 m
M
) and sodium dithionite (2 m
M
).
Ó FEBS 2002 Redox properties of the FeFe protein (Eur. J. Biochem. 269) 1651
The cell-free extract was loaded onto the Q-Sepharose
column, followed by the stepwise elution with approxi-
mately 50–60 mL of NaCl solutions (in equilibration buffer)
of increasing concentrations (200/250/300/350/400 m
M
in
the case of the Mo nitrogenase and 200/250/280/310/340/
400 m
M
in the case of the Fe nitrogenase). The Rc1
Mo
component was e luted w ith 3 00 m
M
NaCl, w h ereas Rc2
Mo
was recovered in the 350 m
M
NaCl fraction. In the case of
theFenitrogenasetheRc2
Fe
component was eluted with
280 m
M
NaCl prior to the recovery of Rc1
Fe
with 330 m
M
NaCl. All nitrogenase component protein s were concentra-
ted t o approximately 8 mL by anaerobic ultrafiltration in a
50-mL chamber equipped with a PM30 Amicon membrane,
and subsequently fu rther c oncentrated to a final volume of
1 mL in a B15 Amicon chamber. B oth dinitrogenase
components, which were of relevance for the present
comparative EPR study (Rc1
Mo
,Rc1
Fe
), were, based on
SDS/PAGE analysis, 90–95% pure.
The protocol previously employed to purify t he MoFe
protein (DEAE chromatography, Sephadex G-150 gel-
filtration) [8] led to a homogeneous preparation w ith
significantly lower protein yield. Because the EPR spectra
of samples obtained from both t he Q-Sepharose and the
DEAE/gel-filtration procedures were indistinguishable, we
preferred the use of the rapid a nd high-yield one-column
method (Q-Sepharose) also for the purification of the MoFe
protein in the present study.
Determination of nitrogenase activity
and protein content
For t he determination of nitrogenase activity the r outine
assay (C
2
H
2
reduction) was employed [8]. Protein was
determined according to B eisenherz et al.[23].
Metal and acid-labile sulfide determinations
The quantitative d etermination of Fe and Mo w as achieved
by inductively coupled plasma mass spectrometry as repor-
ted previously [24]. Fe was additionally d etermined by the
bathophenanthrolin method [2]. Acid-labile sulfide analysis
was performed according t o Chen & Mortenson [25].
Redox titrations
Redox titrations were performed in a modified redox
titration cell s imilar to t hat described by Dutton [26]. The
redox potential was measured with a combined platinum-
Ag/AgCl electrode (PT 4800-M5-S7/80; Mettler T oledo,
Steinbach, Germany) and the achieved potentials were
quoted relative to the standard hydrogen electrode. The
method involved titrating the protein in Hepes buffer
(50 m
M
,pH7.4)at25°C in the presence of the f ollowing
mediators (each at 43 l
M
): 2,6-dichlorophenolindophenol,
phenazine methosulfate, thionine, methylene blue, indigo
trisulfonate, indigo carmine, resorufin, anthraquinone-
2-sulfonate, safranin O, benzyl viologen, methyl viologen.
Prior to the redox titration, the protein sample was
subjected to buffer exchange by gel filtration on Sephadex
G25 e quilibrated w ith 50 m
M
Hepes (pH 7.4) containing
1m
M
Na
2
S
2
O
4
(sodium dithionite). It is pertinent to note
that the reducing agent was not entirely removed from FeFe
protein preparations in view of the lability of the protein
even in the presence of only trace amounts of oxygen [8].
For the sake of direct comparison, MoFe protein samples
were treated under analogous con ditions.
The final sample solution (3 mL) containing 12–14 mg of
protein per mL was adjusted to different redox potentials by
the stepwise addition (0.5 lL) of K
3
[Fe(CN)
6
] (ferricyanide)
as oxidant and Na
2
S
2
O
4
as reductant. After equilibration,
which was usually achieved after 1–2 min, 170-lLsamples
were withdrawn from the solution with a gas-tight syringe,
placed in an EPR t ube and i mmediately frozen in liquid N
2
for EPR spectroscopic measurements.
EPR measurements
EPR (X band) spectra w ere recorded on a B ruker ECS 106
spectrometer equipped with an ECS 041 MR Bruker
microwave bridge and an Oxford Instruments EPR 900
helium flo w cryostat. All spectra were recorded at a
microwave frequency of 9.44 GHz and a field modulation
of 1.0 mT at 100 kHz. Spin quantification was performed
using 10 m
M
CuSO
4
/10 m
M
HCl/2
M
NaClO
4
as an
external standard for integration.
RESULTS
EPR signals from oxidized states of the MoFe protein
In recent years EPR spectroscopic properties have been
reported for several MoFe proteins, mainly focusing on
P-cluster-type signals [27–31]. Based on the notion,
however, that, dependent on the origin, the purification
procedure and the s ample quality ( specific activity),
considerable differences within one class o f enzyme m ay
occur, we did not rely on literature data, but attempted
the direct experimental comparison of the MoFe and the
FeFe protein. We therefore isolated and prepared b oth
proteins not only from the same organism (R. capsulatus)
but also under the same conditions (lysozymatic cell
disruption, Q-Sepharose chromatography, E PR sample
preparation). For EPR experiments, protein samples were
used which displayed approximately m aximal specific
activities, i.e. 250 U (nmol a cetylene reducedÆmin
)1
)
per mg of FeFe protein and 1000–1200 UÆmg
)1
of MoFe
protein (compare [8]).
In the c ourse of thes e s tudies two e xperimental r outes to
obtain d ifferent redox states of the dinitrogenase protein
were p ursued: (a) a rough, stepwise oxidation w ith
K
3
[Fe(CN)
6
] and (b) a redox titration, adjusting the protein
solution to defined potentials i n the presence of redox
mediators.
Stepwise oxidation of the MoFe protein. In its Na
2
S
2
O
4
-
reduced state t he R. capsulatus MoFe protein ( Rc1
Mo
) only
exhibited the characteristic S ¼ 3/2 EPR signal at g ¼ 4.29,
3.67 and 2.01, arising from the cofactor (compare Fig. 6B,
which presents a signal-comparison of the dithionite-
reduced and the turnover state of Rc1
Mo
). In the same
redox state the P-cluster was EPR-silent (P
N
state). Upon
oxidation two significant types of P-cluster signals appeared.
When samples (pH 7.4), reduced with 1 m
M
dithionite,
were supplemented with successively increasing amounts of
K
3
[Fe(CN)
6
], a rhombic S ¼ 1/2 EPR signal at g ¼ 2.07,
1.96 and 1.83 appeared (Fig. 1, spectrum 1). This signal was
1652 S. Siemann et al. (Eur. J. Biochem. 269) Ó FEBS 2002
most prominent w ith 2 m
M
K
3
[Fe(CN)
6
] and d ecreased
again above this concentration. With respect to its shape
and position of the g values, t his signa l appears t o
correspond to the S ¼ 1/2 signal that has been reported
for the partially oxidized MoFe proteins from Klebsiella
pneumoniae (Kp1) and A. vinelandii (Av1
Mo
) [28,30,32].
This type of signal has been interpreted to arise from the 1e
–
oxidized P-cluster (P
1+
)[28].
After the occurrence of an almost EPR-silent intermedi-
ate redox state (spectrum not shown), a second rhombic, but
much more narrow EPR signal at g ¼ 2.03, 2.00 and 1.90
appeared upon further oxidation (Fig. 1, spectrum 2). This
signal reached an intensity maximum with 4 m
M
K
3
[Fe(CN)
6
] and remained unchanged with higher oxidant
concentrations. This result suggests that the cluster giving
rise to this signal cannot be oxidized further und er the
conditions applied. In studies with Av1
Mo
a similar signal,
although much broader and s hifted to distinctly higher
fields (g ¼ 1.97, 1.88, 1.68), has been observed and attrib-
uted to the P-cluster in its 3 e
–
oxidized state [27].
Equilibrium-mediated redox titration of the MoFe pro-
tein. The EPR spectroscopic investigation of Rc1
Mo
sam-
ples (in 50 m
M
Hepes buffer, pH 7.4), which were subjected
to a redox titration in the presence of mediators (see
Materials and methods), yielded in parts agreeing, in other
parts, however, somewhat differing spectral d ata.
In accordance with studies on MoFe proteins from other
organisms (e.g [27]), a midpoint potential (E
m
)of)50 mV
was determined for the S ¼ 3/2 FeMoco signal of Rc1
Mo
(Fig. 2). Above +100 mV the FeMoco signal disappeared
completely.
The EPR signal originating from the 1e
–
oxidized
P-cluster with the central g value a t 1.96 (in the following
designated as ÔP
1+
signalÕ) appeared at )250 mV, reached
an intensity maximum at )120 mV and decreased a gain
with increasing potentials. The bell-shaped redox curve of
the P
1+
signal thus confirms the involvement of the
P-cluster in the transfer of at least two electrons (compare
[27,30]). The midpoint po tentials determined were:
)195 mV (E
m
for appearance of the signal representing
the P
N/1+
transition) and )30 mV (E
m
for disappearance;
P
1+/2+
transition).
In contrast to the pronounced pH dependence of the P
1+
signal caused by the partially oxidized Av1
Mo
protein [30]
(see Discussion), the Rc1
Mo
-induced P
1+
signal was not
significantly influenced by the pH value. T he intensity was
almost identical at pH 6.4 and 7.4 and was still 60% (with
respect to peak height) at pH 8.4. It was, however, a surprise
that, in the course of the redox titration and pH dependence
studies, a new axial S ¼ 1/2 signal in the g ¼ 2region
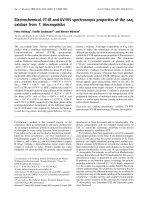
Fig. 1. P-cluster EPR signals of the MoFe protein compared to the EPR
signals detected with the oxidized FeFe protein. TheMoFeprotein
sample contained 2 1 mg protein per mL , 1.9 (± 0 .2) Mo atom s and
27 (± 3) F e atoms per molecule; the Fe Fe protein s ample contained
18 mg protein per mL and 29 (± 3 ) Fe atoms per m olecule. Both
samples were prepared in 50 m
M
Tris (pH 7.4) containing 1 m
M
Na
2
S
2
O
4
. Spectrum 1, MoFe protein, oxidation with 2 m
M
K
3
[Fe(CN)
6
], measured at 16 K; spectrum 2, MoFe protein, oxidation
with 4 m
M
K
3
[Fe(CN)
6
], measured at 16 K; spectrum 3, FeFe protein,
oxidation with 2.5 m
M
K
3
[Fe(CN)
6
], measured at 10 K ; spectrum 4,
FeFe protein, oxidation with 2.5 m
M
K
3
[Fe(CN)
6
], measured at 23 K.
All spectra were recorded at 100 mW.
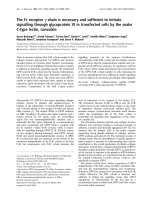
Fig. 2. Redox t itration of the cofactor and P-cluster EPR signals deri-
ving from the MoFe protein o f R. capsulatus. The r edox titration was
performed as described in Materials and methods. The sample con-
tained 12 mg MoFe protein per mL . (d) Redox titration curve of the
FeMo co factor signal. For the determination of relative signal intensity
the resona nce at g ¼ 3.67 was used. Spectra were measured at 4 K and
20 mW. (j) Redox titration curve of the rhombic P-cluster (P
1+
state)
signal. Intensity determination was performed using the g ¼ 1.96
resonance. Spectra were r ecor ded at 16 K and 100 mW.
Ó FEBS 2002 Redox properties of the FeFe protein (Eur. J. Biochem. 269) 1653
(g
||
¼ 2.00, g
^
¼ 1.90) was detected, which showed a
distinctly stronger but, referred to t he P
1+
signal of Av1
Mo
,
opposite pH dependence (Fig. 3). The intensity of this signal
was maximal at pH 8 .4, with no significant change up to
pH 9.0. At pH 7.4 t he signal intensity accounted for
approximately 40% and at pH < 6.5 the signal was absent.
The profile of the entire signal, without interference of the
rhombic s ignal, was obtained by subtracting the pH 6.4-
spectrum from the pH 8.4-spectrum (see the inset of Fig. 3).
The axial signal and the rhombic P
1+
signal differed
significantly with respect to temperature and microwave -
power dependency. The P
1+
signal was most pronounced
around 18 K, the axial signal around 13 K. While the P
1+
signal appeared to be slightly power saturated already above
25 mW, the axial signal remained unsaturated even at
200 m W. However, both signals behaved similarly w ith
respect to their dependence o n the re dox potential. This
observation indicates that the axial signal might arise from
the P
1+
cluster as well, possibly i n a slightly modified
environment (protein conformation). I t is p ertinent to note
that this axial signal is a lso detectable in the spectrum
obtained a fter partial oxidation with K
3
[Fe(CN)
6
] withou t
mediators (at pH 7.4), although with much lower intensity
(data not shown).
The rhombic s ignal a t g ¼ 2.03, 2.00 and 1.90, which
appeared p rominently after oxidation w ith K
3
[Fe(CN)
6
]
(> 4 m
M
) and was proposed to represent t he P
3+
state
(Fig. 1 , spectrum 4), was only n oticeable as a very weak
signal during redox titration (at potentials > 100 mV).
Even excessive amounts of K
3
[Fe(CN)
6
] did not cause a
significant increase in signal inte nsity.
It is interesting to note that S ¼ 5/2 signals, observed in
the case of Av1
Mo
and attributed to the P
1+
state [28], as
well as S ¼ 7/2 signals (P
3+
state) [27] both simultaneously
present with S ¼ 1/2 s ignals (forming so-called spin
mixtures), were not detected in the case o f t he Rho dobacter
enzyme.
At potentials > 0 mV an additional weak signal near
g ¼ 12 was detected (spectrum not shown). In the case of
Av1
Mo
this low fi eld sign al has been attributed to the
2e
–
-oxidized P-cluster (S ¼ 3) [27,30]. An exact determin-
ation of the midpoint potential was, however, not possible
due to the low intensity of this signal ( integer spin system)
under standard EPR conditions (perpendicular m ode).
The two characteristic
S
¼ 1/2 signals of the partially
oxidized FeFe protein
Stepwise oxidation of the FeFe protein. The p rotein
preparations used in this study contained 29 (± 3) Fe and
31 (± 4) acid-labile sulfur atoms. The high Fe/S content
indicates that these FeFe protein (Rc1
Fe
) preparations were
virtually devoid of any significant amounts of inactive
(oxidatively damaged clusters) or incompletely assembled
(vacant cofactor sites) enzyme. It is interesting t o note that
in the case o f dithionite-reduced VFe proteins [3,33] and
also in some instances with MoFe proteins [27,34] both such
protein forms gave ris e to S ¼ 1/2 s ignals. In sharp
contrast, the Rc1
Fe
protein is, in agreement w ith the
preceding report [8], apparently EPR silent in the presence
of excess dithionite. N either an S ¼ 3/2 nor a significant
S ¼ 1/2 signal in the g ¼ 2 region (< 0.05 spins/Rc1
Fe
molecule) was detectable. Recent M o
¨
ssbauer studies con-
firmed that both t he FeFe cofactor and the P-cluster are
diamagnetic in the dithionite-reduced state and that the
cofactor contains four Fe
II
- a nd four Fe
III
-centers [21]. For
the analogous, d ithionite-reduced state of t he FeMo-
cofactor, the presence of four Fe
II
but only three Fe
III
centers in addition to the Mo
IV
center has been postulated
[35]. Thus, the FeFe-cofactor may be (formally) r egarded as
a F eMo-cofactor molecule in which m olybdenum h as been
replaced by an Fe
III
center [21].
When the FeFe protein was oxidized with K
3
[Fe(CN)
6
],
in a stepwise fashion similar to that described for the MoFe-
protein, several novel EPR signals were detected. The two
most prominent signals (both S ¼ 1/2) have already been
partially c haracterized [8]. One of these is a very narrow
rhombic signal at g ¼ 2.00, 1.98 an d 1.96 ( in the f ollowing
designated as g ¼ 1.98 signal) and the other, a characteristic
broad signal with an absorption-shaped peak at g ¼ 2.27
and a derivative-shaped feature at g ¼ 2.06 (in the following
termed g ¼ 2.27 signal). The two signals are depict ed in
spectra 3 and 4 of Fig. 1 and directly c ompared to the most
characteristic S ¼ 1/2 signals of the reference system (the
oxidized MoFe protein), that h ave been attributed to P
1+
Fig. 3. pH-dependent occurrence of the axial EPR signal (g
||
¼ 2.00,
g
^
¼ 1.90) resulting from the partially oxidized MoFe protein. Two
samples of t he redox titration, b o th of t he potential region where the
rhombic P
1+
signal shows maximal intensity ()120 to )90 m V), were
thawed an d a djusted t o p H 6.4 and 8.4, r espe ctively, with a concen-
trated thre e-compon ent buffer system (0.8 7
M
Bistris, 0.44
M
Hepps,
0.44
M
Ches) according to [37]. The spectrum of the p H 7 .4 sample
represents the original spectrum. All spectra were recorded at 16 K and
100 mW. Inset: differenc e spectru m (spectrum pH 8. 4 ) spectrum
pH 6.4) depicting the axial signal.
1654 S. Siemann et al. (Eur. J. Biochem. 269) Ó FEBS 2002
and P
3+
(Fig. 1, spectra 1 and 2). It i s interesting to note
that the two proteins exhibited a quite different signal
pattern. When the FeFe protein solution, which contained
1m
M
dithionite, was oxidized with 2.5 m
M
ferricyanide,
both t ypes of signals were d etectable. They could, however,
easily be differentiated by their temperature dependence. At
10 K, the g ¼ 2.27 signal showed maximal intensity but was
partially overlapped by the narrow g ¼ 1.98 signal and a
further s harp resonance peak at g ¼ 2.01 (Fig. 1, s pectrum
3). With increasing temperature this latter pe ak as well as
the broad g ¼ 2.27 feature disappeared, whereas the narrow
signal became more prominent. At 23 K, the g ¼ 1.98
signal was observed as an undisturbed resonance of a single
paramagnetic species (Fig. 1, spectrum 4).
The most interesting feature is undoubtedly the unusually
broad g ¼ 2.27 signal, which was reproducibly detectable
and correlated w ith catalytic activity. The samples with
highest a ctivities d isplayed the most intense signals. F ur-
thermore, partially oxidized samples exhibiting this signal
were found to be catalytically intact (no loss of activity upon
oxidation). These results provide conclusive evidence that
the g ¼ 2.27 signal is not an art ifact. A s r egards t he n ature
of the signal, the lack of a visible negative a bsorption-
shaped peak at higher magnetic fields appears to be, at
first glance, indicative of an axial signal. However, a closer
inspection of the spectrum 3 in Fig. 4 reveals that the
derivative-shaped resonan ce at g ¼ 2.06 has approximately
the s ame intensity above and below t he baseline, suggesting
that the g ¼ 2.27 signal is rhombic. The inability to observe
the negative absorption-shaped peak may be the conse-
quence of inhomogeneous line broadening (g strain), a
phenomenon frequently observed in EPR spectra of met-
alloproteins [36].
InthecaseofAv1
Mo
, the typical P
1+
-cluster signal
was only detectable at neutral and weakly acidic pH, but
was absent at p H values near 8 .0 [30]. Because Rc1
Fe
samples were routinely prepared at pH 7.8, it was of
considerable interest to determine t he EPR properties
also under weakly acidic conditions. In fact, EPR spectra
of thionine-oxidized samples prepared at pH 8.4, 7.4 and
6.4 (Fig. 4) revealed a n ew signal, which was most
pronounced at pH 6.4, but proved to be very similar to
the g ¼ 2.27 feature. The signal was slightly less broad
corresponding to a shift of the g values to 2 .22 and 2.05
and displayed an additional b road negative absorption-
shaped peak centered at g 1.86 (Fig. 4, bottom
spectrum). B oth the g ¼ 2.27 and the narrower rhombic
signal (in the following termed g ¼ 2.22 signal) exhibited
an identical behaviour with respect to redox treatment as
well as to temperature and microwave power dependency
(data not shown). The g ¼ 2.27 signal was most
prominent a t pH 8.4, whereas at pH 7.4, a superimpo-
sition of both, the predominant g ¼ 2.27 and the minor
g ¼ 2.22 signal was observed (Fig. 4, middle spectrum).
While the resonance peaks at g ¼ 2.05 and 2.06 fused to
form a common, broad, unresolved peak at that pH
value, the broad, negative absorption-shaped resonance
was weak, but easily detectable.
The s imilarity between the two, p H-differentia ted signals
indicates that the g ¼ 2.22 signal is not novel, but rather
arises from the same c luster as the g ¼ 2.27 signal. It is
important to note that the occurrence of the negative
absorption-shaped peak near g ¼ 1.86 in the pH 6.4
spectrum (g
z
component of the g ¼ 2.22 signal) p rovides
further support to our view that the broader g ¼ 2.27 signal
is rhombic but that the resonance in the g ¼ 1.8 region
might be too broad to be detectable. Because the g ¼ 2.22
signal is narrower than the g ¼ 2.27 signal, the g strain may
not completely obscure the negative absorption-shaped
peak, thus rendering it detectable as a broad resonance in
the spectrum. The pH-dependent occurrence of the two
EPR signals is due either to subtle conformational differ-
ences in the cluster environment or to protonation/depro-
tonation effects in the cluster itself. pH-based signal shifts
and the occurrence of a dditional signals have been reported
for the cofactor of the MoFe proteins from K. pneumoniae
(Kp1) [38], Xanthobacter autotrophicus (Xa1) [39] and even
for the isolated FeMoco from Av1
Mo
[40].
The strong resonance near g ¼ 2.00, present in all spectra
of Fig. 4, originates from the t hionine radical s ignal. Under
the oxidation conditions (10 m
M
thionine) applied in these
experiments, the narrow g ¼ 1.98 signal was absent or of
such low intensity that it was completely obscured by the
radical signal. Analogous experimen ts on pH-dependence
with samples oxidized w ith K
3
[Fe(CN)
6
]revealedthat
the n arrow signal w as not significantly influenced by the
pHvalue (data not shown). For the clarity of presentation
of the broad-type signals, we chose the spectra of the
Fig. 4. pH-dependent shift of the broad g ¼ 2.27 EPR signal under
slightly acidic conditions. A FeFe protein sample (9 mgÆmL
)1
), freshly
prepared in the presence of 4 m
M
Na
2
S
2
O
4
, was oxidized with 10 m
M
thionine (Serva, H eidelberg, Germany) by adding 0 .6 mL of the pro-
tein solution to 1.5 mg solid thionine, which had been pre-exposed to
O
2
-free argon f or 30 min. After tho rough m ixing, th e r esulting solu-
tion was aliquoted into three samples of equal volume. These were then
adjusted to pH 6 .4, 7.4 a nd 8.4, r espectively, with a three-component
buffer system (see legend of Fig. 3 ). All spectra were recorded at 10 K
and 100 m W.
Ó FEBS 2002 Redox properties of the FeFe protein (Eur. J. Biochem. 269) 1655
thionine-oxidized samples, because these showed more
intense signals with high reproducibility.
Quantification of the g ¼ 2.27 signal yielded 0.6 spins
per protein molecule, corresponding to 0.3 spins per
P-cluster and per FeFe cofactor, respectively. This relatively
low s pin c ontent may be due to the parallel e xistence of the
same cluster species in different oxidation states, of which
only one is EPR-detectable. T hus, the theoretical maximum
of signal intensity (accounting for two spins per protein
molecule) m ay not be obtained. It is interesting to note t hat
this interpretation is in full accordance with the results
obtained f rom redox titration experiments, w hich will be
discussed in a later section. In addition, the quantification of
the presumably rhombic g ¼ 2.27 signal is solely based on
the g ¼ 2.27, 2.06 peaks and did not include the putative
thirdpeakintheg ¼ 1.8 region, thus leading to an
underestimation of t he spin con tent. The rhombic signal at
g ¼ 2.22, measured at pH 6.4, was not quantified because
of its generally low er intensity as well as the decreased
stability of the protein at this pH value. The narrow
g ¼ 1.98 sign al integrated to only 0.25 spins per protein
molecule, indicating that the c orresponding cluster, at least
in this specific redox state, is not of catalytic relevance.
Equilibrium-mediated redoxtitration of the FeFe pro-
tein. A redox titration (at pH 7.4) of the broad g ¼ 2.27
signal in the p resence of m ediators resulted in a be ll-shaped
titration curve with midpoint potentials of )80 mV
(appearance) and +70 mV (disappearance). Maximal
signal intensity was achieved by adjusting the potential to
)5 mV (Fig. 5). These results imply that the cluster giving
rise to the g ¼ 2.27 signal is, in analogy to the P
1+
cluster of
the MoFe protein, involved in a 2e
–
transfer process. It
could be reversibly converted into an EPR-silent state either
by reduction or by further o xidation.
The narrow g ¼ 1.98 signal was observed in a region
shifted about 150 mV to more positive redox potentials.
For t his signal a midpoint potential of 80 mV (appear ance)
was determined (Fig. 5). Maximal signal intensity was
reached at approximately 160 mV. To avoid oxidative
damage of the protein higher potentials t han 220 mV were
not adjusted. Nevertheless, the cluster giving rise to this
type of signal could only be re-reduced to 20–30% by
dithionite.
Nature of the
g
¼ 2.01 signal
Upon oxidation with f erricyanide, a signal a t g ¼ 2.01,
located between the broad g ¼ 2.27 and the narrow
g ¼ 1.98 signal (Figure 1, spectrum 3 ), was detected at
low temperatures (10–14 K) and potentials above
)50 mV, and was therefore never observed as a complete
and undisturbed signal. The intensity of this signal
strongly varied from preparation to preparation. A
decrease in specific activity was always accompanied by
an increase in signal intensity, sugge sting that the g ¼ 2.01
signal is an artifact arising from an oxidatively damaged
cluster. This view was substantiated by the following
observations.
(a) The increase in intensity of t he g ¼ 2.01 signal
during oxidation resulted in a concomitant increase of
the g ¼ 4.3 feature (data not shown). The g ¼ 4.3
signal, an accompanying signal found with most FeS
proteins, has been characterized as an S ¼ 5/2 system
caused by nonfunctional ÔadventitiousÕ Fe
III
[41], which
often occurs as the result of destructio n of FeS clusters.
InthecaseofRc1
Fe
,theg ¼ 4.3 s ignal significantly
increased towards the e nd of the redox titration
(+220 mV).
(b) Preliminary studies on the isolation and purification
of the FeFe apoprotein (from a nifBB’strain) revealed
that the cofactorless protein, when prepared according to
the procedure approved for the native enzyme [8], cannot
be obtained in an intact hexameric, but only in a
tetrameric a
2
b
2
form. The small d subunit could b e
isolated by DEAE chromatography as a separate peptide
(D. Tiemann, S. Fuchs, K. Schneider & A . Mu
¨
ller,
unpublished results). Dissociation of the d subunit from
the apodinitrogenase under certain conditions (e.g. during
gel filtration) has also been reported in the case of the
vanadium nitrogenase (VFe protein) from A. vinelandii
[42]. The tetrameric FeFe apoprotein from R. capsulatus
did not show any EPR signal typical of a P-cluster signal.
Only a signal at g ¼ 2.01, rather reminiscent of an
[Fe
3
S
4
]
1+
cluster, was detected. This signal increased
dramatically during oxidation (data not shown). Simulta-
neously, the signal intensity of nonfunctional ferric ions
increased as well. Because the apoprotein only contains
P-clusters, it is evident that the g ¼ 2.01 signal stems from
a P-cluster fragment as the result of oxidative d amage.
The phenomenon o f oxidative conversion of [Fe
4
S
4
]
clusters to [Fe
3
S
4
] clusters and thus, the occurrence of
g ¼ 2.01 signals, is widespread among iron–sulfur proteins
(e.g [43]). It is conceivable that the apoprotein tetramer,
lacking both the FeFe cofactor and the d subunit, is a
highly unstable protein form, in which the P-clusters, if
not becoming completely destroyed, tend to convert i nto
three-iron clusters.
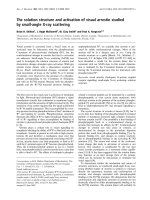
Fig. 5. Redox titra tion of EPR signals deriving from oxidized states of
theFeFeprotein.The r edox titration was performed as described in
Materials and m ethods. The sample contained 1 4 mg FeFe pro tein pe r
mL. (j) Redox titration curve of the signal at g ¼ 2.27 and 2.06. For
determination of the relative signal intensity the peak at g ¼ 2.27 was
used. Spectra were recorded at 10 K and 100 mW. (d)Redoxtitration
curve of the signal at g ¼ 2.00,1.98 and 1.96. Signal determination was
performed w ith the resonance at g ¼ 1.9 6. Spectra were m easured at
23 K a nd 100 mW.
1656 S. Siemann et al. (Eur. J. Biochem. 269) Ó FEBS 2002
Comparison of the turnover signals from enzyme-
reduced states of the MoFe protein and the FeFe protein
The characteristic EPR signal of the FeFe protein (Rc1
Fe
)
under turnover conditions at g ¼ 1.96, 1.92 and 1.77 has
already been documented [8]. The occurrence of this
S ¼ 1/2 t ype signal with samples containing ATP, a
substrate (N
2
,C
2
H
2
,H
+
) and the dinitrogenase reductase
component for enzymatic reduction of the FeFe protein,
was confirmed in the present study (Fig. 6A, spectrum 1).
The signal was most prominent in the presence of the
natural substrate, N
2
,whenmeasuredat16Kand100mW.
In order to avoid (a) P-cluster oxidation ( see D iscussion
section on this t opic) and (b) an interference of t he turnover
signal and t he dinitrogenase r eductase (Rc2
Fe
) signal, a
molar R c2
Fe
:Rc1
Fe
ratio of 1 : 10 was chosen. Under these
catalytically suboptimal conditions (low electron flux) a spin
content of 0.4 spins per Rc1
Fe
molecule has b een
determined for the turnover signal. A control spectrum of
a s ample containing the same a mount of Rc2
Fe
( 0.6 mgÆmL
)1
)intheabsenceofRc1
Fe
protein, confirmed
that the intensity of the Rc2
Fe
signal was marginal under the
measuring conditions.
The i ntention of the present turnover experiments was to
include the Mo nitrogenase of the same organism in order to
minimize the possibility that the described turnover signal
results from a Rhodobacter-specific contamination or from
an artifact caused by the p reparation conditions applied.
In fact, when we isolated and prepared the protein
components of the Mo nitrogenase (Rc1
Mo
,Rc2
Mo
)
according to the same procedures as the Fe nitrogenase
components (Rc1
Fe
,Rc2
Fe
) and finally applied exactly
identical turnover and EPR conditions, t he EPR s ignal
detected with the Fe-only nitrogenase ( g ¼ 1.96, 1.92,
1.77) at 16 K, was absent (Fig. 6A, spectrum 2). The
minimal resonance (g ¼ 1.9–2.0) visible in s pectrum 2
resulted from Rc2
Mo
. It w as identical with the control
spectrum in the absence of Rc1
Mo
.Furthermore,withthe
exception of the classical S ¼ 3/2 signal of the MoFe
protein a t l ower temperatures (< 12 K), no other signal
was detectable. In full accordance with literature data ( e.g
[44]), the e nzyme(Rc2
Mo
)-reduced state o f t he MoFe
protein showed, compared t o the dithionite-reduced state
(Fig. 6B, spectrum 3), a drastic decrease ( 70%) in signal
intensity ( Fig. 6B, spectrum 4). In th e case of Mo n itro-
genases f rom o ther organisms, t his b ehaviour has been
interpreted to be due to one-electron reduction of the
semireduced to the reduced and EPR silent state of the
FeMo cofactor [45].
DISCUSSION
The FeMo cofactor, one of the two unique metal clusters
present in the MoFe protein component of the conventional
nitrogenase, has been subjected to extensive EPR spectro-
scopic investigations since the ear ly 1970s (reviewed in [4 5]).
On the other hand, studies on EPR and redox properties of
the P -cluster have long been neglected. Only in recent years
have EPR investigations on MoFe proteins focused on t his
second unusual type of n itrogenase cluster [27–31]. In view
of the l ack of analogous stud ies on t he cofactor and t he
P-cluster of t he MoFe protein from R. capsulatus (Rc1
Mo
),
as well as our intention to use the Rc1
Mo
protein as a
reference system f or the characterization and identification
of the EPR signals displayed by the FeFe protein compo-
nent of the Fe-only nitrogenase (Rc1
Fe
), investigations on
the MoFe protein were included i n this c omparative work.
Several results obtained with the Rc1
Mo
component are in
excellent agreement with important EPR and redox prop-
erties previously reported for the MoFe proteins of other
bacteria. These include: demonstration o f the classical
Fig. 6. EPR signals o f the FeFe protein and the MoFe protein under
turnover conditions. (A) EPR sp ectra of b oth the FeFe protein ( spec-
trum 1) and the MoFe prote in (spectrum 2) me asured at 16 K under
turnover conditions. The sam ples were prepared anaerobically (under
N
2
) directly in the EPR tube. They contained 2 4 m g Rc1
Fe
per mL and
0.6 mg Rc2
Fe
per mL in the case of the F e nitrogenase and 28 mg
Rc1
Mo
per mL and 0.7 mg Rc2
Mo
per mL in the case of the Mo
nitrogenase. The other constituents were: 100 m
M
Hepes (pH 7.8),
5m
M
ATP, 10 m
M
MgCl
2
,6 m
M
Na
2
S
2
O
4
,20 m
M
creatine phosphate
and 0.2 mg creatine kinase. The enzymatic reduction was started by
the addition of ATP. After 1 m in incubation at room temperature,
the samples were imm ediately frozen in isopentane cooled by liq uid
nitrogen. The spectra were recorded at 100 mW. (B) EPR signals of the
MoFe protein measured at 4 K, either Na
2
S
2
O
4
-reduced (spectrum 3)
or en zyme(Rc2
Mo
)-reduced, i.e. u nder turnover conditions (spec-
trum 4). The Na
2
S
2
O
4
-reduced sample contained 28 mg Rc1
Mo
per
mL but no Rc2
Mo
. All other conditions were equal to those described
for the tu rn over samples. Both spectra w ere recorded at 2 0 mW.
Ó FEBS 2002 Redox properties of the FeFe protein (Eur. J. Biochem. 269) 1657
S ¼ 3/2 FeMoco signal (E
m
)50 mV), of a characteristic
rhombic S ¼ 1/2 EPR signal at g ¼ 2.07, 1.96, 1.83, appar-
ently deriving from the one-electron-oxidized P-cluste r (P
1+
)
and of a weak signal near g ¼ 12 (propably S ¼ 3),
reminiscentofthe2e
–
oxidized P-cluster (P
2+
) signal [27,30].
However, we have found that Rc1
Mo
significantly
deviates from other MoFe proteins with respect to a
number of relevant characteristics.
(1) Although the lineshape and g value positions (2.07,
1.96, 1.83) of t he EPR s ignals from Rc1
Mo
and Av 1
Mo
,
which have been interpreted to represent the P
1+
redox
state, are almost identical [30], some features associated with
these P
1+
signals exhibit remarkable differences.
(a) The midpoint potential of th e P
N/1+
redox couple of
Av1
Mo
is about 1 00 mV more negative ( E
m
¼ )290 mV).
(b) The midpoint potential of the P
1+/2+
redox couple of
Av1
Mo
displays a p ronounced pH dependence, being
distinctly more positive at lower pH values. This pH
dependence has been interpreted as an indication of a
coupled electron and pr oton transfer [30]. Despite increased
midpoint potentials i n an a cidic environment, at pH 6.0 E
m
of P
1+/2+
is still drastically lower ( )150 mV) than E
m
for
the analogous state of the Rc1
Mo
P-cluster.
(c) The intensity of the rhombic S ¼ 1/2 P
1+
signal of
Av1
Mo
is strongly pH-dependent as well, being maximal a t
pH 6.0. At pH 7.5 this signal is of only very low intensity
and at pH 8.0 it is even absent. This observation might
explain why the characteristic P
1+
cluster signal has not
been detected by some research groups [27]. The absence of
the P
1+
state in a weakly alkaline medium is likely to be
caused by the simultaneous transfer of two electrons, thereby
resulting in a transition from P
N
directly into the P
2+
state.
In the case of the rhombic P
1+
signal of Rc1
Mo
(g ¼ 2.07,
1.96, 1.83), which corresponds to the Av1
Mo
P
1+
signal,
neither the intensity nor the dependence on the redox
potential was significantly influenced by the p H value.
(2) I n t he course of the redox titration of Rc1
Mo
, a novel
axial S ¼ 1/2 signal (g
||
¼ 2.00, g
^
¼ 1.90) was detected,
which has not yet been described f or other MoFe proteins.
This signal, which appears to be associated with the P
1+
redox state a s well, was, in contrast to the rhombic P
1+
signal, influenced by the pH value. However, c ompared to
Av1
Mo
, opposite pH-dependence was observed (maximal
intensity of this axial signal at pH 8.4).
(3) At positive redox potentials, the Av1
Mo
protein
showed a rhombic S ¼ 1/2 EPR signal (g ¼ 1.97, 1.88,
1.68; maximal intensity at 150–300 mV) which has been
attributed to the 3 e
–
oxidized P-cluster (P
3+
) [27]. A
rhombic signal in the same potential range has also been
observed in t he case of Rc1
Mo
, however, t his signal was less
broad a nd located in a lower m agnetic fi eld region
(g ¼ 2.03, 2.00, 1.90). Moreover, the R c1
Mo
signal showed
significant intensity only after nonmediated oxidation and
did not, in contrast to the Av1
Mo
signal, disappear upon
further oxidation with K
3
[Fe(CN)
6
](>300mV).
(4) The phenomenon of Ôspin mixtures Õ, i.e. the simulta-
neous occurrence of S ¼ 1/2, 5/2 signals (P
1+
state) [28] and
of S ¼ 1/2, 7/2 signals (P
3+
state) [27], was not observed
with the Rhodobacter enzyme. T he observation that P-
clusters of one and the same redox state m ay be present in
different s pin states within one protein s ample or even
within one MoFe protein molecule, has been discussed to be
due to an artifact caused by temperature and solvent
influence [46].
With respect to the assignment of specific EPR spectro-
scopic characteristics of the FeFe protein (overview in
Table 1) to certain redox states of the P-cluster and t he
FeFe cofactor, only two conclusions can be drawn at the
present time.
(1) The native, dithionite-reduced Rc1
Fe
protein was
proven to be EPR-silent. This is in accordance with the
results of recent Mo
¨
ssbauer studies [21], which indica-
ted that both the iron–iron cofactor (FeFeco) and the
P-cluster are diamagnetic (S ¼ 0) in the d ithionite-reduced
state.
(2) T he S ¼ 1/2 signal at g ¼ 1.96, 1.92, 1.77, obtained
after dinitrogenase reductase (Rc2
Fe
)-mediated reduction of
Rc1
Fe
(turnover conditions), represents a reduced state of
the FeFe cofactor. This conclusion is based on the following
arguments:
(a) The fact that the g ¼ 1.96, 1.92, 1.77 signal is absent in
the turnover sample of the Mo nitrogenase provides
evidence that this signal is not an artifact or caused by a
Rhodobacter-specific paramagnetic impurity.
(b) Spectroscopic studies (Mo
¨
ssbauer, Integer-spin-
EPR) on MoFe proteins h ave revealed that all iron
atoms in the dithionite-reduced P-cluster are most likely
in the ferrous state [47,48]. This excludes the possibility
that the diamagne tic, fully reduced P -cluster becomes
further reduced during enzyme turnover. Thus, the
turnover signal of the FeFe protein cannot arise from
a ‘super-reduced’ P-cluster.
Table 1. A comparative overview on the EPR s ignals of the M oFe- and FeFe pro tein from R. capsulatus. The enzyme (dinitrogenase r eductase )-
reduced MoFe protein mo lecu les (E
1
state) are EPR-silent. However, under the con ditions used, i.e. at low electron flux (Rc2
Fe
:Rc1
Fe
¼ 1 : 10), the
sample also contained 30% o f dithionite-reduced M oFe protein molecules (Ôresting stateÕ E
0
) showing the typical S ¼ 3/2 FeMoco s ignal.
Redox state
EPR signals (g values)
FeFe protein MoFe protein
I. Enzyme-reduced 1.96, 1.92, 1.77 EPR-silent
II. Na
2
S
2
O
4
-reduced EPR-silent 4.29, 3.67, 2.01
III. Oxidized
E
max
)125 mV (1) 2.07, 1.96, 1.83 (pH 7.4)
E
max
)150 mV (2) 2.00, 1.90 (pH 8.4)
E
max
)5 mV (1) 2.27, 2.06 (pH 8.4)
(2) 2.22, 2.05, 1.86 (pH 6.4)
E > 100 mV 2.00, 1.98, 1.96 2.03, 2.00, 1.90
1658 S. Siemann et al. (Eur. J. Biochem. 269) Ó FEBS 2002
(c) The P-cluster has been shown to be intermediately
oxidized during e nzyme turnover under conditions of high
electron flux, i.e. at a dinitrogenase reductase:d initrogenase
ratio of 1 : 1 or higher [49]. However, under condition s of
low electron flux, as employed in our study, the P-cluster
remains reduced and the predominant states of the
cofactor are E
0
(resting state, equivalent with the semire-
duced or dithionite-reduced st ate) and E
1
(one-electron-
reduced state) [50]. Further reduced states, such as E
3
and
E
4
,postulatedtoplayaroleinN
2
-binding/reduction and
suggested to be connected to P-cluster oxidation, are
presumably present only in very small proportions, unde-
tectable by EPR under these conditions. These theoretical
expectations are in full accordance with the results
obtained with the reference system used in this study, the
Mo nitrogenase f rom R. capsulatus. Upon enzymatic
reduction of the MoFe protein at a R c2
Mo
/Rc1
Mo
ratio
of 1 : 10 the FeMoco EPR s ignal (representing the E
0
state) maintained 30% of its intensity. In addition, no
signal indicative of an oxidized P-cluster was detected.
Under analogous conditions, the Fe-only nitrogenase failed
to exhibit a ny of the signals appearing upon oxidative
titration. Consequently, the turnover signal does not arise
from an oxidized P-cluster.
(d) As concluded from the results of the preceding
Mo
¨
ssbauer study [21], the FeFe cofactor of the Fe-only
nitrogenase contains an equal number (four each) of ferric
and ferrous iron centers in the dithionite-reduced state,
resulting i n a diamagnetic (S ¼ 0) state. Hence, it appears
reasonable to assume that the FeFeco becomes converted
into an EPR detectable state by 1 e
–
oxidation a s well a s b y
further 1e
–
reduction. Accordin g to the mechanism postu-
lated by Lowe and coworkers [49], the tu rnover signal can
therefore be a ssigned t o the one-electron-reduced state (E
1
)
of the FeFe cofactor.
The two relevant S ¼ 1/2 signals displayed by t he
oxidized FeFe protein (the narrow g ¼ 2.00, 1.98 , 1.96
and the broad g ¼ 2.27, 2.06 signal) are more difficult to
assign. At first glance, there appears to be no similarity
between P-cluster signals of t he MoFe protein and the EPR
signals of the FeFe protein. However, some significant EPR
spectroscopic data (compare Table 1) indicate that the
narrow g ¼ 1. 98 signal represents the P
3+
-cluster state:
(a) Although this signal differs from the P
3+
signal
(MoFe protein) with respect to lineshape (signal broadness),
the g region at which the two signals are detectable, is in
principle the same (1.90–2.03).
(b) The redox potentials at which the narrow FeFe
protein signal occurs (E
m
¼ 80 mV) and reaches maximal
intensity ( 160 mV), are in excellent agreement with the
values reported for the P
3+
-cluster signal of the MoFe
protein from A. vinelandii [27].
(c) After being induced by oxidation w ith ferricyanide,
both clusters giving rise to this type of signal can only
partially ( 20–30%) b e re-reduced by the addition of
excessive amounts of dithionite.
Although a three-electron-oxidized P-cluster can appar-
ently be produced by chemical oxidation, the irreversibility
of this in vitro process a s well as the low spin content of the
corresponding EPR signal i ndicate that the P
3+
state i s not
of physiological/catalytical relevance.
The assignment of the novel broad g ¼ 2.27 feature of
the partially oxidized FeFe protein appears to be even
more challenging. In fact, such a signal has never been
observed for any type of FeS cluster. The characteristic
g values of all known S ¼ 1/2 systems arising from
homonuclear FeS clusters are situated between 1.8 and
2.15 [51].
Several fundamental considerations oppose the attribu-
tion of this signal to an oxidized P-cluster:
(a) T he signal profile and the position of g values
fundamentally deviate from t hat o f the P
1+
signal
(g ¼ 2.06, 1.96, 1.83) of the Rhodobacter MoFe protein.
Furthermore, the redox potential of the cluster responsible
for the g ¼ 2.27 feature is, compared to the P
1+
signal of
Rc1
Mo
, shifted by 100–115 mV to more positive potentials
(compare Table 1 and t he course of both b ell-shaped
redox curves in Figs 2 and 5). A P
1+
clusterasthespecies
responsible for a signal with such strongly deviating
characteristics would imply either a significant alteration
in the p rotein environment (conformation, interaction
with amino acids) compared to the P-cluster environment
in the MoFe protein, or a structural modification o f the
cluster itself. At least the latter possibility seems highly
unlikely, since the six cysteine residues coordinating the
P-cluster i n the MoFe protein, are also conserved in the
FeFe protein, as judged b y sequence c omparisons [7]. In
addition, Mo
¨
ssbauer spectra did not yield any indication
for a structural difference between the P-clusters o f the
two proteins [21].
(b) The possibility that the g ¼ 2.27 signal represents P
2+
appears t o be highly unlikely a s well. The 2e
–
-oxidized
P-cluster of M oFe p roteins h as been reported not to reveal
an S ¼ 1/2 signal, but to exhibit a signal at g 12, resulting
from an integer spin state (presumably S ¼ 3[27]).
Although this feature has b een demonstrated in the c ase
of Rc1
Mo
as well, a corresponding signal for the Rc1
Fe
protein was not detected. Under the EPR spectroscopic
conditions employed in this study (perpendicular mode), the
2e
–
oxidized P-cluster of R c1
Fe
is EPR-silent.
(c) If our conclusion is correct that the narrow g ¼ 1.9 8
signal arises indeed from the 3e
–
oxidized P-cluster, the
possibility that the broad g ¼ 2.27 signal represents P
1+
(or
P
2+
) can automatically be excluded in v iew of the following
interrelations: redox re-titrations were performed starting
from a potential of 200 mV. At this redox potential, the
broad low potential g ¼ 2.27 signal was absent and the
narrow high potential g ¼ 1.98 signal reached an intensity
maximum. If both signals were to originate from the
P-cluster, the majority of P-cluster molecules would b e
present i n the P
3+
state a t this r edox potential. Because the
P-cluster in t his s tate cannot be reversibly reduced to lower
oxidation states, the broad signal would, provided it
represents P
1+
, necessarily not reappear with significant
intensity during the re-titration procedure. However, as
demonstrated in our experiments, the broad s ignal did
reappear upon reductive titration, even with maximal
intensity. This controversial behaviour of the two signals
with respect to redox t reatment and re versibility s hows that
both the narrow and the broad signal originate from
different paramagnetic species. In conclusion, if the
g ¼ 1.98 signal stems from t he P
3+
cluster, then the
g ¼ 2.27 feature derives from the FeFe c ofactor. On
the other hand, if the broad signal, d espite its unusual
properties, represents the P
1+
cluster, the narrow s ignal,
in turn, would a rise from the F eFeco. However, i n view of
Ó FEBS 2002 Redox properties of the FeFe protein (Eur. J. Biochem. 269) 1659
the high potential region at which this narrow signal occurs,
this possibility appears very unrealistic.
In summa ry, if t he g ¼ 2.27 signal does not arise from
P
1+
or P
2+
, th e only alternative is that it results from the
FeFe cofactor. Because evidence has been provided by EPR
and Mo
¨
ssbauer spectroscopy that the FeFeco is diamag-
netic in the dithionite-reduced state, it appears plausible that
the g ¼ 2.27 signal might represent the one-electron-oxid-
ized state of t he cofactor. T he observation of a bell-shaped
redox curve (Fig. 4) implies that the cluster giving rise to this
signal can u ndergo further oxidation. This seems t o be
somewhat surprising, since the EPR-silent 1e
–
-oxidized
FeMoco cannot be further oxidized to another E PR
detectable state. Although such a redox state appears
unlikely to participate in th e catalytic events leading to
substrate r eduction, its f ormation in the case of the Fe-only
nitrogenase might be explained by the involvement of the
additional iron a tom (which replaces the heterometal atom)
in that redox process.
As regards the lineshape and width of the g ¼ 2.27
signal, its unusual broadness may arise from Heisenberg
broadening as a consequence of an unusually short
relaxation time. Another possible cause for the signal
broadness may b e due to the transition of one (or m ore) o f
the Fe centers in the FeFe cofactor from high-spin to low-
spin. Such t ransition, although truly speculative at this
time, would lead to a n increased g-anisotropy and thus,
increased line width. It is pertinent to note that the
molecular/structural basis underlying the broadening of the
g ¼ 2.27 signal is un known a t p resent. Fu ture Mo
¨
ssbauer
studies on the oxidized FeFe protein may prove valuable in
solving this question.
Provided our assignment of the g ¼ 2.27 signa l to the
partially oxidized FeFeco and the g ¼ 1.98 signal to the 3e
–
-
oxidized P
3+
cluster is correct, the question a rises as to why
an additional s ignal corresponding to P
1+
is missing. It is
conceivable that the P-cluster transfers t wo ele ctrons
simultaneously (direct P
N
to P
2+
transition), t hereby
obscuring the P
1+
transition. As already outlined above,
such a 2e
–
transfer, responsible for the absence of a
characteristic P
1+
EPR-signal, has been postulated to occur
inthecaseoftheAv1
Mo
protein as well, however, only at
weakly alkaline pH [27,30].
In conclusion, the assignment of the characteristic EPR
signals of the FeFe protein is tentative. Future studies will
therefore aim at a c onclusive identification of t he EPR
signals, particularly of those arising from the oxidized states
of the P-cluster and the FeFeco. Such investigations will
include the development of a procedure for the isolation and
stabilization of a hexameric FeFe apoprotein, as well as a
detailed EPR spectroscopic characterization of this cofac-
torless protein system.
ACKNOWLEDGEMENTS
The authors are indebted to Mrs S . Selsemeier-Voigt for technical
assistance. This work was supported by the Deutsche Forschungs-
gemeinschaft (DFG).
REFERENCES
1. Hales, B.J., Case, E.E., M orningstar, J.E., Dzeda, M.F. &
Mauterer, L.A. (1986) Isolation of a new vanadium-containing
nitrogenase f rom Azotobacter vinelandii. Biochemistry 25, 7251–
7255.
2. Eady, R.R., Robson, R.L., Richardson, T.H., Miller, R.W. &
Hawkins, M. (1987) The vanadium nitrogenase of Azotobacter
chroococcum. Biochem . J. 244, 197–207.
3. Eady, R.R. (1996) S tructure–function r elationships of alternative
nitrogenases. Chem. Rev. 96, 3013–3030.
4. Smith, B.E. (1999) Structure, function, and biosynthesis of the
metallosulfur clusters in nit rogenases. Adv. I norg. Chem. 47,
159–218.
5. Chisnell, J.R., Premakumar, R. & Bishop, P.E. (1988) Purification
of a second alternative nitrogenase from a nifHDK deletion strain
of Azotobacter vinelandii. J. Bacteriol. 170, 27– 33.
6. Pau, R.N., Eldridge, M.E., Lowe, D.J., Mitchenall, L.A. & Eady,
R.R. (1993) Molybdenum-independent nitrogenases of Azoto-
bacter vinelandii: a functional sp ecies of alternative nitrogenase-3
isolated from a molybdenum-tolerant strain contains an iron-
molybdenum cofactor. Biochem. J. 293, 101–107.
7. Schu
¨
ddekopf, K., Hennecke, S., Liese, U., Kutsche, M. & Klipp,
W. (1993) Characterization of anf genes specific for the alternative
nitrogenase and identification of nif genes required for both
nitrogenases in Rhodobacter capsulatus. Mol. Microbiol. 8,673–
684.
8. Schneider, K., Gollan, U., Dro
¨
ttboom, M., Se lsemeier-Voig t, S. &
Mu
¨
ller, A. (1997) Comparative biochemical characterization of
the iron-only nitrogenase a nd the molybdenum nitrogenase from
Rhodobacter c apsulatus. Eur. J. Biochem. 24 4, 789–800.
9. Davis,R.,Lehmann,L.,Petrovich,R.,Shah,V.K.,Roberts,G.P.
& Ludden, P.W. (1996) Purification and characterization of the
alternative nitrogenase from the p hotosynthetic bacterium.
Rhodospirillum rubrum. J. Bacteriol. 17 8, 1445–1450.
10. Ribbe, M., Gadkari, D. & Meyer, O. (1997) N
2
fixation by
Streptomyces thermoautotrophicus involves a molybdenum-dini-
trogenase and a manganese-superoxide oxidoreductase that cou-
ples N
2
reduction to the o xidation of s uperoxide produced from
O
2
by a molybdenum-CO dehydrogenase. J. Biol. Chem. 272,
26627–26633.
11. Hawks, T.R., McLean, P.A. & Smith, B .E. (1984) Nitrogenase
from nifV mu tants of Klebsiella pneumoniae contains an altered
form of the iron-molybden um cofactor. Biochem. J. 217, 317–321.
12. Peters, J.W., Stowell, M.H.B., Soltis, S.M., Finnegan, M.G.,
Johnson, M.K . & R ees, D.C. (1997) Redox-dependent structural
changes in the nitrogenase P-cluster. Biochemistry 36, 1181–1187.
13. Howard, J.B. & Rees, D.C. (1994) Nitrogenase: a nucleotide-
dependent molecular switch. Annu. Rev. Biochem. 63 , 235–264.
14. Deng, H . & Hoffmann, R. (1993) How N
2
might be a ctivated by
the FeMo-cofactor in nitrogenase. Angew. Chem. Int. E d. 32,
1026–1029.
15. Sellmann, D. & Sutter, J. (1997 ) Elementary r eactions, structure-
function relationships, and the potential relevan ce of low mole-
cular w eight metal-sulfur ligan d c om plexes to biological N
2
fixation. J. Bi ol. Inorg. C hem. 1, 587–593.
16. Coucouvanis, D. (1996) Functional analogs for th e re duction
of certain nitrogenase substrates. Are multiple sites within the
Fe/Mo/S center involved in the 6e
–
reduction of N
2
? J. Biol. Inorg.
Chem. 1, 5 94–600.
17. Gro
¨
nberg, K .L.C., Gormal, C.A., D urrant, M.C., S mith, B.E. &
Henderson, R.A. (1998) Why R-homocitrate is essential to the
reactivity of FeMo-cofactor o f n itrogenase. Studies on NifV
–
extracted FeMo-cofactor. J. Am. Chem. Soc. 120, 10613–10621.
18. Schneider, K., Mu
¨
ller,A.,Schramm,U.&Klipp,W.(1991)
Demonsration of a molybdenum- and vanadium-independen t
nitrogenase in a nifHDK-deletion mutant of Rhodobacter capsu-
latus . Eur. J. Biochem. 195, 653 –661.
19. Gollan, U., Schneider, K., Mu
¨
ller, A., Schu
¨
ddekopf, K. & Klipp,
W. (1993) Detection of the in vivo incorporation of a metal cluster
into a protein. The FeMo cofactor is inserted into the FeFe protein
1660 S. Siemann et al. (Eur. J. Biochem. 269) Ó FEBS 2002
of the alternative nitrogenase of Rhodobacter capsulatus. Eur.
J. Biochem. 215, 25–3 5.
20. Krahn,E.,Weiss,B.J.R.,Kro
¨
ckel, M ., Cramer, S .P., Trautwein,
A.X., Schneider, K. & Mu
¨
ller, A. (1998) The Fe-only nitrogenase
from Rhodobacter capsulatus: 2. The F eFe p rotein metal c enters
probed by EXAFS and Mo
¨
ssbauer spectroscopy. In Biological
Nitrogen Fixation for the 21st Century (Elmerich, C., K ondo rosi,
A. & Newton, W.E., e ds), pp. 59–60. Kluwer Academic Publish-
ers, Dordrecht, the Netherlands.
21. Krahn, E., Weiss, B.J.R., Kro
¨
ckel, M., Groppe, J., Henkel, G.,
Cramer,S.P.,Trautwein,A.X.,Schneider,K.&Mu
¨
ller, A. (2002)
The F e-only ni trogenase f rom Rhodobacter capsulatus: identifica-
tion of the cofactor, an unusual, high-nuclearity iron-sulfur
cluster, by Fe K-edge EXAFS and
57
Fe Mo
¨
ssbauer spectroscopy.
J. Biol. Inorg. Chem. 7, 37–45.
22. Wang, G., Angermu
¨
ller, S. & Klipp, W. (1993) Characterization
of Rhodobacter capsulatus genes encoding a molybden um trans-
port system and putative molybdenum-pterin-binding proteins.
J. Bacteriol. 17 5, 3031–3042.
23. Beisenherz, G., Bolze, H.J., Bu
¨
cher, T., Czok, R., Garbade, K.H.,
Meyer-Arendt, E. & Pfleiderer, G. (1953) Diphosphofructose-
aldolase, Phosph oglyceraldehyd-deh ydrogenase, Milchsa
¨
ure-
dehydrogenase, Glycerophosphat-dehydrogenase and P yruvat-
kinase aus Kaninchenmuskulatur in einem Arbeitsgang. Z.
Naturforsch. 8b , 555–577.
24. Siemann, S., Schneider, K., Behrens, K., Kno
¨
chel, A., Klipp, W. &
Mu
¨
ller, A. (2001) FeMo cofactor biosynthesis in a nifE
–
mutant of
Rhodobacter c apsulatus. Eur. J. Biochem. 268 , 1940–1952.
25. Chen, J.S. & Mortenson, L.E. (1977) Inhibition of methylene blue
formation d uring determination of the acid-labile sulfide of ir on-
sulfur protein sampl es containing dithionite. Ana l. Biochem. 79,
157–165.
26. Dutton, P.L. (1978) Redox potentiom etry: determination of
midpoint potentials of oxidation-reduction components of bio-
logical electron-transfer sy stems. Methods E nzymol. 54, 411–435.
27. Pierik, A.J., W assink, H., Haaker, H . & Hagen, W.R. (1993)
Redox properties and EPR spectroscopy of the P clusters of
Azotobacter vinelandii MoFe protein. Eur. J. Biochem. 212, 51–61.
28. Tittsworth, R.C. & Hales, B.J. (1993) Detection of EPR signals
assigned to the 1-equivalent-oxidized P-clusters of the nitrogenase
MoFe protein from Azotobacter vinelandii. J. Am. Chem. Soc. 115,
9763–9767.
29. Tittsworth, R.C. & Hales, B.J. (1996) Oxidative titration of the
nitrogenase VFe p rotein from Azozobacter vinelandii: an example
of redox-gated electron flow. Bioc hemistry 35, 4 79–487.
30. Lanzilotta, W.N., Christiansen, J., Dean, D.R. & Seefeldt, L.C.
(1998) Evidence for coupled electron and proton transfer in the
[8Fe)7S] cluster of nitrogenase. Bioc hemistry 37, 1137 6–11384.
31. Chan, J.M., Dean, D.R. & Seefeldt, L.C. (1999) Spectroscopic
evidence for changes in the redox state of the nitrogenase P cluster
during turnover. Biochemistry 38, 5779–5785.
32. Smith, B.E., Lowe, D.J., Chen, G X., O’Donell, M.J. & Hawkes,
T.R. (1983) Evidence on intramolecular electron transfer in the
MoFe protein of nitrogenase from Klebsiella pneumoniae from
rapid-freeze electron-paramagnic-resonance studies of its oxida-
tion by ferricyanide. Biochem. J. 209, 207–213.
33. Blanchard, C.Z. & Hales, B.J. (1996) Isolation of two forms of the
nitrogenase VFe protein from Azotobacter vinelandii. Biochemistry
35, 472 –478.
34. Zumft, W.G. & Mortenson, L.E. (1973) E vidence for a catalytic-
centre heterogeneity of molybdoferredoxin from Clostridium
pasteurianum. Eur. J. Biochem. 35 , 401–409.
35. Yoo, S.J., Angove, H.C., Papaefthymiou, V., Burgess, B.K. &
Mu
¨
nck, E. (2000) Mo
¨
ssbauer study of the M oFe protein o f
nitrogenase from Azotobacter vinelandii using selective
57
Fe
enrichment of the M centers. J. Am. Chem. Soc. 122, 4 926–4936.
36. Hagen, W.R. ( 1989) g-strain: inhomogeneous broadening in
metalloprotein EPR. In Advanced EPR. Applications in Biology
and Biochemistry (Hoff, A.J., ed.), pp. 785–812. Elsevier,
Amsterdam, th e Netherlands.
37. Pham, D .N. & B urgess, B.K. (1993) Nitrogenase a ctivity. Effects
of pH on substrate reduction and CO inhibition. Biochemistry 32,
13725–13731.
38. Lowe, D.J. & Smith, B.E. (1985) Ele ctron-paramagnetic-
resonance spectroscopy and related techniques in the study of
nitrogenase. Bioc hem. Soc. Trans . 13, 579 –581.
39. Schneider, K., Mu
¨
ller,A.,Krahn,E.,Hagen,W.R.,Wassink,H.
&Knu
¨
ttel, K H. (1995) The molybdenum nitrogenase from
wild-type Xanthobacter autotrophicus exhibits properties remini-
scent of a lte rnative nitrogenases. Eur. J . Biochem. 230 , 666–675.
40. Newton,W.E.,Gheller,S.F.,Feldman,B.J.,Dunham,W.R.&
Schultz, F.A. (1989) Isolated iron-molybdenum cofactor of
nitrogenase exists in multiple forms in its oxidized a nd semi-
reduced states. J. Biol. C hem. 264, 1924 –1927.
41. Palmer, G. (1985) The electron paramagnetic resonance of
metalloproteins. Bioc hem. Soc. Trans . 13, 548 –560.
42. Chatterjee, R ., Ludden, P.W. & S hah, V.K. (1 997) Characteriza-
tion of VNFG, the d subunit of the vnf-encoded apodinitrogenase
from Azotobacter vinelandii. Implications for its role in the forma-
tion of functional dinitrogenase 2. J. Biol. Chem. 272, 3758–3765.
43. Zaborosch, C., Ko
¨
ster, M., Bill, E., Schneider, K. & Schlegel,
H.G.&Trautwein,A.X.(1995)EPRandMo
¨
ssbauer spectro-
scopic stud ie s on the tet rameric, NAD-linked h ydrogenase of
Nocardia opaca 1b and its two dimers: 1. The bd-dimer – a pro-
totype of a simple h ydrogenase. Biometals 8, 149–162.
44. Smith,B.E.,Lowe,D.J.&Bray,R.C.(1973)Studiesbyelectron
paramagnetic resonance on the catalytic mechanism of
nitrogenase o f Klebsiella pneumoniae. Biochem . J. 135, 331–341.
45. Burgess, B.K. (1990) The iron–molybdenum cofactor of nitro-
genase. Chem. Rev. 90 , 1377–1406.
46. Onate, Y.A., Finnegan, M.G., Hales, B.J. & Johnson, M.K.
(1993) Variable temperature magnetic circular dichroism studies
of reduced nitrogen ase iron proteins an d [4Fe)4S]
+
synthetic
analog clusters. Bi ochim. Biophys. Acta 116 4, 113–123.
47. Surerus, K .K., Hendrich, M.P., C hristie, P.D., Rottgardt, D .,
Orme-Johnson, W.H. & Mu
¨
nck, E. (1992) Mo
¨
ssbauer and
integer-spin EPR of the oxidized P-clusters of nitrogenase: P
ox
is a
non-Kramers system with a nearly degenerate ground doublet.
J. Am. Chem. Soc. 114, 8579–8590.
48. Orme-Johnson, W.H. (1993) The molybdenum-iron protein of
nitrogenase. In Molybdenum Enzymes, Cofactors, and Model
Systems (Stiefel, E.I., Coucouvanis, D. & Newton, W.E., eds), pp.
257–270. A merican Chemical S ociety, Washington, DC.
49. Lowe, D.J., Fisher, K. & Thornley, R.N.F. (1993) Klebsiella
pneumoniae nitrogenase: pre-steady-state absorbance changes
show t hat redox c hanges occur i n the MoFe protein t hat depend
on substrate a nd component protein ratio; a role for P-centres i n
reducing dinitrogen? Biochem. J . 292, 93–98.
50. Fisher, K., Lowe, D.J. & Thorneley, R.N.F. (1991) Kleb siella
pneumoniae nitrogenase. The pre-steady kinetics of MoFe protein
reduction and hydrogen evolution under cond itions of limiting
electron flux show that the rates of association with the Fe-protein
and electron transfer are independent of the oxidation level of the
MoFe pro tein. Biochem. J. 27 9, 81–85.
51. Bertini,I.,Ciurli,S.&Luchinat,C.(1995)Theelectronicstructure
of FeS centres in proteins and models. A contribution to the
understanding of their electro n t ransfer properties. Struct. Bonding
83, 1–5 4.
Ó FEBS 2002 Redox properties of the FeFe protein (Eur. J. Biochem. 269) 1661