Report on the Environmental Benefits of Recycling Bureau of International Recycling (BIR) docx
Bạn đang xem bản rút gọn của tài liệu. Xem và tải ngay bản đầy đủ của tài liệu tại đây (2.11 MB, 51 trang )
Report on the
Environmental Benefits
of Recycling
Bureau of International Recycling (BIR)
Report on the Environmental Benefits of Recycling
Prepared by: Professor Sue Grimes, Professor John Donaldson, Dr Gabriel Cebrian Gomez
Centre for Sustainable Production & Resource Efficiency (CSPRE)
Imperial College London
Commissioned by the Bureau of International Recycling
Under the project leadership of Roger Brewster, Metal Interests Ltd.
October 2008
Report on Environmental Benefits of RecyclingPage 1
Foreword 2
Preface 3
Executive Summary 4
Understanding the Brief 5
Methodology 6
Primary and Secondary Metal Production 7
Primary and Secondary Aluminium Production 7
Primary Production 7
Secondary Production 7
Energy Requirement and Carbon Footprint Data for Aluminium 8
Summary 10
Primary and Secondary Copper Production 11
Primary Production 11
Secondary Production 11
Energy Requirement and Carbon Footprint Data for Copper 12
Summary 13
Primary and Secondary Ferrous Production 14
Primary Production 14
Secondary Production 15
Energy Requirement and Carbon Footprint Data for Steel Production 15
Summary 17
Primary and Secondary Lead Production 18
Primary Production 18
Secondary Production 18
Energy Requirement and Carbon Footprint Data for Lead 18
Summary 20
Primary and Secondary Nickel Production 21
Primary Production 21
Secondary Production 21
Energy Requirement and Carbon Footprint Data for Nickel 22
Summary 23
Primary and Secondary Tin Production 24
Primary Production 24
Secondary Production 24
Energy Requirement and Carbon Footprint Data for Tin 24
Summary 25
Primary and Secondary Zinc Production 26
Primary Production 26
Secondary Production 26
Energy Requirement and Carbon Footprint Data for Zinc 27
Summary 29
Primary and Secondary Paper Production 30
Primary and Secondary Production of Paper 30
Primary Production 30
Secondary Production 31
Energy Requirements and Carbon Footprint Data for Paper Production 31
Summary 34
Sensitivity Analyses 35
Variation in Secondary Energy Requirement Compared with Primary 35
Variation in Primary Energy Data from Benchmark Values 35
Variation in Carbon Footprint for Secondary Production Compared with Primary Production 37
Variation in Carbon Footprint Data for Primary Production from the Benchmark Data 37
Variation in Energy by Country 37
Conclusion 42
Bibliography 44
Table of Contents
Report on Environmental Benefits of RecyclingPage 2
The benchmark values were based on the literature data and are intended to reflect what was achievable by both
the primary and secondary metal industries. Given time, the Imperial group would have preferred to have used verifiable
industry data provided for specific plants from different countries but, since this was not possible, sensitivity analyses
on the benchmark data have been carried out. The sensitivity analysis data enable any individuals or groups to input any
industry-specific data values that they might have for comparison with the benchmarks. We believe that the benchmark
information is completely defensible and very conservative. Undoubtedly, sections of industry may claim greater savings
based on their own databases, but there is a danger in over-stressing industry data which have not been independently
verified and which in any case will differ from country to country depending upon the sophistication of both the energy
supply and the metal production plant. The purpose of this report was to produce information on carbon dioxide savings
that is defensible, and to provide a balanced comparison between primary and secondary production from delivery of ore
or secondary material to a metal-producing plant. It is hoped that this report will be used by industry to assess their own
situation in terms of secondary metal production and perhaps to provide information that can be independently verified
to permit further more accurate calculations of carbon dioxide savings in specific cases.
Roger Brewster
Metals Interests Limited
Foreword
The Imperial College remit was to use published literature data to estimate the carbon dioxide savings that could
be made through the recycling of metals and paper. The key to the document produced was the need to avoid bias,
and for this reason the concept of benchmark values was developed.
Report on Environmental Benefits of RecyclingPage 2
Table of Contents
Report on Environmental Benefits of RecyclingPage 3
Imperial College was established in 1907 through the merger of the Royal College of Science, the City and Guilds
College and the Royal School of Mines. In 2007, Imperial College celebrated its centenary and, coincident with this
date, it withdrew its long-standing association with the University of London to become a university in its own right.
Imperial College owns one of the largest estates in the UK university sector and resides in the heart of London with
its main campus at South Kensington. The College has over 2,900 academic and research staff in total and more
than 12,200 students, of whom approximately one third are postgraduates. The College has strong international
links with students from over 110 countries.
Imperial is ranked fifth in the world and has world-renowned academic expertise across its four faculties of Natural
Sciences, Engineering, Medicine and the Imperial College Business School. The College has a number of cross-faculty
initiatives that bring together College-wide expertise to focus on grand challenge research themes; these include
the Grantham Institute for Climate Change, the Energy Futures Laboratories and the Porter Institute for plant-based
biofuels.
The College’s academics have strong research groups delivering innovative solutions in all aspects of science,
engineering, technology and business, and have taken a lead in guiding policy at national and international levels.
In 2005, the SITA Trust (the Trust body of SITA UK) and the Royal Academy of Engineering established a Chair
in Waste Management at Imperial College. The holder of the post, Professor Sue Grimes (the first lady in the UK
to be supported by the Royal Academy of Engineering to a professorship), is championing the creation of a centre for
excellence in Sustainable Production and Resource Efficiency that brings together disparate Imperial research groups
to provide a focus for collaborative research, in particular on key sustainability issues. The Centre draws on the College-
wide expertise in material recovery, mineral wastes, materials science and material reprocessing, biological treatment
of waste, waste electrical and electronic equipment, biofuels, incineration, energy from waste, carbon capture
and sequestration, waste management decision-making tools, landfill science, agricultural waste, radioactive waste,
and epidemiology.
Preface
In March 2008, Roger Brewster of Metal Interests Limited, UK, on behalf of the Bureau of International Recycling (BIR)
in Brussels, commissioned Professor Sue Grimes of Imperial College and her team to carry out research and deliver
a report on the Environmental Benefits of Recycling.
Report on Environmental Benefits of RecyclingPage 3
Table of Contents
Report on Environmental Benefits of RecyclingPage 4
To avoid complications associated with the early stages of whole life cycles of these materials, benchmark energy
requirements and carbon footprints are extracted from: ore or raw material delivered at the production plant for primary
materials; and delivered at the secondary plant for secondary material. Benchmark data are reported per 100,000 tonnes
of material produced to provide a means of direct comparison between primary and secondary production. These data
are tabulated below for each material separately – as energy requirements and savings per 100,000 tonnes
of production of material, and as carbon footprints and savings per 100,000 tonnes of production.
Energy Requirement and Savings in Terajoules (TJ/100,000t)
Material Primary Secondary Saving/100,000 Tonnes
Aluminium 4700 240 4460
Copper 1690 630 1060
Ferrous 1400 1170 230
Lead 1000 13 987
Nickel 2064 186 1878
Tin 1820 20 1800
Zinc 2400 1800 600
Paper 3520 1880 1640
Carbon Footprint and Savings Expressed in Kilotonnes of CO2 (ktCO2)/100,000 Tonnes
Material Primary Secondary Saving/100,000 Tonnes
(% savings CO
2 in paretheses)
Aluminium 383 29 354 (92%)
Copper 125 44 81 (65%)
Ferrous 167 70 97 (58%)
Lead 163 2 161 (99%)
Nickel 212 22 190 (90%)
Tin 218 3 215 (99%)
Zinc 236 56 180 (76%)
Paper 0.17 0.14 0.03 (18%)
The total estimated reduction in CO2 emissions obtained from these data is approximately 500Mt CO2
per annum.
The benchmark figures extracted from the primary literature in this work represent (i) data for situations that are said
to be achievable and (ii) values that are the most acceptable and justifiable.
To deal with variations in the processes involved, sensitivity analyses are provided to show how the data can be handled
to provide comparisons in any situation.
Energy requirement and carbon footprint values for the production of primary and secondary metals and paper
have been obtained from a survey of the primary literature. The metals included in the survey are aluminium,
copper, ferrous, lead, nickel, tin and zinc.
Executive Summary
*
Report on Environmental Benefits of RecyclingPage 4
* Please note that:
• thereportisbasedonresearchliteratureavailableatthetimeofthecommission,notonelddata.
• onlytheprocessofproducingtheproductmaterialisforcomparison,andnotextraction,beneciationandotherancillaryprocesses.
• comparisonismadeonthegroundsoftechnologicalexcellence(benchmarks)andnotoncurrentaveragesofenergyconsumption
or conversion.
Therefore,theresultsofthisreportdonotrepresentabsolutevaluesbutmustbereadinthecontextoftheconsiderationsandassumptionsoutlined
in the methodology.
Table of Contents
Report on Environmental Benefits of RecyclingPage 5
The brief given by Metal Interests Limited on behalf of BIR is to prepare a report on the environmental benefits of recycling,
identifying the savings that can be made by using recyclables as opposed to primaries, and thereby the carbon credentials
of the recycling industries. In the first instance, the materials to be considered in the study are seven metals – aluminium,
copper, ferrous metals, lead, nickel, tin and zinc – and paper.
The overall aim of the project is to provide verifiable data on the influence of recycling on carbon emissions.
Ideally, the project should be carried out under two key phases.
The first phase (Phase I) would involve two steps:
(i) to provide information to the Global Emissions Study of CO
2 for recyclables with preliminary information from available
sources. This should provide a preliminary comparison between the use of primary and recycled materials for paper
and metals;
(ii) to extend the study to provide additional information from primary scientific sources to verify the preliminary data,
and provide new data where appropriate and to produce a report containing verifiable quantitative data.
Since the timescale did not permit detailed optimisation of the data, it is recommended that in the second phase
(Phase II) consideration be given to further quantification and verification of the data using individual secondary material
recovery operations throughout the world. This is considered necessary to ensure that the collective data presented
by trade associations and other bodies can be defended, and to allow the secondary materials industries
to be certain of carbon savings achieved prior to second use of their materials by manufacturing industries.
Phase I, the subject of this report, will be the results of a detailed survey of the primary literature on energy consumption
in primary and secondary material recovery.
The environmental benefits of recycling can be expressed in many ways, including savings in energy and in use
of virgin materials. There appears however to have been very little attempt to express these benefits in terms of carbon
footprint and particularly in savings in carbon dioxide equivalent emissions which would have implications in terms
of both the environment and carbon emission.
Understanding the Brief
Table of Contents
Report on Environmental Benefits of RecyclingPage 6
The most common greenhouse gas emitted is carbon dioxide and a carbon footprint is a quantitative measure of the
carbon dioxide released as a result of an activity expressed as a factor of the greenhouse gas effect of carbon dioxide itself.
Many environmental impacts, including the production of any electricity used in the materials recovery industry, can be
converted into carbon dioxide-equivalent (CO
2-e) emissions.
The methodology used involved:
(i) A detailed survey of the primary literature to extract the data available on energy consumption and associated carbon
emissions.
(ii) The use of energy data and associated carbon emissions, extracted to highlight differences between primary and
secondary production of seven metals - aluminium, copper, ferrous metals, lead, nickel, tin and zinc - and of paper.
The assumptions made in all information provided are identified and the units used in the calculations are expressed
as MegaJoules per kilogram of product for energy and tonnes of CO
2 per tonne of product for carbon emissions.
(iii) For each material for both primary and secondary production, best estimates of benchmark energy consumptions
and carbon footprints are used in the comparisons as examples of what can be achieved.
(iv) A summary table comparing the energy consumption and carbon footprint of primary and secondary production
of aluminium, copper, ferrous metals, lead, nickel, tin and zinc, and of paper, is compiled per 100,000 tonnes
of production. For all materials, the life cycle boundaries are set to compare the production of (a) primary material
from raw material delivered to the primary production plant to final product, and (b) secondary materials delivered
to the recycling plant to final product.
(v) Sensitivity analyses are carried out on the data obtained using the benchmark values in the summary table to show
how these data can be handled to deal with variations in input such as the details of the energy sources used,
the energy/fuel mix for different countries, and the energy efficiency of specific recovery plants.
This report sets out in the section ‘Primary and Secondary Metals Production’ (p.7) the data gathered for each metal.
The energy data obtained are expressed in flow diagrams and all references to the primary literature are given.
For the purposes of comparing primary and secondary production, however, the results for energy consumption and
carbon footprint are those for the following processes: (i) conversion of ore concentrate to metal in primary production,
and (ii) from scrap and other secondary materials delivered to a recycling process and converted to metal. This choice
of life cycle boundaries avoids the complications associated with differences in mining and beneficiation of ores and
in the collection and transport of scrap to a recycling process.
The data for primary and recycled paper are compared in the section ‘Primary and Secondary Paper Production’ (p.30).
Sensitivity analyses are provided on page 35 to show how data can be handled to provide comparisons and deal with any
variations in processes. Conclusions (p42) drawn from Phase I of the study are presented.
This report contains the results of a detailed survey to obtain information on energy consumption in primary and
secondary material recovery and the carbon emissions associated with these processes. The information obtained
is used in calculations to assess the environmental benefits of recycled materials expressed in both energy terms
and as a carbon footprint.
Methodology
Table of Contents
Report on Environmental Benefits of RecyclingPage 7
Primary and Secondary Aluminium Production
In 2006, the tonnages of primary and secondary aluminium produced were approximately 34 and 16Mt respectively,
so that about one third of aluminium demand is satisfied from secondary production.
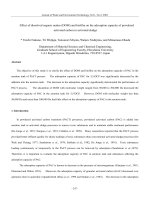
The difference between primary and secondary production is illustrated in the following figure.
Primary and Secondary Production of Aluminium
Primary Production
In the Bayer process, the bauxite ore is treated by alkaline digestion to beneficiate the ore. Although the red mud produced
in this process is a waste which has major environmental impacts because about 3.2 tonnes of mud are produced
per tonne of aluminium produced, the comparison between primary and secondary aluminium production made
in this report starts at the point of delivery of the alumina concentrate to the processing plant.
Primary production of aluminium from the ore concentrate is achieved by an electrolytic process in molten solution.
The Hall Héroult process consists of electrolysis in molten alumina containing molten cryolite (Na
3AlF6) to lower
the melting point of the mixture from 2050ºC for the ore concentrate to about 960ºC.
The electrolysis cell consists of a carbon-lined reactor which acts as a cathode, with carbon anodes submerged
in the molten electrolyte. In the electrolysis process, the aluminium produced is denser than the molten electrolyte
and is deposited at the bottom of the cell, from where it is cast into ingots. At the anodes, the anodic reaction is the
conversion of oxygen in the cell to carbon dioxide by reaction with the carbon of the anodes. The process results
in the production of between 2 and 4% dross.
Secondary Production
All secondary aluminium arisings are treated by refiners or remelters. Remelters accept only new scrap metal or efficiently
sorted old scrap whose composition is relatively known. Refiners, on the other hand, can work with all types of scrap as
their process includes refinement of the metal to remove unwanted impurities. In both processes, the molten aluminium
undergoes oxidation at the surface which has to be skimmed off as a dross. In Europe, about 2.5% of the feedstock
aluminium in the refining process is converted to dross.
Primary Production
Old and New Scrap
Dross
Bauxite Mining
Scrap
Refiners Remelters
Casting Casting
Alumina Production/Bayer Process
Hall Heroult-Electrolysis
Casting
Secondary Production
New Scrap
The metals are discussed in the order: aluminium, copper, ferrous metals, lead, nickel, tin and zinc.
Primary and Secondary Metals Production
Table of Contents
Report on Environmental Benefits of RecyclingPage 8
Energy Requirement and Carbon Footprint Tables for Aluminium
The gross energy requirement for primary aluminium production has been estimated at 120MJ/kg Al based on using
hydroelectricity with 89% energy efficiency. As alternatives to hydroelectricity, use of black coal for electricity generation
with an efficiency of 35% or natural gas with an efficiency of 54% would give gross energy estimates of approximately
211 and 150MJ/kg Al respectively. The data in the following table are the gross energy requirements that have been quoted
in various publications for production of primary aluminium by the Bayer-Hall Héroult route, along with the assumptions
that the authors made on the fuel used.
Energy Requirements of Production of Primary Aluminium
Energy Requirements Bayer Hall Héroult Route
Source MJ/kg Al Notes
Norgate 211 Coal (c.e. 35%)
Norgate 150 Gas (c.e. 54%)
Norgate 120 Hydro (c.e. 89%)
Cambridge 260 Coal (c.e. 35%)
Aus Alu Council 182-212 Coal (c.e. 35%)
Grant 207 Coal (c.e. 35%)
Choate and Green 133 US average
(c.e. – refers to conversion efficiency)
The electricity consumption in the Hall Héroult process is the most energy-demanding aspect of primary production
of aluminium. The energy requirements reported in the literature for the Hall Héroult process alone (i.e. for conversion
of treated ore to metal) are in the following table along with the assumptions made on the fuel used.
Energy Requirements of the Hall Héroult Process
Energy Requirements Hall Héroult Process Only
Source MJ/kg Al Notes
Schwarz 47 Electricity benchmark
IAI 54 Electricity average
Norgate 66 Electricity max
Norgate 46 Electricity benchmark
IAI 69 Electricity max
Cambridge 55 Hydro efficiency 95%
Cambridge 160 Coal efficiency 35%
Cambridge 50 100% efficient
Choate and Green 56 US average
For the purpose of comparison of the energy requirements and associated carbon emissions for primary aluminium
production with data for secondary aluminium production, we have assumed that the benchmark process would involve
an electricity benchmark figure of about 47MJ/kg.
Table of Contents
Report on Environmental Benefits of RecyclingPage 9
The literature data on the carbon footprint for primary production of aluminium following the Bayer-Hall Héroult route and
for the Hall Héroult process alone are in the following tables, respectively, along with the assumptions made by the authors
on the fuel used.
Carbon Footprint for Primary Production of Aluminium
Carbon Footprint Bayer-Hall Héroult Route
Source Carbon Footprint
(tCO
2/t Al)
Energy Source
Norgate 22.4 Coal
Grant 18.2 Coal
Kvande 24 Coal
IAI 20 Coal
IAI 9.8 Hydro 57%, Coal 28%, Natural Gas 9%, Nuclear 5%, Oil 1%
Choate and Green 9.11 US Average
Choate and Green 5.48 Inert Anode, Wetted Cathode, ACD 2cm
Choate and Green 8.56 Carbothermic Reaction
Choate and Green 6.71 Wetted Cathode and ACD of 2cm
Choate and Green 8.95 Chloride Reduction of Kaolinite Clays
Carbon Footprint for the Hall Héroult Process
Carbon Footprint Hall Héroult Process Only
Source Carbon Footprint
(tCO
2/t Al)
Notes
Norgate 7.2 Drain Cathode, Inert Anode, Low Temp Electrolyte, Natural Gas 54%
Norgate 4.6 Drain Cathode, Inert Anode, Low Temp Electrolyte,
Hydroelectricity 89%
IAI 7.7 Average IAI
Choate and Green 3.83 US Average (Typical)
It has been reported that the production of one tonne of aluminium from scrap requires only 12% of the energy required
for primary production. Energy savings of between 90 and 95% have also been reported for secondary aluminium
production compared with primary production, starting with mining the ore and not with as-received concentrate.
The energy requirement to recycle aluminium has been calculated at between 6 and 10MJ/kg assuming efficiencies
of 60-80% in the recycling process.
The energy requirement data for secondary aluminium production are reported in the following table as mean values
for melting and casting and benchmark values for melting and casting. The carbon footprint data included in the table
on the following page have been calculated on the basis of these energy requirement data, using the carbon emission
factor for the UK.
Table of Contents
Report on Environmental Benefits of RecyclingPage 10
Energy Requirement of Secondary Processes for the Production of Aluminium from Scrap
Process Mean in MJ/kg Benchmark in MJ/kg
Remelting 4.5 2.1
Casting 0.5 0.3
Carbon Footprint for the Secondary Processes for the Production of Aluminium from Scrap
Process CO2 Emissions
(tCO
2/t)
Benchmark
(tCO2/tAl)
Remelting 0.54 0.25
Casting 0.06 0.04
Summary
Using the benchmark data for primary and secondary aluminium production from delivered ore concentrate and scrap
respectively, the energy requirements for the production of 100,000 tonnes of aluminium are:
Energy requirement for primary production: 4700TJ
Energy requirement for secondary production: 240TJ
Using the energy data, the carbon footprints for primary and secondary production of aluminium on the same basis are:
Carbon footprint for primary production: 383kt CO
2
Carbon footprint for secondary production: 29kt CO2
Sensitivity analyses on these data are given on page 35 of this report to illustrate the effects of deviations from
benchmark conditions.
Table of Contents
Report on Environmental Benefits of RecyclingPage 11
Primary and Secondary Copper Production
According to the US Geological Survey, world copper production in 2007 was 15.6Mt. The percentage of copper
recovered from scrap as a percentage of total copper produced has been reported to vary with geographical location
within the range 19-45%.
Primary Production
The major route in primary copper production is the pyrometallurgical route from copper sulfide ores that have been
concentrated usually by flotation to give the concentrate used in the pyrometallurgical process. A very small percentage
of primary copper is recovered from copper ores hydrometallurgically.
In the pyrometallurgical process, the concentrates are roasted to produce a copper matte which contains between
30-50% copper. The matte is reduced to copper metal in a converter process, and the final product is generally purified
by dissolving the copper metal obtained in sulfuric acid and recovering high-purity copper from this solution
by electrowinning.
The hydrometallurgical route involves leaching of the copper oxide ore with sulfuric acid to produce a solution from which
copper metal can be recovered on the cathodes of an electrowinning process.
Schematic of Copper Production
Secondary Production
Secondary copper can be produced from scrap and other copper containing materials by pyrometallurgical and
hydrometallurgical processes that are similar to those used in primary metal production. The following figure for example
is a flow chart of secondary pyrometallurgical copper production.
Pyrometallurgical
Benefication
Roasting
Smelting
Fire Refining
Electrorefining
Solvent Extraction (SX)
Acid Leaching
Electrowinning
Copper Ore
Waste Streams for Copper Related Processes, CuO Ore
Scrap
Cu Concentrate
Copper Matte
Cu Cathode
Hydrometallurgical
Table of Contents
Report on Environmental Benefits of RecyclingPage 12
Secondary Copper Production By Pyrometallurgy
Energy Requirement and Carbon Footprint Tables for Copper
There are literature reports suggesting that the energy requirement for secondary copper production is between
35 and 85% that for primary production – the higher value is that reported by the Institute of Scrap Recycling Industries,
and this would lead to an estimated 7.3MJ/kg energy saving.
The data for energy required for primary copper production via pyrometallurgical and hydrometallurgical routes are given
in The following figure, and the figure also shows the point in the energy requirement diagram at which scrap copper
would enter the pyrometallurgical process. These are the data on which comparisons between primary and secondary
production have to be based. The data quoted on the extreme left of the figure are for energy calculations based
on different ore grades and by different authors.
Energy Requirements for Copper Production
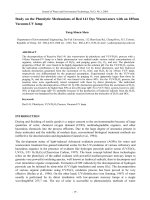
The carbon footprint data for copper production from these data are presented in the following figure.
Pyrometallurgical
Mining
Benefication
33MJ/kg
(ore 3% Cu)
19.1MJ/kg
(Europe)
41.8MJ/kg
-15MJ/kg
10.6
57.3MJ/kg
(0.5% Cu ore)
47.0MJ/kg
(Boliden
0.5% Cu)
Roasting
Smelting
Fire Refining 2.8MJ/kg
Electrorefining 3.5MJ/kg
Solvent Extraction (SX)
Acid Leaching
Electrowinning
Copper Ore
Waste Streams for Copper Related Processes, CuO Ore
Scrap
Cu Concentrate
Copper Matte
Cu Cathode
Hydrometallurgical
64MJ/kg
(from CuS ore
2% Cu)
16.9MJ/kg 24MJ/kg
+1.5 MJ/kg
acid plant
SLAG Blister Copper
Low Grade Scrap
Convertor
Anode Furnace Refining
Smelting
Black Copper
High Grade Scrap
Table of Contents
Report on Environmental Benefits of RecyclingPage 13
Carbon Footprint for Copper Production
The benchmark energy requirements for the production of cathode copper metal from primary copper ore concentrate
by pyrometallurgy, by hydrometallurgy from soluble copper ores, and for secondary cathode copper metal from scrap
and secondary sources are in the following table.
Benchmark Energy Requirements for Copper Production
Copper Recovery Method Energy Requirement
(MJ/kg Cu)
Carbon Footprint
(tCO
2/t Cu)
Pyrometallurgy from Ore Concentrate 16.9 1.25
Hydrometallurgy from Oxide Ores 25.5 1.57
Secondary Production from Scrap 6.3 0.44
Summary
Using the benchmark data for primary and secondary copper production from delivered ore concentrate and scrap
respectively, the energy requirements for the production of 100,000 tonnes of copper are:
Energy requirement for pyrometallurgical primary production: 1690TJ
Energy requirement for hydrometallurgical primary production: 2550TJ
Energy requirement for secondary production: 630TJ
Using the energy data, the carbon footprints for primary and secondary production of copper on the same basis are:
Carbon footprint for pyrometallurgical primary production: 125kt CO
2
Carbon footprint for hydrometallurgical primary production: 157kt CO2
Carbon footprint for secondary production: 44kt CO2
Sensitivity analyses on these data are given on page 35 of this report to illustrate the effects of deviations from
benchmark conditions.
Pyrometallurgical
Mining
Benefication
Roasting
Smelting
Fire Refining
Electrorefining
Solvent Extraction (SX)
Acid Leaching
Electrowinning
Mining
Copper Ore
Waste Streams from
Copper Related Processes
CuS Ore
Cu Concentrate
Copper Matte
Cu Cathode
Hydrometallurgical
3.2tCO2/t
(ore 3% Cu)
0.81tCO2/t
0.21tCO
2/t
0.23tCO2/t
1.48tCO2/t
+ 0.09tCO2/t
acid plant
1.25tCO
2/t
Scrap
Table of Contents
Report on Environmental Benefits of RecyclingPage 14
Primary and Secondary Ferrous Production
Primary Production
In 2006, world production of steel was 1,245Mt in which scrap consumption amounted to approximately 440Mt.
A schematic representation of iron recovery and steel manufacture is in the following figure. There are four main routes
used for the production of steel, namely: blast furnace/basic oxygen furnace (BF-BOF); electric arc furnace (EAF);
direct reduction (DR) and smelting reduction (SR).
Iron Recovery and Steel Manufacture
The BF-BOF route is the most complex and involves the reduction of iron oxide ore with carbon in the furnace.
Liquid iron produced in the blast furnace is referred to as pig iron, and contains about 4% carbon. The amount of carbon
has to be reduced to less than 1% for use in steelmaking, and this reduction is achieved in a basic oxygen furnace (BOF)
in which carbon reacts with oxygen to give carbon dioxide. The oxidation reaction is exothermic and produces enough
energy to produce a melt. Scrap or ore is introduced at this stage to cool the mix and maintain the temperature
at approximately 1600-1650°C. Blast furnaces consume about 60% of the overall energy demand of a steelworks,
followed by rolling mills (25%), sinter plants (about 9%) and coke ovens (about 7%).
Direct reduction involves the production of primary iron from iron ores to deliver a direct reduced iron (DRI) product from
the reaction between ores and a reducing gas in the reactor. The DRI product is mainly used as a feedstock in an electric
arc furnace (EAF). The main advantage of this process is that the use of coke as a reductant is not required, thus avoiding
the heavy burden on emissions resulting from coke production and use.
The electric arc furnace (EAF) process involves the melting of DRI using the temperature generated by an electric arc
formed between the electrode and the scrap metal, producing an energy of about 35MJ/s which is sufficient to raise the
temperature to 1600ºC. Depending on the quality of product required, the output of the EAF might need further treatment
by secondary metallurgical and casting processes.
Smelting reduction (SR) is a current development that involves a combination of ore reduction and smelting in one reactor,
without the use of coke. The product is liquid pig iron which can be treated and refined in the same way as pig iron from
the blast furnace.
Mining
Pelletisation
Sintering
Limestone
Coke
Fuel
Ironmaking
BF-Blast Furnace DRI-Direct Reduced Iron
Pig Iron Pig Iron
Basic Oxygen Furnace Steel
Electric Arc Furnace
(EAF)
Primary Production Secondary Production
Scrap Collection
and Preparation
Mining
BF-BOF Route DRI-EAF Route EAF Route
Table of Contents
Report on Environmental Benefits of RecyclingPage 15
Secondary Production
Electric arc furnaces (EAF) are used to produce steel from scrap using the same process as that described for the use
of DRI as feedstock. Production of steel from scrap has been reported to consume considerably less energy compared
to production of steel from iron ores.
Energy Requirements and Carbon Footprint Tables for Steel Production
The literature values for the energy requirements and carbon footprints for the production of steel by different routes
are in the following eight tables.
The energy requirements reported for the whole life cycle of steel production from ore to metal via the BF/BOF route
and for the conversion of ore concentrate to steel by this route, are presented in the following two tables.
Energy Requirements for Steel Production from Ore via the BF/BOF Route
BF-BOF Route
Source Energy Requirement
(MJ/kg Steel)
Das and Kandpal 29.2
Hu et al 25.5
Sakamoto 25
Norgate 22
Price et al (Open Hearth) 20.1
Price et al 16.5
Phylipsen et al 15.17
Mean (SD) 21.9 (5.1)
Energy Requirements for Steel Production from Ore Concentrate via the BF/BOF Route
BF-BOF Only
Energy Requirement
(MJ/kg Steel)
Ertem and Gurgen 16.58
Price et al 15.6
Phylipsen et al 15.47
Sakamoto 13.4
Mean (SD) 15.3 (1.3)
Carbon Footprint for Steel Production via the BF/BOF Route
BF-BOF Route
Source Carbon Footprint
(tCO
2/t Steel)
Norgate 2.3
Orth et al 2.23
Sakamoto 2.15
Orth et al 2.14
Table continues on page 16
Table of Contents
Report on Environmental Benefits of RecyclingPage 16
Carbon Footprint for Steel Production via the BF/BOF Route (Continued from Page 15)
BF-BOF Route
Source Carbon Footprint (tCO
2/t Steel)
Das and Kandpal 2.12
Gielen and Moriguchi 2
Hu et al 1.97
Orth et al 1.82
Orth et al 1.69
Wang et al 1.32
Mean (SD) 1.97 (0.30)
The reported energy requirements for the DRI step of the steel production process, and for the DRI + EAF steps combined,
along with assumptions made on the energy source used, are represented in the following two tables. The data for the carbon
footprints associated with the energy source used are presented separately in the table below.
Energy Requirements for Steel Production for the DRI Step Only
DRI Only
Energy Requirement (MJ/kg Steel)
Gielen and Moriguchi 10
Phylipsen et al 10.93
Energy Requirements for Steel Production for the DRI + EAF Steps
DRI + EAF
Energy Requirement
(MJ/kg Steel)
Note
Das and Kandpal 36.9 Coal (India)
Das and Kandpal 24 Gas (India)
Price et al 19.2 80% DRI + 20% scrap
Carbon Footprint for Steel Production for the DRI + EAF Steps
DRI + EAF
Carbon Footprint
(tCO
2/t Steel)
Note
Das and Kandpal 3.31 Coal (India)
Orth et al 1.74 Coal + Circofer
Das and Kandpal 1.57 Gas
Orth et al 1.46 Gas + Circofer
Gielen and Moriguchi 0.7 Gas
Mean (SD) 1.76 (0.96)
The energy requirements and carbon footprints for the electric arc furnace route for production of steel from secondary
sources are in the following two tables.
Table of Contents
Report on Environmental Benefits of RecyclingPage 17
Energy Requirements for Steel Production from Scrap in an Electric Arc Furnace
EAF Route
Source Energy Requirement (MJ/kg Steel)
Das and Kandpal 14.4
Hu et al 11.8
Hu et al 11.2
Sakamoto et al 9.4
Mean (SD) 11.7 (2.1)
Carbon Footprint for Steel Production in an Electric Arc Furnace
EAF Route
Source Carbon Footprint (tCO
2/t Steel)
Das and Kandpal 1.18
Wang et al 0.64
Hu et al 0.59
Sakamoto et al 0.56
Hu et al 0.54
Mean (SD) 0.70 (0.27)
The benchmark energy requirements for the production of steel from primary ore concentrate by the BF-BOF route,
by the DRI + EAF route and from scrap and secondary sources via the EAF route are in in the following table.
Benchmark Energy Requirements for Steel Production
Steel Recovery Method Energy Requirement
(MJ/kg Steel)
Carbon Footprint
(tCO
2/t Steel)
BF/BOF Route (Mean-SD) 14 1.67
DRI + EAF Route (Benchmark) 19.2 0.7
EAF Route (Mean) 11.7 0.7
Summary
Using the benchmark data for primary and secondary steel production from delivered ore concentrate and scrap
respectively, the energy requirements for the production of 100,000 tonnes of steel are:
Energy requirement for primary production BF-BOF route: 1400TJ
Energy requirement for primary production DRI + EAF route: 1920TJ
Energy requirement for secondary production EAF route: 1170TJ
Using the energy data, the carbon footprints for primary and secondary production of steel on the same basis are:
Carbon footprint for primary production BF-BOF route: 167kt CO
2
Carbon footprint for primary production DRI + EAF route: 70kt CO2
Carbon footprint for secondary production EAF route: 70kt CO2
Sensitivity analyses on these data are given on page 35 of this report to illustrate the effects of deviations from benchmark conditions.
Table of Contents
Report on Environmental Benefits of RecyclingPage 18
Primary and Secondary Lead Production
The annual production of lead is about 6.2M tonnes with approximately half of that originating from ore.
The schematic diagram of the production of primary lead and lead from scrap is in the following figure.
Schematic of Primary Lead Production
Primary Production
Lead sulfide ores usually contain less than 10% of the metal by weight and are concentrated to around 70% before
processing. The main method of lead recovery from ores is a blast furnace process that involves three main steps:
sintering, smelting and refining. Lead is also recovered in the Imperial smelting furnace process that is designed
to recover both lead and zinc from ores. The energy demand for the Imperial smelting process is higher than that for
the blast furnace process for lead but is used because it has a significantly lower energy demand for zinc production
than alternative processes.
Secondary Production
Lead is easily recycled via pyrometallurgical routes and can be recycled many times without any deterioration or
degradation of its properties. A very high proportion of scrap lead comes from spent vehicle batteries. Secondary lead
from this source is usually smelted at 1260°C in a rotary reverberatory furnace to produce a slag with a high lead content,
along with lead metal for refining. The slag can then be heated in a blast furnace at 1000°C with coke to produce lead
(purity 75-85%) and a slag with a low lead content.
Energy Requirement and Carbon Footprint Tables for Lead
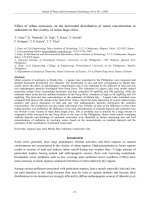
The energy requirements for the production of lead from primary sources by the blast furnace and Imperial smelting
furnace routes are in the following figure.
Concentration
PbS Ore
Pb
Scrap Pb from Batteries
(60% Pb, 15% PbO
2, 12% PbSO4)
75-85% Pb
Slag Treatment
Zn/Pb Ore
Blast Furnace
Imperial Smelting Furnace
Recycling
Sintering
Smelting
Refining
Concentration
Sintering
Smelting
Refining
Smelting
Refining
Table of Contents
Report on Environmental Benefits of RecyclingPage 19
Energy Requirements for the Production of Lead from Primary Sources
Primary Production
In 2002, it was reported that 20MJ/kg of energy are required to produce 1kg of lead in the blast furnace process while
the Imperial smelting furnace process requires 32MJ/kg for the whole life cycle including mining and concentration,
assuming 98.3% and 95% recoveries in the blast furnace and Imperial smelting furnace respectively. The energy
requirements excluding the mining and mineral processes obtained from several different sources are reported to be
2.4MJ/kg Pb for the blast furnace route and 2.71MJ/kg Pb for the Imperial smelting furnace route.
Secondary Production
The literature contains reports that claim secondary production of lead results in a 60-65% energy saving compared to primary
production. Using these data, Norgate estimates a general energy demand of 9.1MJ/kg for secondary lead production.
Life cycle analysis of the secondary process has been conducted, including the processes of disaggregation and remanufacturing
that would be carried out at a reprocessing facility. From the data, energy consumption at a reprocessing plant was estimated
at a total of 0.40MJ/kg Pb.
The energy chosen as a benchmark for secondary production is that of calculated theoretical melting energies with 50%
furnace efficiency.
Carbon Footprint for Lead Production
Concentration
PbS Ore
Pb
Zn/Pb Ore
Blast Furnace
Imperial Smelting Furnace
Sintering
Smelting
Refining
20MJ/kg
(Coal 35%,
Ore 5.5% Pb,
Concentrated
57.9% Pb)
~2.2MJ/kg
~6.0MJ/kg
~1.5MJ/kg
~10MJ/kg
(Coal 35%,
Ore 5.5% Pb,
Concentrated
57.9% Pb)
32MJ/kg
(Coal 35%,
Ore 5.5% Pb,
Concentrated
57.9% Pb)
Concentration
Sintering
Smelting
Refining
Concentration
PbS Ore
Pb
Zn/Pb Ore
Blast Furnace
Imperial Smelting Furnace
Sintering
Smelting
Refining
2.1tCO2/t
(Coal 35%,
Ore 5.5% Pb,
Concentrated
57.9% Pb)
1.63tCO2/t 2.50tCO2/t 3.2tCO2/t
(Coal 35%,
Ore 5.5% Pb,
Concentrated
57.9% Pb)
Concentration
Sintering
Smelting
Refining
Table of Contents
Report on Environmental Benefits of RecyclingPage 20
Carbon footprint data for production of lead calculated by Norgate are given in the previous figure. In 2001, Robertson
produced a life cycle analysis of primary lead production based on data from two plants in Australia, one of which is the third
largest producer of lead in the world. His calculations for emissions yielded a total value of 4.202tCO
2e/t Pb; this value is
greater than that obtained by Norgate but it is not absolutely clear how Robertson’s data were derived and what assumptions
were made.
The benchmark energy requirements for the production of lead metal from primary ore concentrate and for secondary
lead from scrap are in in the following table.
Benchmark Energy Requirements for Lead Production
Lead Recovery Method Energy Requirement
(MJ/kg Pb)
Carbon Footprint
(tCO
2/t Pb)
Primary 10 1.63
Secondary Assuming 50% Furnace Efficiency 0.129* 0.015**
*Theoretical minimum energy requirement to melt lead assuming furnace efficiency of 50%
**Based on electricity consumption (UK average emission factor)
Summary
Using the benchmark data for primary and secondary lead production from delivered ore concentrate and scrap respectively,
the energy requirements for the production of 100,000 tonnes of lead are:
Energy requirement for primary production of lead: 1000TJ
Energy requirement for secondary production of lead: 12.9TJ
Using the energy data, the carbon footprints for primary and secondary production of lead on the same basis are:
Carbon footprint for primary production of lead: 163kt CO
2
Carbon footprint for secondary production of lead: 1.5kt CO
2
Sensitivity analyses on these data are given on page 35 of this report to illustrate the effects of deviations from
benchmark conditions.
Table of Contents
Report on Environmental Benefits of RecyclingPage 21
Primary and Secondary Nickel Production
The International Nickel Study Group quotes a global primary production figure of 1.44Mt for nickel in 2007, and it has
been estimated that 0.35M tonnes of nickel is recycled from about 4.5Mt of scrap every year.
Primary Production
There are two types of nickel ore that are treated in different ways. The common ores are nickel sulfides (containing
about 2% Ni) and these are processed pyrometallurgically. Laterite oxide ores (containing approximately 1% Ni)
are treated hydrometallurgically to produce nickel metal, or pyrometallurgically to produce ferronickel. The following
figure is a schematic showing the primary production routes.
Schematic for Primary Production of Nickel
The pyrometallurigical process involves concentration of the sulfide ore followed by smelting to produce a matte which
is converted to nickel metal and refined by routes such as the Sherritt-Gordon process. Final nickel refining is often carried
out by an electrowinning process.
Laterite ores with nickel concentrations greater than 1.7% (saprolite ores) are processed pyrometallurgically in a rotary
kiln and an electric furnace to obtain ferronickel. Laterite ores with less than 1.5% nickel (limonite ores) are processed
via a hydrometallurgical leaching route with the metal generally being recovered electrolytically.
Secondary Production
Nickel is recycled in different ways depending on its original application. Nickel alloys are often recycled as the same
alloys, for example the nickel in stainless steel, where about 40% of the nickel used in the production of stainless steel
originates from post-consumer stainless steel scrap. Other secondary nickel arisings tend to be recycled by primary
nickel smelters.
Sulfide Ore
Laterite Ores
Nickel
Limonite Ore
Concentration Concentration Ore Preparation
Saprolite Ore
Ferronickel
Concentration
Smelting Reduction Roast Pressure Acid Leaching Rotary Kiln
Ammonia Leach Neutralisation Smelting
Converting
Solvent Extraction Solvent Extraction
Electrowinning
Converting
Refining
Reduction
Sintering
Table of Contents
Report on Environmental Benefits of RecyclingPage 22
Energy Requirement and Carbon Footprint Tables for Nickel
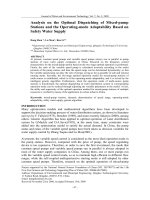
The energy requirement and carbon footprint data reported in the literature are in the following two figures. The data in
the figures are based on publications by Norgate, Kellogg, Chapman and Roberts for the whole life cycle of nickel production
from mining to metal, and are expressed as gross energy requirement (GER) in MJ/kg and carbon footprint in kg CO
2eq/kg Ni.
Energy Requirement for Production of Nickel
The Norgate data for the whole life cycle – from mining a sulfide ore containing nickel to the recovery of nickel by flash
furnace smelting with Sherritt-Gordon refining to recover 78% of the nickel and assuming a 35% energy efficiency –
give a GER equal to 114MJ/kg and a carbon footprint of 11.4kgCO
2eq/kg Ni. The smelting and refining processes alone
are reported to require 2900kWh/t of electricity, producing a carbon footprint of 8.5kgCO
2eq/kg Ni.
Carbon Footprint for Production of Nickel
Laterite Ores
Nickel
Limonite Ore Saprolite Ore
Ferronickel
Concentration
Rotary Kiln
Smelting
Solvent Extraction
Electrowinning
Converting
Refining
Sintering
Ore Preparation
Pressure Acid Leaching
Neutralisation
Concentration
Reduction Roast
Ammonia Leach
Solvent Extraction
Reduction
Sulfide Ore
Concentration
Smelting
Converting
114MJ/kg (coal at 35% efficiency from 2.3% Ni ore)
152MJ/kg (32.5% power plant efficiency)
100-200MJ/kg
20.64MJ/kg
340-800MJ/kg (all laterite ore processes generally)
194MJ/kg (coal at 35% efficiency from 1.0% Ni ore)
Laterite Ores
Nickel
Limonite Ore Saprolite Ore
Ferronickel
Concentration
Rotary Kiln
Smelting
Solvent Extraction
Electrowinning
Converting
Refining
Sintering
Ore Preparation
Pressure Acid Leaching
Neutralisation
Concentration
Reduction Roast
Ammonia Leach
Solvent Extraction
Reduction
Sulfide Ore
Concentration
Smelting
Converting
11.4kgCO2eq/kg
8.5kgCO
2eq/kg
15kgCO
2eq/kg
16.1kgCO
2eq/kg
Table of Contents
Report on Environmental Benefits of RecyclingPage 23
Norgate’s data for the whole life cycle of a 1% laterite ore – with nickel recovery by pressure acid leaching followed by solvent
extraction and electrowinning to recover 92% of the nickel assuming a 35% energy efficiency – give a GER value of 194MJ/kg
and a carbon footprint of 16.1kgCO
2eq/kg Ni. The pressure leach and solvent extraction/electrowinning stages of the
hydrometallurgical process are reported to require 7651kWh/t of electricity, giving a carbon footprint of 15kgCO
2eq/kg Ni.
A study of the effects of ore concentration on GER and carbon footprint suggested that lowering the ore grade from 2.4%
to 0.3% Ni resulted in an increase in GER from 130MJ/kg to 370MJ/kg and in carbon footprint from about 18kgCO
2eq/kg Ni
to 85kgCO
2eq/kg Ni.
Chapman and Roberts report GER values for the whole life cycle of 100-200MJ/kg for processing sulfide ores
and 340-800 MJ/kg for processing laterite ores. Kellogg’s energy requirement value is 152MJ/kg to recover nickel
from processing to mining nickel ingot, assuming 32.5% energy efficiency.
On the basis of an assumption of 90% energy savings for secondary nickel production and based on the European average
for hydrometallurgical and pyrometallurgical use, Norgate estimates a 15.4-15.8MJ/kg energy requirement for secondary
nickel recovery.
Taylor has reported that recycling of nickel-based superalloys into a superalloy ingot requires only 14% of the primary
“material fuel equivalent”, including transportation, sorting and processing.
The benchmark energy requirements for the production of nickel metal from primary ore concentrate and for secondary
nickel metal from scrap and secondary sources are in the following table.
Benchmark Energy Requirements for Nickel Production
Nickel Recovery Method Energy Requirement
(MJ/kg Ni)
Carbon Footprint
(tCO
2/t Ni)
Primary Production of Nickel 20.64 2.12
Secondary Production from Scrap 1.86* 0.22**
*Theoretical minimum requirement to melt assuming furnace efficiency of 50%
**Based on melting recovery using UK average electricity emission factor to estimate CO2 emissions
Summary
Using the benchmark data for primary and secondary nickel production from delivered ore concentrate and scrap
respectively, the energy requirements for the production of 100,000 tonnes of nickel are:
Energy requirement for primary production of nickel: 2064TJ
Energy requirement for secondary melting of nickel: 186TJ
Using the energy data, the carbon footprints for primary and secondary production of nickel on the same basis are:
Carbon footprint for primary production of nickel: 212kt CO
2
Carbon footprint for secondary melting of nickel: 22kt CO2
Sensitivity analyses on these data are given on page 35 of this report to illustrate the effects of deviations from
benchmark conditions.
Table of Contents